


Introduction
Fruits and vegetables (FVs) are a diverse group of plant foods that are an important component of a healthy diet(1). Dietary guidelines in different countries often include different classifications for FVs, either considering them as a distinct group or classifying them together. Many researchers claim that fruits should be regarded as a subgroup of vegetables owing to a lack of a clear definition for fruits, a scientific justification for the nutritional content of fruit servings and a standard amount or serving size for fruits(Reference Jayawardena and Sooriyaarachchi2). The variety (or diversity) and quantity of FVs are two distinct concepts. Being phytochemically and nutritionally different, a greater variety of FVs may ensure exposure to a broad spectrum of antioxidants and phytonutrients, which are required to reduce the prevalence of chronic diseases. This increase in the variety of FVs can be achieved by consuming FVs from either the same or different food groups(Reference Torheim, Ouattara and Diarra3–Reference Bhupathiraju and Tucker5).
The health-promoting properties of FVs resulting from antioxidants, phytoestrogens and anti-inflammatory agents can be attributed to the presence of beneficial nutrients and non-nutrient bioactive compounds such as dietary fibre, vitamins, minerals, phytochemicals, plant sterols and flavonoids. Different types of FVs contain varying amounts of protective components. For example, cruciferous and allium vegetables containing organosulfur compounds are known for their protective role against certain types of cancers, whilst green leafy vegetables (GLVs), especially lettuce or spinach, are a rich source of iron, calcium, potassium, magnesium, vitamins A, C, E and K, fibre, folate and carotenoids whereas citrus fruits, strawberries, green peppers, and white potatoes contain ample amounts of vitamin C. Hence, consuming a variety of FVs provides the nutrients necessary(Reference Prieto and Miatello6–Reference Yalcin, Capar, Yildiz and Wiley8) to enhance both the quality and diversity of diets, which could have significant implications for improving the health of populations, particularly in LMICs(Reference Ramsay, Shriver and Taylor9).
The beneficial effects of FVs on human health have been studied extensively. Numerous studies have shown the association between consuming a variety of FVs in adequate quantities and quality and a reduced risk of hypertension, cardiovascular disease (CVD), stroke, cancer, diabetes, obesity, cognitive disorders and age-related functional decline(Reference Wu, Sun and He10–Reference Zielinska, Bialecka and Pietruszka16). According to the WHO/FAO, an adult should consume at least five servings or 400 g of FVs per day (two servings of fruits and three servings of vegetables), excluding starchy vegetables(Reference Pem and Jeewon17,Reference Hall, Moore and Harper18) . Despite the proven health benefits of FVs, lower intakes have been reported worldwide(Reference Hall, Moore and Harper18), which accounted for an estimated 1·7 million deaths in 2017(19). Major barriers contributing to this outcome, particularly in LMICs, are demographic, socioeconomic, psychosocial, behavioural, structural and environmental factors. Including the recommended quantity of FVs in a dietary regime is a practical strategy to optimise health, reduce the risk of non-communicable diseases (NCDs) and alleviate micronutrient deficiencies(Reference Stephens, Troutman and Johnson20).
A narrative literature review was conducted to summarise current evidence on identified barriers to the consumption of FVs in LMICs and to examine how these countries have overcome these barriers by implementing strategies or interventions to increase the consumption of FVs. The article begins with a brief overview of the consumption patterns of FVs in high-income countries (HICs) and LMICs. The second part of this article then examines the temporal and geographical trends in the consumption of FVs in LMICs. Thirdly, barriers to intake of FVs in LMICs, where micronutrient malnutrition is on the rise, are presented. Finally, the review addresses strategies or interventions used to promote the consumption of FVs in LMICs, in addition to their policy, program and future research implications.
The consumption pattern of FVs in HICs and LMICs
An analysis of the global food supply between 1961 and 2013 revealed that diets in HICs had diversified, with a decrease in sugar supply, whereas diets in low-income countries (LICs) remained unchanged or had shifted towards poor dietary patterns(Reference Bentham, Singh and Danaei21). In comparison with HICs, LMICs rely more on staple foods (cereals, roots, tubers and plantains) and less on FVs and animal-source foods(22,23) . The major driving force behind the low intake of FVs in LMICs is the nutrition transition caused by economic growth, urbanisation and modernisation(Reference Subramanian, Kawachi and Smith24,Reference Misra and Khurana25) . A nutrition transition refers to a shift from traditional diets to Western-style diets that are energy dense and high in fat and sugar and provide adequate or excess calories but lack sufficient micronutrients required for linear growth(Reference Singh and Devi26).
Miller et al. (Reference Miller, Yusuf and Chow27) found that the average daily consumption of FVs was 2·14 servings (1·93–2·36) in LICs, 3·17 (2·99–3·35) in LMICs, 4·31 servings (4·09–4·53) in upper/middle-income countries (UMICs) and 5·42 servings in HICs. Less than half of adolescents in all 49 LMICs met the WHO guidelines for the intake of FVs(Reference Oduro, Buchner and Andrade28). Similarly, inadequate consumption of FVs has been reported in HICs such as the USA, UK, Canada, Europe and Australia(Reference Hall, Moore and Harper18,Reference Zapata, Bryant and McDermott29–Reference Zahra, Ford and Jodrell32) . According to Global School-based Student Health Survey (GSHS) data from five Southeast Asian countries (India, Indonesia, Myanmar, Sri Lanka and Thailand), 76 % of adolescents had inadequate consumption of FVs(Reference Peltzer and Pengpid33). However, a meta-analysis of GSHS studies conducted in Africa, Asia, Oceania and Latin America between 2008 and 2015 reported that the mean daily frequency of fruit consumption was highest in Africa but particularly low in South and East Asia. In 2011, consumption of less than the recommended daily intake of fruit and vegetables ranged from 18 % and 8 % in Algeria, to 62 % and 63 % in the Maldives in 2014, respectively. On the other hand, Health Behaviour in School-aged Children (HBSC) surveys in mostly HICs in North America and Europe showed that less-than-daily fruit intake ranged from 51 % in Denmark and French Belgium to 85 % in Greenland, whereas less-than-daily vegetable consumption ranged from 45 % in Flemish Belgium to 80 % in Estonia. However, compared with the HBSC analysis, the GSHS analysis revealed a higher frequency of intake of FVs in HICs. Another systematic review of the diets and eating habits of adolescent girls aged 10–19 years in LMICs found a higher prevalence of less-than-daily fruit (56 %) and vegetable (64 %) consumption than in the GSHS analysis(Reference Beal, Morris and Tumilowicz34). All these findings indicate that neither developing nor developed nations consume the WHO-recommended amount of FVs(Reference Shi, Lien and Kumar35).
To estimate the food intake in LMICs, different studies have employed various methods, including short interviews using self-administered questionnaires, dietary surveys and 24-h recall. However, the most commonly used method is to apply semi-quantitative food frequency questionnaires (FFQs)(Reference Hjartaker, Knudsen and Tretli36–Reference Harris, Eke and Chavarro43). Although in a few studies, problems of underestimation, overestimation and inadequacy for assessing dietary changes due to nutrition transition have been found when using these methods, many studies have found FFQs to be a relatively valid and reproducible tool to measure dietary intake, when used with calibration factors(Reference Jayawardena, Byrne and Soares44–Reference Malekahmadi, Naeini and Shab-Bidar49).
Temporal and geographical trends in the consumption of FVs in LMICs
Regional and seasonal variation in intake of FVs
Recommendations or food-based dietary guidelines (FBDGs) on intake of FVs vary substantially across different countries and regions based on their culture, food availability and accessibility, resulting in different consumption patterns(Reference Ma and Zheng50,Reference Kalmpourtzidou, Eilander and Talsma51) . Globally, significant regional variation was seen in the consumption patterns of FVs. In 2010, the mean global fruit intake in adults was 81·3 g/d, with the highest intakes mostly in UMICs and the lowest in LMICs. The mean global consumption of vegetables (including legumes) was 208·8 g/d, with the highest intakes in some LMICs and UMICs and the lowest intakes mostly in HICs and UMICs. Consumption of vegetables was significantly higher than that of fruits in Sub-Saharan Africa (SSA), Eastern Asia and Southern Asia. Similarly, in Caribbean nations (Jamaica, Antigua and Barbuda, Bahamas and Saint Lucia), Switzerland, the Philippines and Malaysia, fruit intake was significantly higher than vegetable consumption(Reference Micha, Khatibzadeh and Shi52). According to estimates from the Global Burden of Disease Study 2017, in SSA and Oceania, adults aged ≥25 years consume only about one-third of the recommended amounts of FVs. Despite having high incomes, people in North America and Western Europe consume only half of the recommended amounts of FVs, whereas those in low-income central Asia, North Africa and the Middle East consume higher quantities. Furthermore, a negative correlation was found in the consumption of FVs: as fruit intake increased, vegetable consumption decreased, and vice versa. Caribbean residents consume the most fruit, whilst southern Africans consume the least(53).
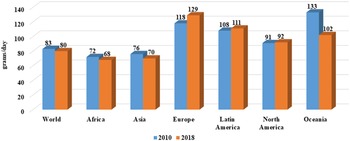
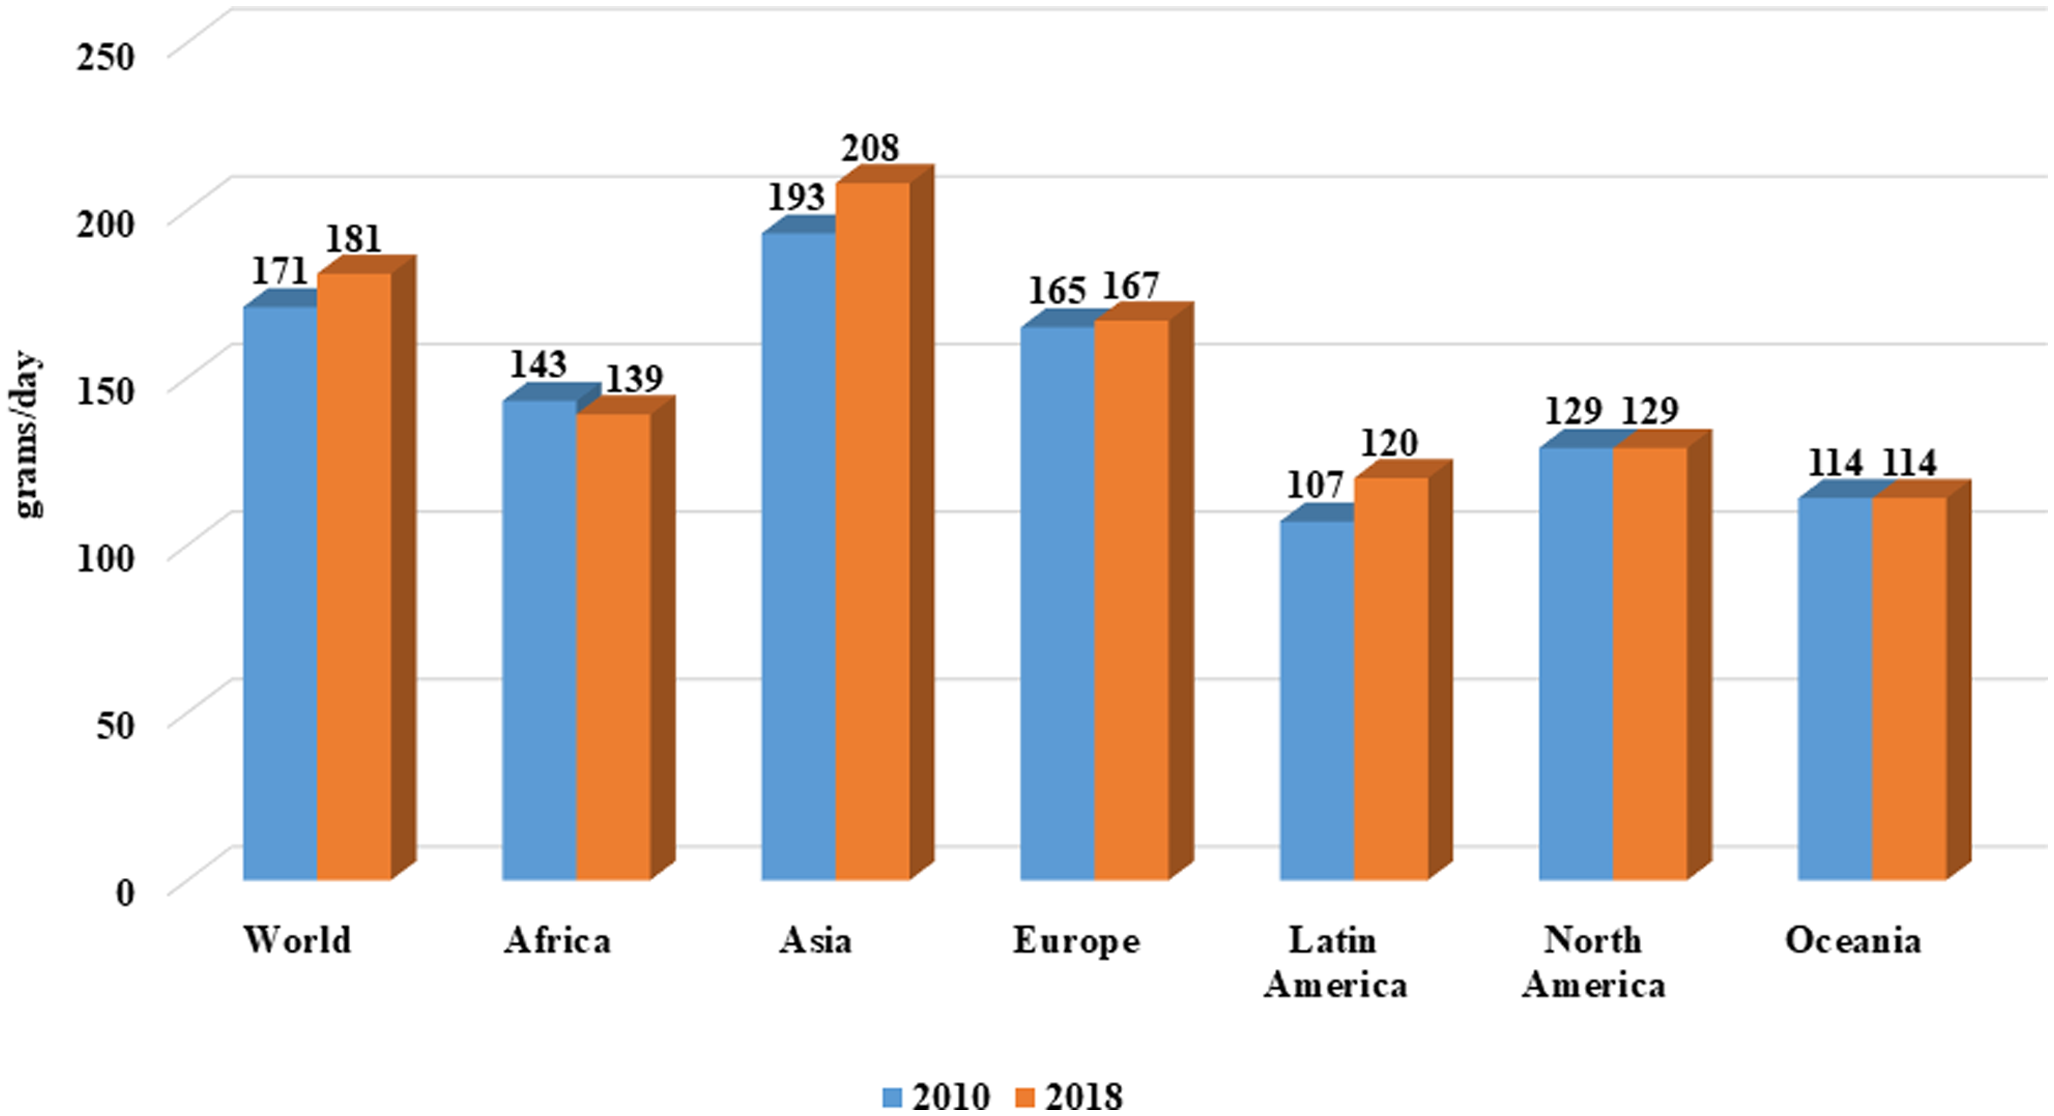
The global dietary database showed that, in 2018, mean global fruit intake was 80 g/d, with the highest intakes (129 g/d) in Europe, followed by Latin America (111 g/d), Oceania (102 g/d) and North America (92 g/d), and the lowest in Asia (70 g/d) and Africa (68 g/d), whereas mean vegetable consumption was 181 g/d globally, with the highest intakes in Asia (208 g/d), followed by Europe (167 g/d), Africa (139 g/d) and North America (129 g/d), and the lowest in Latin America (120 g/d) and Oceania (114 g/d)(54). From 2000 to 2019, average vegetable intake in Asia varied from 81 (South Asia) to 349 g/d (East Asia), whereas in Africa, it ranged from 98 (East Africa) to 135 (South Africa) g/d, in Europe from 123 (Eastern) to 270 (Western) g/d, in the Americas from 56 (Central America) to 156 (North America) g/d and in Oceania from 73 (Melanesia) to 196 (Polynesia) g/d, indicating wide regional heterogeneity in mean vegetable consumption, i.e., from the lowest in Central America to the highest in East Asia(Reference Kalmpourtzidou, Eilander and Talsma51). Furthermore, about 67 % of East Asian countries consumed the WHO-recommended amounts of vegetables, whereas in other Asian regions, this was achieved in only 9–29 % of countries. In Africa, only 7 % of countries met WHO recommendations for vegetable intake(Reference Kalmpourtzidou, Eilander and Talsma51). An analysis of dietary trends in Africa from 1990 to 2017 showed that the supply of FVs is gradually improving but remains below the minimum target of 400 g/person/d for all sub-regions and economic levels, with the exception of North Africa and LMICs(Reference Gebremedhin and Bekele55).
Numerous studies conducted across and within developing countries such as India(Reference Tak, Shankar and Kadiyala56–Reference Choudhury, Shankar and Aleksandrowicz58), China(Reference Ma and Zheng50,Reference Yang, Zhao and Lan59) , Nigeria(Reference Olabisi, Obekpa and Liverpool-Tasie60), SSA(Reference Mensah, Nunes and Bockarie61) and northern Vietnam(Reference Trinh, Linderhof and Vuong62) revealed regional disparity in dietary intake, with the intake of FVs being especially low in rural areas of LMICs(Reference Ma and Zheng50,Reference Kalmpourtzidou, Eilander and Talsma51) . In this context, a study reported that rural regions of India had lower per-capita consumption of vegetables and fruits (145 and 15 g) compared with urban regions (155 and 29 g), respectively(Reference Minocha, Thomas and Kurpad57). According to the European Food Safety Authority (EFSA)(63) and WHO(64), the mean fruit intake of adults in India, Malaysia, PR China, Ghana, Ethiopia and Uganda ranged from 115 to 464 g/d, with the lowest in Ethiopia and the highest in Uganda, whereas mean vegetable consumption varied from 24 to 263 g/d, with the lowest in Uganda and the highest in PR China. These regional variations in the intake of FVs could be attributed to: traditionally neglected local markets in rural and peri-urban areas; natural disasters such as famines, droughts and floods; fluctuating food prices(Reference Cooper, Shankar and Rich65,Reference Elzaki, Sisman and Al-Mahish66) ; harvesting season(Reference Minja, Swai and Mponzi67); seasonal availability of FVs; crop yields; inadequate post-harvest storage facilities; the supply of FVs; inefficient marketing structures; and variation in traditional diets. Therefore, region-specific programs and policies are needed to address these regional variations in the consumption trends of FVs(Reference Kalmpourtzidou, Eilander and Talsma51,Reference Tak, Shankar and Kadiyala56,Reference Yilma, Endris and Mengistu68–Reference Constantinides, Turner and Frongillo70) .
Changes in the food environment and food system, such as mono-crop cultivation, which resulted in an over-reliance on a few major crops, and the consumption of micronutrient-deficient monotonous diets with minimal amounts of FVs, have led to negative health implications in LMICs(Reference Nkonde, Audain and Kiwanuka-Lubinda71,72) . In some developing countries, culturally important traditional food regimes, mostly based on roots and tubers (RTs), are often inadequate in FVs(72). Traditional diets in rural Uganda were mainly dominated by cassava and plantain (staple foods), whereas intake of FVs was below WHO recommendations(Reference Holmager, Meyrowitsch and Bahendeka73). Similarly, in Tanzania, FVs were minimally consumed as compared with starchy meals such as maize and rice(Reference Gityamwi, Hart and Engel74). Growing evidence suggests that starchy staple-based monotonous diets, especially low in FVs, are being consumed in many regions of LMICs such as Vietnam(Reference Trinh, Linderhof and Vuong62), Ghana(Reference Gyimah, Annan and Apprey75), South Africa(Reference Mkhawani, Motadi and Mabapa76), Benin(Reference Lokossou, Tambe and Azandjeme77), Indonesia(Reference Mehraban and Ickowitz78), Nepal(Reference Shrestha, Paudel and Sunuwar79), Bangladesh(Reference Shamim, Mashreky and Ferdous80), Brazil(Reference Crepaldi, Okada and Rauber81) and India(Reference Pradhan, Raju and Nithya82), where seasonality and environmental threats to crop production appear to affect food availability and consumption patterns(Reference Tak, Shankar and Kadiyala56). A study amongst adults from southern Brazil showed that seasonal variation in food intake resulted in more consumption of high-energy heat-producing foods in winters and higher intake of FVs in summer and spring(Reference Rossato, Olinto and Henn83). In Nepal, the pre-rice harvesting period was found to influence maternal dietary intake of micronutrient-rich FVs(Reference Saville, Cortina-Borja and De Stavola84). Similarly, in southern Ethiopia, marked seasonal variations led to lower consumption of FVs in the pre-harvest season of March compared with the post-harvest season of September(Reference Belayneh, Loha and Lindtjørn69). In agreement with this, one study revealed that farm women from the Amoroni Mania region of Madagascar consumed FVs more frequently during the lean season than during the post-harvest season(Reference Ravaoarisoa, Rakotonirina and Randriamanantsaina85). A study measuring the seasonal gap in the prices of FVs in seven countries showed high levels of food price seasonality, especially in African food markets(23). Similarly, a study conducted in two rural South African villages found seasonal variation in the consumption of β-carotene-rich FVs such as yellow/orange-fleshed FVs and dark GLVs, in a community growing these crops at households due to limited availability in local shops, implying that home garden interventions promoting intake of FVs should also consider climatic and seasonal variations(Reference Faber and Laubscher86).
According to a national survey of food consumption patterns in Iranian households, the summer season has the highest intake of vegetables, followed by spring and winter, whereas regarding fruit consumption, more seasonal fluctuations were observed, with the highest intake in summer and the lowest in spring(Reference Toorang, Houshiarrad and Abdollahi87). Similarly, a study of pregnant and breastfeeding women, as well as children, from two farming districts in Malawi found that the cool, dry winter season (May to August) had a greater variety of foods available than the other seasons, owing mainly to the harvest period and own farm production. Vegetables were scarce during the hot dry season (September to October), whilst indigenous vegetables were abundant in the warm wet season (November to April). Regardless of fruit availability and seasonality, intake of fruits was much lower than that of vegetables(Reference Zimba, Mwangwela and Mtimuni88). Other evidence revealed that a variety of fruits were available year-round in both the Bagadale and Abaeja Regions of Nigeria. However, vegetables were most plentiful during the rainy season, when consumption was also higher than in the dry season. Seasonal fluctuation was more prevalent in the Bagadale than Abaeja Region(Reference Meldrum, Adeyemi and de Filipo89). In agreement with this, a seasonal assessment in two urban districts of Hanoi, Vietnam showed that, in both areas, many varieties of FVs were available year-round, except some fruits and leafy vegetables, which exhibited a rotating pattern of availability. People preferred to consume in-season FVs only, due to their low price, low pesticide use and better taste. Affordability and food safety concerns were the main barriers to eating some fruits(Reference Meldrum, Ngothiha and de Filipo90). According to the available evidence, factors influencing food security dimensions vary significantly by season and geographic location, thereby altering food consumption patterns and the nutritional status of the population (especially younger age groups), resulting in unfavourable consequences for food and nutrition security in LMICs(23,Reference Elzaki, Sisman and Al-Mahish66,Reference Shrestha, Paudel and Sunuwar79,Reference Rossato, Olinto and Henn83,Reference Nijhuis and Brouwer91–Reference Gilbert, Christiaensen and Kaminski93) .
Temporal trends in the consumption of FVs
The per-capita availability of foods from different food groups varies widely between nations of different income levels. Although the average availability of FVs has increased globally since 2000, only Asia (470 g/capita/d) and other UMICs (645 g/capita/d) have availability of FVs above WHO recommendations, whereas a marginal decline has been observed in HICs(23). At the global level, in 2019, the average availability of FVs (594 g/capita/d) surpassed the WHO recommended amount (400 g/capita/d) in all regions except Africa, with Asia having the highest levels, whilst Europe, Oceania and the Americas had similar levels. Between 2010 and 2019, the availability of FVs increased by 11 % worldwide, mainly driven by a 16 % increase in Asia. However, the actual consumption of FVs can vary and be less than their availability, particularly for certain population groups(94). In 2019, Oceania (293 g/capita/d) and the Americas (284 g/capita/d) had the highest availability of fruits, followed by Asia (253 g/capita/d), Europe (231 g/capita/d) and Africa (198 g/capita/d). Regarding vegetables, Asia had the highest availability (449 g/capita/d), significantly outpacing Europe, which was the only other region with a level more than 250 g/capita/d. Asia and Europe were also the regions where the availability of vegetables was higher than that of fruits(94). Even if the per-capita availability appears to exceed the recommended levels at the population level, there is no guarantee that consumption is distributed equally or in a manner that meets the needs of all individuals across all regions(23,Reference Mason-D’Croz, Bogard and Sulser95) . This regional disparity in the availability of FVs is likely to persist, with many regions failing to achieve it(96).
According to the National Sample Survey Organisation (NSSO), FVs account for only 9 % of the total calorie intake in cereal-based Indian diets(97). Between 1972–73 and 2011–12, expenditure on fruits remarkably increased, reflecting a significant shift in both urban and rural consumption patterns(98). However, the average (268 g) daily intake of FVs did not meet the WHO recommendations(Reference Mensah, Nunes and Bockarie61). Although Indian diets have diversified slowly since the 1990s, with rural diets becoming more diverse than urban diets by 2011–12, the average intake of FVs was below WHO recommendations. However, there has been a marginal increase in intake of fruits, whereas consumption of vegetables has declined(Reference Tak, Shankar and Kadiyala56). The China Health and Nutrition Survey, conducted from 2006 to 2015, revealed a decrease in preferences for FVs, as well as an increase in fast-food preferences(Reference Li, Bai and Zhang99). Conversely, in SSA, vegetable consumption has risen sharply (from 10 to 110 g), particularly in rural areas, over the last three decades(Reference Mensah, Nunes and Bockarie61). In Brazil too, a temporal increase in the consumption of FVs has been observed from 2008 to 2019(Reference Crepaldi, Okada and Rauber81,100) . Similarly, in Bangladesh, there was a significant increase in the apparent intakes of fruits (by 20·4 % per year) and vegetables (by 69 %) from 1961 to 2013, although the amounts were grossly inadequate(Reference Al Hasan, Saulam and Kanda101).
A global database on average per-person dietary intakes revealed that, between 2010 and 2018, consumption of FVs increased by only 2 % globally(Reference Al Hasan, Saulam and Kanda101), with the lowest intakes in LICs, whereas HICs consume the most unhealthy and environmentally damaging foods, such as red meat, processed meats and dairy. HICs and UMICs reported both positive and negative dietary changes related to FVs(23). The average intake of FVs per person increased in Europe (+5 %), Asia (+4 %), Latin America and the Caribbean (+8 %), whilst it decreased in Africa (−4 %) and Oceania (−13 %), and remained constant in North America (Figs. 1 and 2)(54). Moreover, in LMICs also, urban settings and higher socio-economic status (SES) have been found to be associated with healthy and unhealthy dietary patterns, including higher intakes of both FVs and highly processed foods(23). Although regional disparity in the consumption of FVs was quite evident, none of the regions met the EAT-Lancet recommendations for planetary health (nutritionally healthy and environmentally sustainable) diets, i.e., at least five servings of FVs (500 g) per day, which includes 300 (200–600) g of vegetables, excluding potatoes, and 200 (100–300) g of fruits per day(54). In 2018, the intake of FVs in Africa was 59 % below the recommended levels, whereas it was 41 % and 56 % below the recommendations in Europe and North America, respectively. Globally, consumption of FVs is 60 % and 40 % below the EAT-Lancet recommendations, respectively (Table 1)(54).
Region-wise average fruit intake (grams per person per day).

Region-wise average vegetable intake (grams per person per day).

Percentage deviation by year and region from minimum recommendations of the EAT-Lancet commission

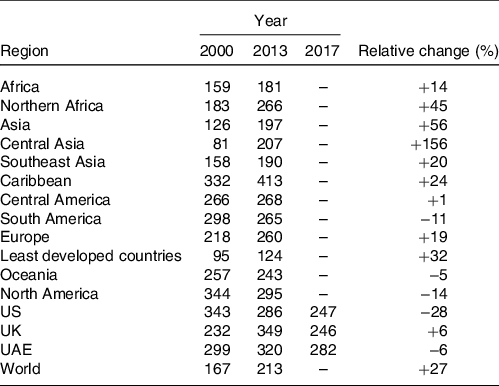
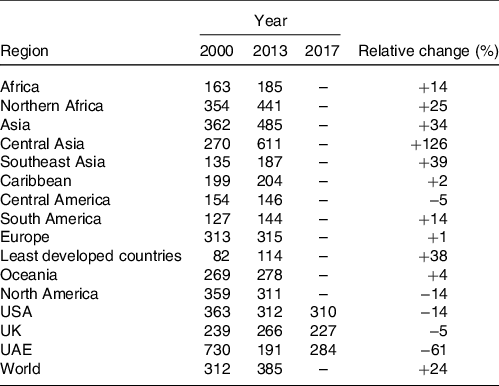
Global assessments of food consumption and dietary quality present many challenges. Although recent food and nutrition surveys have been conducted globally, they have certain theoretical and practical limitations. For example, FAO’s food balance sheets (FBSs) provide data on per-capita food available for consumption (Table 2 and 3)(102) rather than actual consumption by the population, which invariably overestimates food intake. Moreover, they do not provide information on regional, socioeconomic, ecological, seasonal and geographical differences in food intake(102). The World Health Survey of the WHO has not been conducted since 2002–04. The World Bank’s Living Standards Measurement Study calculates food expenditure only of limited food items at the household rather than individual level. Moreover, individual-level nutrition surveys are particularly difficult to conduct in developing countries owing to a lack of the required experience and expertise. Additionally, national-level nutrition surveys, being time and resource intensive, are generally not conducted on a regular basis in LMICs, limiting the availability of up-to-date data on the intake of FVs. Consequently, the limited number of studies conducted worldwide leads to over- or under-representation of certain countries and regions(23). Even if data on dietary intake are available, international comparisons and interpretations of food consumption are difficult because different methodologies are used for such estimations(Reference Nijhuis and Brouwer91). Most studies have used unstandardised FFQs and were often conducted in urban or rural settings. To date, no single composite index has been validated to measure the multiple parameters of diet quality across all countries(23).
Average per-capita fruit supply per person (g/d) *

* Average per-capita supply of fruits, which does not correct for waste at the household level
Average per-capita vegetable supply per person (g/d) *

* Average per-capita supply of vegetables, which does not correct for waste at the household level
To facilitate the assessment of high-quality food consumption and nutrient intake data in LMICs, Tufts University, the FAO, the International Food Policy Research Institute (IFPRI) and other international experts developed the INDDEX24 as part of the International Dietary Data Expansion (INDDEX) project(103). Another response to this problem is the FAO/WHO Global Individual Food consumption data Tool (GIFT) platform, which aims to strengthen nutrition information systems by establishing a publicly available, multipurpose global database compiled from existing data collected within individual food consumption surveys conducted at a national or sub-national level(103). It is essential to understand that behaviour change is paramount to achieving the recommended levels of FVs, as low consumption continues even where FVs are readily available(Reference Mason-D’Croz, Bogard and Sulser95). At the country level, actions are needed to increase the production and consumption of FVs and make them more affordable to consumers whilst also providing social, environmental and economic benefits in accordance with the Sustainable Development Goals(96).
Barriers to consumption of FVs in LMICs
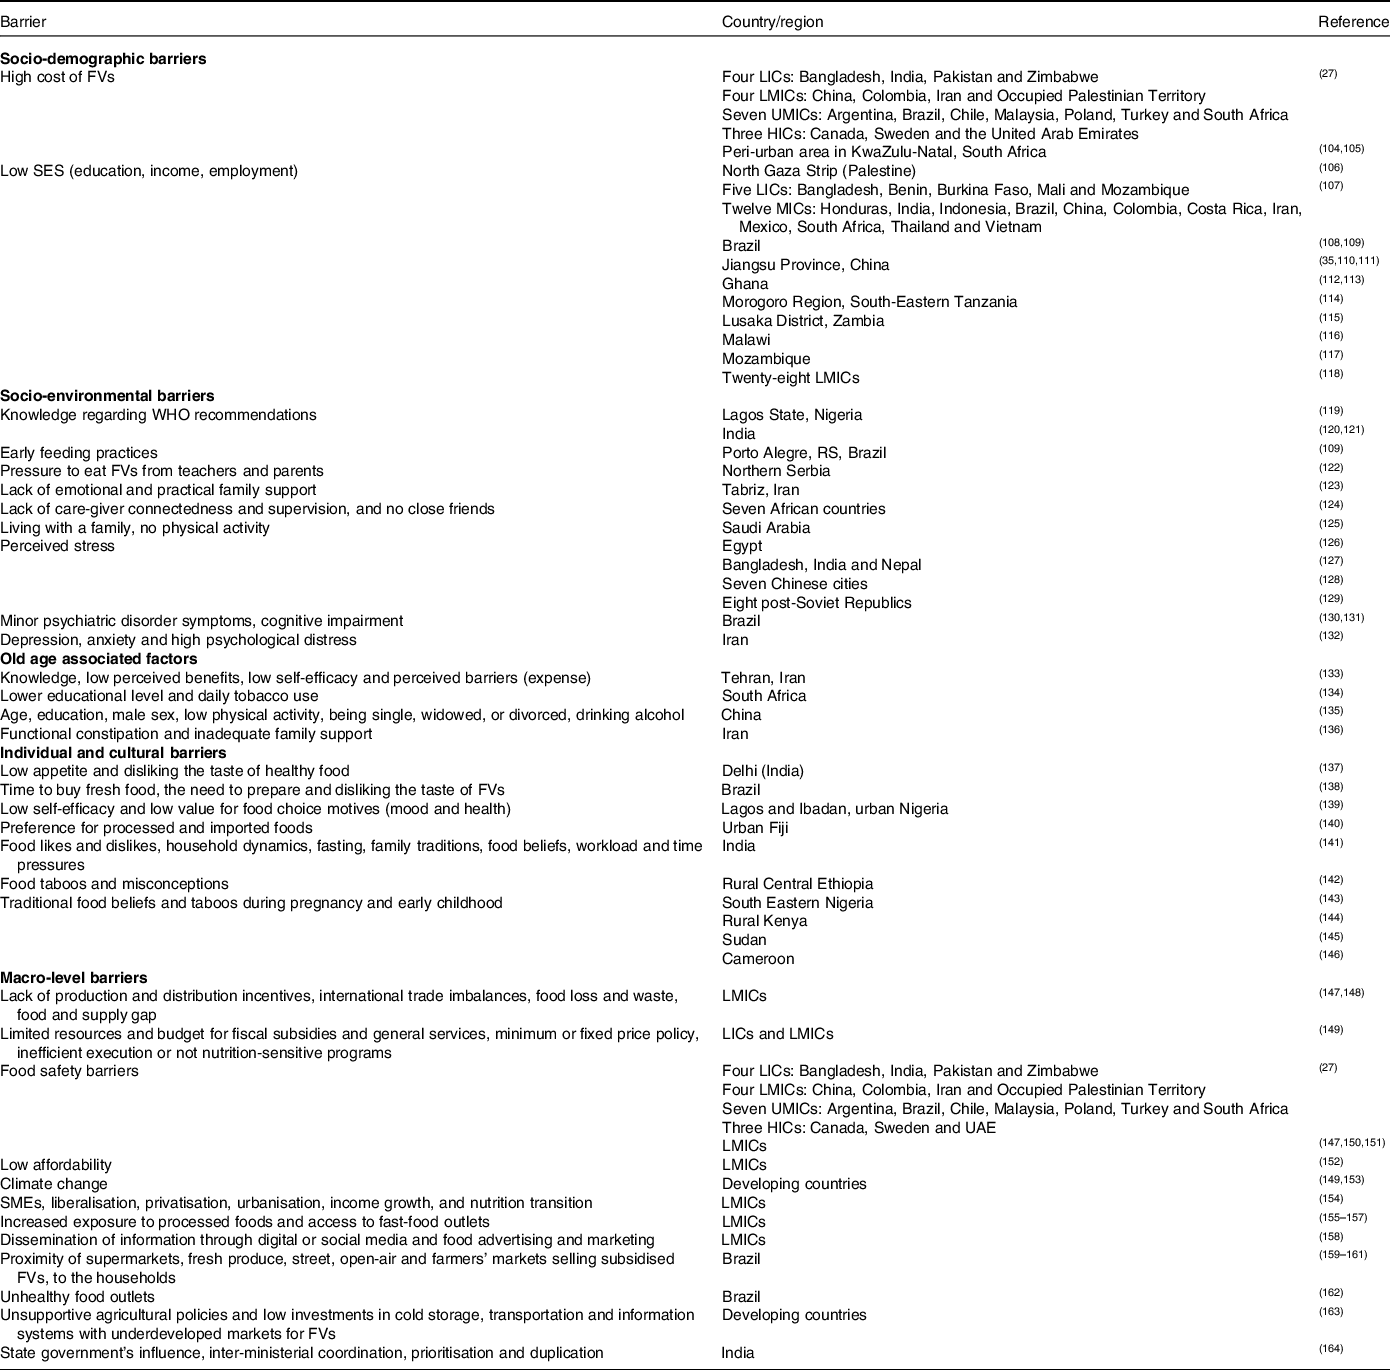
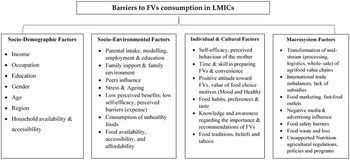
Food habits are shaped by social, demographic, environmental, individual, cultural and macro-system factors. Socio-demographic factors such as income, occupation, education, gender, region, age, household availability and accessibility; socio-environmental factors such as parental intake and modelling, family support, family meals, peer influence, unwillingness of male partners and children to eat FVs, inadequate storage space, competition from unhealthy foods, stress and ageing; individual and cultural factors including self-efficacy, skill in preparing FVs, medical prescriptions, disruptions to routine, travel/holidays, bargains being too heavy to carry, convenience, unhealthy eating habits, taste, knowledge and awareness regarding the importance and recommendations of FVs, food preferences, traditions, beliefs and taboos; macrosystem factors including food marketing, media and advertising influence, food safety, food system, i.e., production, processing and distribution, nutrition-agricultural regulations, policies and programs, were identified to have significant effects on the intake of FVs in LMICs (Table 4)(Reference Peltzer and Pengpid33,Reference Ha, Shakur and Pham Do165–Reference John and Ziebland177) .
Summary of studies on barriers to consumption of FVs in LMICs

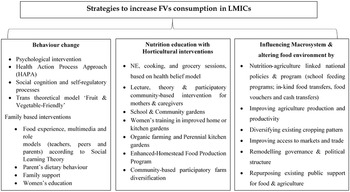
A systematic mapping review of literature published from 1979 to 2019 on factors influencing the dietary behaviours of adolescents and adults in urban food environments of fifteen African countries (over half being conducted in Ghana, Morocco and South Africa) identified seventy-seven factors investigated mostly at the individual and household level (forty-five of seventy-seven), including lifestyle/behaviours (fifteen), followed by cognition (twelve), biological (nine), and demographic factors (nine). The least studied factors were at the social level (eleven), such as family influence (nine) and friends/peers (two); and at the physical level (twelve), which included neighbourhoods (seven), homes (four) and school environment (one). Food marketing and media environment (three) and the food and beverage industry (four) were the most reported macro-level factors (nine), whilst societal and cultural norms (two) were the least studied(Reference Osei-Kwasi, Mohindra and Booth178). Therefore, identifying the factors affecting the consumption behaviour of FVs (Fig. 3) and designing efficient strategies or interventions to promote the intake of FVs in LMICs is essential (Fig. 4).
Barriers to consumption of FVs in LMICs.

Strategies to increase consumption of FVs in LMICs.

Socio-demographic barriers
Although food intake is the major determinant of nutritional status, it also varies considerably with SES. Perceived barriers to the intake of FVs increase with decreasing SES in terms of income and education. In South Africa, cost was found to be the major constraint on the purchasing and consumption of FVs in food-insecure households(Reference Faber, Laubscher and Laurie104,Reference Faber, Wenhold and Laurie105) . A cross-sectional study conducted amongst Palestinian school adolescents in the north Gaza Strip found that adolescents from low SES had lower intake of FVs than those from higher SES(Reference Abudayya, Stigum and Shi106). Due to the increased costs of FVs relative to household income, about 57 % of individuals in LICs were not able to afford the WHO-recommended servings of FVs per day. Furthermore, households in LICs and LMICs spend roughly half of their income on food, with households in some countries (such as the Occupied Palestinian Territory, Bangladesh, Pakistan and Zimbabwe) spending about two-thirds of their income on food. Unaffordability might be a large barrier to achieving WHO recommendations for FVs(Reference Miller, Yusuf and Chow27).
According to the EFSA(63) and WHO(64), the average intake of FVs is not positively linked to the status of the country. Some developing countries, such as Uganda and PR China, had higher consumption of FVs than developed countries. In LMICs, high SES or living in urban areas was associated with both healthy and unhealthy dietary patterns, i.e. higher intakes of FVs, as well as total fat, cholesterol and saturated fat, and lower intakes of carbohydrates and fibre(Reference Mayen, Vidal and Paccaud107). In LMICs, the prevalence of low consumption of FVs tended to increase with age and decrease with income. In eleven countries, a significant urban–rural disparity in terms of intake of FVs was also observed(Reference Stephens, Troutman and Johnson20). SES and urban location influenced food preferences, such as a higher intake of fast foods and a lower intake of FVs(Reference Shi, Lien and Kumar35). In contrast, a study conducted amongst Brazilians revealed an association of SES, physical exercise and low consumption of fast food with regular intake of FVs(Reference Ramalho, Dalamaria and Souza108). Similar findings have been reported in studies from China(Reference Li, Jiang and Zhang110,Reference Ren, Liu and Cao111) and Ghana(Reference Amo-Adjei and Kumi-Kyereme112). Therefore, socio-economic disparities in dietary intake should be considered to prevent and alleviate chronic diseases in LMICs(Reference Mayen, Vidal and Paccaud107).
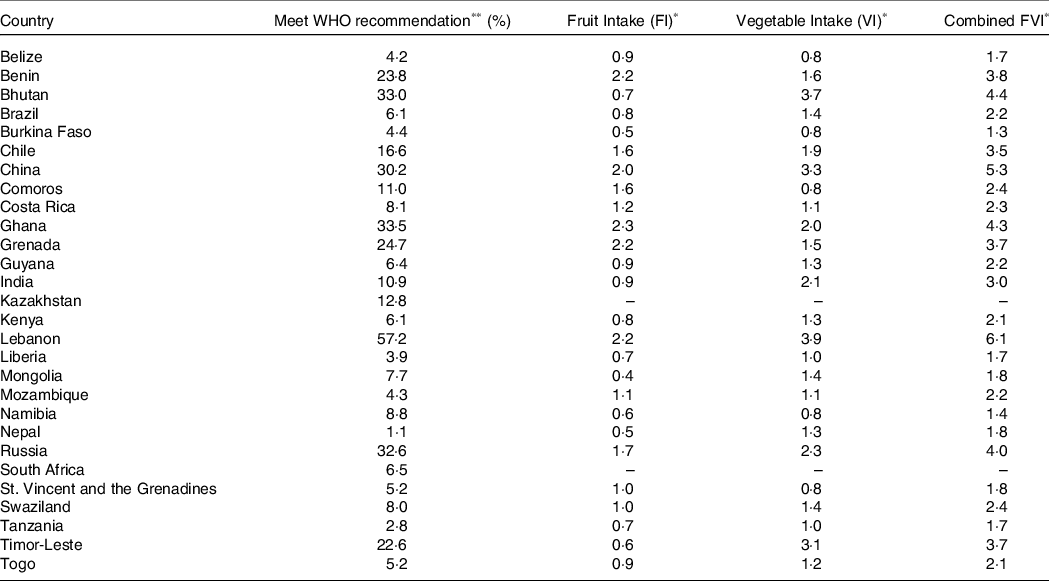
In south-eastern Tanzania, Msambichaka et al. (Reference Msambichaka, Eze and Abdul114) found that those with a higher education were more likely to consume fruits daily. Independent correlates of inadequate intake of FVs included young age, being male, low education, low-income occupations and low alcohol, high tobacco and low healthcare utilisation, in agreement with studies from Zambia(115) and Malawi(Reference Msyamboza, Ngwira and Dzowela116). Public health interventions should target socio-economically deprived and culturally rooted preferences whilst prioritising vegetable promotion for the most immediate increase in total intake of FVs. In Mozambique, Padrao et al.(Reference Padrao, Laszczynska and Silva-Matos117) reported that educational levels (≥6 years v. <1 year) increased fruit consumption (≥2 servings/d) in urban areas, whereas more educated urban men and affluent rural women consumed vegetables (≥2 servings/d) less frequently. Similarly, data collected from individuals aged ≥15 years in twenty-eight LMICs (Table 5) revealed that those with secondary education or higher were more likely to achieve the WHO recommendation for FVs than those with no formal education(Reference Frank, Webster and McKenzie118). These findings indicate the need for FV promotion programs that target the whole population, despite different socio-demographic determinants of the intake of FVs.
Mean daily intake of FVs (servings/d) amongst individuals aged ≥15 years in twenty-eight LMICs

* Values are means. Servings estimated assuming 80 g is equivalent to one serving.
** Values are percentages. Participants were classified as meeting the WHO recommendation if they self-reported eating ≥400 g of combined fruits and vegetables per day.
Mothers play a major role in the planning and preparation of family meals. Studies indicate a mother’s educational status as a potential determinant of the intake of FVs amongst children(Reference Hong and Piaseu169,Reference Rakhshanderou, Ramezankhani and Mehrabi172) . A study amongst Ghanaian adolescents revealed that tertiary and primary maternal education, mothers’ low employment grade, and high or medium school performance increased the probability of frequent intake of FVs(Reference Doku, Koivusilta and Raisamo113), which may be attributable to better knowledge regarding healthy and nutritious foods amongst mothers with higher education and SES(Reference Abudayya, Stigum and Shi106). Similarly, a significant increase in the consumption of FVs was noted with a father’s educational level (p = 0·04) in a study amongst adolescent girls from the north Gaza Strip (Palestine)(Reference Abudayya, Stigum and Shi106). Education, therefore, is definitely one of the socio-economic factors, which on women’s empowerment will be fully expressed and whose impact can be evidenced in the good health and nutritional status of the future generation(Reference Kulsum, Lakshmi and Prakash179).
Socio-environmental barriers
Parental education, employment, perceived eating behaviour, encouragement, supervision(Reference Valmorbidaa and Vitolo109,Reference Silva, Ayankogbe and Odugbemi119,Reference Sumonja and Novakovic122,Reference Lotrean and Tutui180,Reference Rasmussen, Krolner and Klepp181) and emotional and practical family support(Reference Shokrvash, Majlessi and Montazer123) have been shown to be positively associated with consumption of FVs by children and adolescents. A study of school children in seven African countries found that their family environment, including a lack of care-giver connectedness and supervision and the absence of close friends, were associated with insufficient consumption of FVs(Reference Peltzer and Pengpid124). In addition, staying with the family, self-planning a menu daily and realisation of fitness and regular exercise were found to significantly influence moderate or high consumption of FVs amongst university students(Reference Alsunni and Badar125). A survey across Indian households identified socio-environmental factors such as lifestyle, seasonal availability of FVs and high prices as crucial barriers affecting the intake of FVs. About 89 % of respondents were unaware of the WHO recommendations, and half of those who were aware had a post-graduate degree or higher(Reference Mukherjee, Dutta and Goyal120). In South Delhi (India), Finzer et al. (Reference Finzer, Ajay and Ali121) identified money, time and affordability as the main barriers to consuming more FVs, implying that affordability plays a greater role than physical accessibility in purchasing FVs. These findings emphasise the importance of targeting the family environment to develop interventions based on social cognitive theory, which involves a complex interplay of an individual’s cognition, environment and behaviour and thereby promotes the consumption of FVs amongst children, adolescents and parents(Reference Najimi and Ghaffari182).
Psychological stress is associated with food consumption, affecting people in both developing and industrialised nations similarly(Reference Sims, Gordon and Garcia183). Consumption of micronutrient-rich FVs has been associated with improved mental health, greater happiness, higher positive mood, reduced depressive symptoms, life satisfaction and flourishing(Reference Brookie, Best and Conner184–Reference Gopinath, Flood and Burlutksy187). The relationship between perceived stress and unhealthy dietary choices, such as eating high-fat foods and few FVs, has been demonstrated by previous studies(Reference Ansari and Beckhoff126,Reference Errisuriza, Pascha and Perry188) . In Brazil, Rower et al. (Reference Rower, Olinto and Goncalves130) found that adults without nervousness or stress were twice as likely to report adequate consumption of FVs than those who were stressed. Moreover, adults without minor psychiatric disorder symptoms were 52 % more likely to consume adequate FVs than those with symptoms. Similarly, a significant decrease in the prevalence of cognitive impairment has been reported in those low-income elderly Brazilians who met WHO recommendations for FVs(Reference Pastor-Valero, Furlan-Viebig and Menezes131). An inverse association between high intake of FVs with depression, anxiety and psychological distress was also found in Iranian women(Reference Saghafian, Malmir and Saneei132). Similar findings have been observed in three South Asian countries (Bangladesh, India and Nepal)(Reference Bishwajit, O’Leary and Ghosh127), seven Chinese cities(Reference Liu, Xie and Chou128) and eight post-Soviet Republics(Reference Hinote, Cockerham and Abbott129). These findings have public health implications and suggest that programs promoting the consumption of FVs should also focus on improving quality of life, managing stress and maintaining a healthy lifestyle(Reference Gehlich, Beller and Lange-Asschenfeldt189).
The elderly population is more susceptible to nutritional deficiencies owing to additional health, social and environmental barriers that affect their dietary intake, resulting in an increase in chronic degenerative diseases in this population group, which has a profound impact on health-care resources, workforce development and a range of public health planning and policy issues(Reference Shrimpton and Rokx190). In elderly Iranians, although age, income, marital status and education appeared to influence the consumption of FVs, these factors were not significant predictors of consumption of FVs. However, low perceived benefits, low self-efficacy, perceived barriers (expense) and family support were significantly associated with the intake of FVs(Reference Salehi, Eftekhar and Mohammad133). Other barriers to the consumption of FVs identified in older adults were daily tobacco use(Reference Peltzer and Mafuya134); male gender, low physical activity, being single, widowed, or divorced and drinking alcohol(Reference Li, Li and Ma135); chronic illness(Reference Phan, Paterson and Bucknall191); functional constipation, FV prices and inadequate family support(Reference Soltani, Torabi and Hasanzadeh136). These findings support the rationale for multi-component interventions targeting the elderly and suggest that gender-specific sub-populations and low SES should be considered for a greater impact.
Individual and cultural barriers
There is evidence that, owing to differentiation of lifestyle factors as a result of developmental, social and environmental changes, the dietary quality of children begins to decline as they approach adolescence, with personal food preferences taking dominance over previously learned eating habits as they start taking control of what, where and how much to eat(Reference Soyer, Ergin and Gursoy192). According to one study, knowledge regarding the WHO recommendations, higher self-efficacy, preference and perceived behaviour of the mother were positively associated with higher intake of FVs amongst children(Reference Lotrean and Tutui180). Other major barriers to healthy eating reported amongst low-income school-going adolescent girls from Delhi (India) were “not feeling hungry” and “disliking the taste of healthy foods”(Reference Rastogi, Mathur and Khanna137). In Brazilian adults also, perceived barriers to consumption of FVs were the time required to buy fresh food, the need to prepare it and not liking the taste of FVs(Reference Santos, Silva and Carvalho138). Furthermore, perceived benefits also emerged as the strongest predictor of continued consumption of FVs in elderly rural Iranians(Reference Jafari, Angali and Mohamadian193).
In urban Nigeria, women with higher knowledge of vegetable consumption and higher self-efficacy, and those who valued the food choice motives (mood and health) more, had higher consumption of vegetables(Reference Raaijmakers, Snoek and Maziya-Dixon139). Supporting this, urban Fijians also indicated that they enjoyed and valued eating FVs, were aware of the health benefits and had confidence in their cooking skills, whereas barriers cited were increasing preferences for processed and imported foods, and inconsistent availability and affordability of high-quality, low-priced, fresh produce(Reference Morgan, Vatucawaqa and Snowdon140). Despite awareness of the health benefits of FVs, a study conducted amongst rural Indian women revealed that the consumption of FVs was affected by several potentially modifiable factors such as food preferences, household dynamics, cultural norms, fasting, family traditions, food beliefs, workload, time pressures, environmental factors and cost(Reference Kehoe, Dhurde and Bhaise141). In agreement with this, a study amongst pregnant women from rural central Ethiopia, reported several food taboos and misconceptions that limit the consumption of FVs. Older, illiterate mothers in rural villages were more likely to practise such taboos than younger, educated ones(Reference Zerfu, Umeta and Baye142). Similar food beliefs and practices have been documented in south-eastern Nigeria(Reference Ekwochi, Osuorah and Ndu143), rural Kenya(Reference Riang’a, Broerse and Nangulu144), Sudan(Reference Kheiri, Kunna and Mustafa145) and Cameroon(Reference Kamga, Kouame and Akyeampong146). Culture, religion and traditional knowledge can influence food availability, accessibility and utilisation, indicating that nutrition-sensitive programs and policies should be designed considering food beliefs and taboos dependent on socio-cultural domains(Reference Alonso194).
Macrosystem barriers
Agriculture is a broad-based source of food, income and livelihoods for up to 70–80 % of the poor in developing countries(Reference Braun195–Reference Wenhold and Van197); however, more than 80 % of individuals aged ≥15 years in about twenty-eight LMICs had lower consumption of FVs than WHO recommendations(Reference Frank, Webster and McKenzie118). Moreover, in recent years, food and agricultural systems have transformed enormously, creating a barrier to adequate consumption of FVs in terms of food availability, accessibility and affordability(Reference Siegel147,Reference Trijsburg, Talsma and de Vries155,Reference Duran, de Almeida and Latorre159) . Global data on agricultural production and population size estimate about a 22 % supply gap in meeting current needs for FVs, varying from 58 % to 13 % across low- and upper/middle-income countries, respectively. Furthermore, these gaps between high/middle-income and LICs are projected to widen with time, especially in LICs, without an increase in the production of FVs(Reference Siegel, Ali and Srinivasiah148). Hence, to achieve food and nutrition security in LMICs, considerable attention should be given to the agriculture sector(Reference Braun195–Reference Wenhold and Van197).
Support for food and agriculture policy varies by country, income level and time period. Price incentives and fiscal subsidies are widely used in HICs whilst also becoming more common in UMICs. On the other hand, due to limited resources and budgets for fiscal subsidies and general services, LICs have implemented policies that generated price disincentives for farmers to facilitate consumers’ access to food at a lower price(149). In LMICs, governments often procure food directly from farmers at administered prices for public food stockpiling, social protection programs and institutional meals. However, these countries often fail to achieve program objectives due to inefficient execution (subsidies not reaching the intended beneficiaries or not being accompanied by extension services) and (when subsidies had suboptimal funding) encouraged monocultures or were not nutrition sensitive. Moreover, national food security policies in LMICs are designed to ensure food availability, particularly for staple cereals (e.g. maize, wheat and rice). In addition, market price controls, such as minimum- or fixed-price policies on these commodities, could lead to the consumption of low-cost, energy-dense foods with minimum nutritional value. Even on a global scale, rice, sugar and meat are the most incentivised foods, whereas FVs are unsubsidised or less subsidised. Due to the increased availability and lower prices of staple foods, FVs are becoming relatively more expensive to consume in many countries(149).
Major obstacles to the availability of FVs in LMICs include international trade imbalances, lack of subsidies on production and distribution systems, food loss and waste, and food safety barriers such as lack of awareness amongst consumers, limited ability to pay for food safety, lack of incentives to invest in food safety along the food supply chain and an inefficient public sector responsible for regulatory enforcement(Reference Miller, Yusuf and Chow27,Reference Siegel147,Reference Grace150,Reference Hoffmanna, Moser and Saak151) . Low affordability due to the high cost of FVs relative to household income was also cited as the main reason for the relatively lower consumption of FVs in LMICs(Reference Mayen, de Mestral and Zamora152). The price of FVs is more dependent on local productivity and value chains, as they are more perishable, more resource intensive and less tradable compared with other food products(Reference Headey198,Reference Willett, Rockstrom and Loken199) . Although many countries import FVs for domestic consumption, food and agriculture trade also results in greater availability of energy-dense and highly processed foods. Similarly, whilst food trade is important for stabilising markets and reallocating food from surplus to deficit regions, production for export can become a major source of global greenhouse gas (GHG) emissions, pollution, unsustainable freshwater withdrawals, biodiversity loss and deforestation(149). Therefore, climate change is also likely to contribute to lower yields, higher food prices and decreased availability of FVs, particularly in LICs(Reference Springmann, Mason-D’Croz and Robinson153).
Over the past several decades, an influx of foreign companies, as well as the proliferation of and investment by small and medium enterprises (SMEs), liberalisation, privatisation, urbanisation, income growth and nutrition transition in developing countries, have resulted in a rapid transformation of the mid-stream (processing, logistics and wholesale) of agrifood value chains, particularly in Asian countries, affecting food availability, affordability and accessibility(Reference Reardon154). Modernised value chains and food systems in which transnational food companies have high penetration, with increased exposure to processed foods and access to fast-food outlets, are likely contributors to the low intake of FVs in LMICs(Reference Trijsburg, Talsma and de Vries155–Reference Stuckler, McKee and Ebrahim157). Rapid dietary transitions, especially amongst the rural youth in LMICs, are attributed to globalisation influences such as the dissemination of information through digital or social media and food advertising and marketing strategies(Reference Kadiyala, Aurino and Cirillo158).
In Brazil, fewer supermarkets and fresh-produce markets in close proximity to low-income communities were associated with significantly lower consumption of FVs(Reference Duran, de Almeida and Latorre159), whereas the presence of a street market closest to the households was associated with higher intake of FVs(Reference Nogueira, Fontanelli and de Aguiar160). Meanwhile, it has been shown that the concentration of open-air markets and public farmers’ markets selling subsidised FVs was in the richest region of the Brazilian metropolis city, limiting access for those living on the city’s outskirts(Reference Lopes, de Menezes and de Araujo161). Another study from Brazil reported that higher income and higher density of healthy food outlets led to higher scores for the intake of FVs, whilst a negative association was found between unhealthy food outlets and scores for the intake of FVs(Reference Pessoa, Mendes and Gomes162). These findings demonstrate the need to strengthen food environment research and target broader food environments, because at present, there is limited evidence on the local food environment or the factors influencing healthy food intake, and the few such intervention studies that exist primarily address childhood obesity through policies focusing on healthy food environments(Reference Francis, Nichols and Dalrymple200–203).
Furthermore, agricultural policies in developing countries are not responsive and supportive to the changing demands placed on food systems, mainly to the process of diversification away from staple grains and towards FVs. Traditional markets for non-staples at local, regional and national levels are underdeveloped, with very low investments in cold storage, transportation and information systems that determine the functioning of the marketing of FVs(Reference McKee, Lilliston and Ranallo163). In this context, it has been revealed that the influence and discretionary power of the state government in India played an important role in determining the focus of each policy. Although the government’s focus on the supply policy for FVs has increased, inter-ministerial coordination, prioritisation and duplication have been identified as the major obstacles(Reference Khandelwal, Verma and Shaikh164). In sum, FVs have received little attention in terms of policy, finance, research and extension, and agribusiness assistance. Hence, to incorporate sustainable practices in production, harvesting, post-harvest handling, processing and consumption, stronger linkages between various actors and stakeholders across the system are required to develop effective nutrition-centred agriculture policies and programs in LMICs(204).
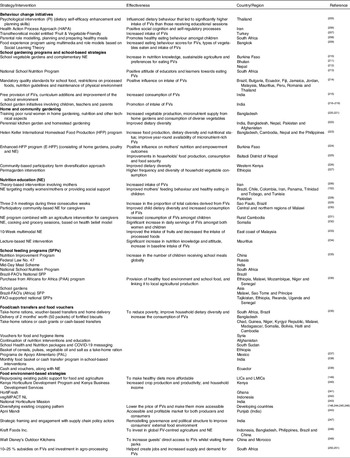
Strategies to increase consumption of FVs in LMICs (Table 6)
The majority of studies examining the effects of interventions/strategies to enhance the availability of FVs and the nutritional environment have been conducted in HICs, where interventions were either policy based at the regional or state level, or school and community-based educational modules and a garden intervention(Reference Ganann, Lewis and Ciliska252). However, in LMICs, not much progress has been made in developing policies to increase the consumption of FVs. More than half (57 %) of forty-nine LMICs had strategies/policies to increase the intake of FVs, mostly targeting schools, communities, the general public, environment, economy, mass media and WHO recommendations. Of the twenty-eight countries (57 %) with policies regarding FVs, 18 % had formulated policies that met the WHO recommendations for FVs(Reference Oduro, Andrade and Toussaint253). Lachat et al. (Reference Lachat, Otchere and Roberfroid254) reviewed the availability of policies in 83 % (116/140) of the LMICs. NCD strategies were found in 47 % of the LMICs, but only a minority proposed actions to promote healthier diets and physical activity. Strategies targeting the private sector were less frequently encountered than strategies targeting the general public or policymakers. Miller et al. (Reference Miller, Yusuf and Chow27) highlighted the need for strategies and policies that take into account the affordability and availability of FVs in order to improve the dietary quality of populations in LMICs.
Summary of studies on strategies/interventions to increase consumption of FVs in LMICs

Behaviour change strategies/interventions
Information on the effectiveness of behavioural interventions to increase the intake of FVs in LMICs is scarce(Reference Cobiac, Vos and Veerman255). Ziaei et al. (Reference Ziaei, Shahi and Dastgiri256) suggested a need for strategies and interventions targeting behavioural or personal factors for enhancing the consumption of FVs. A study on dietary behaviours in undergraduate students revealed that students receiving psychological intervention (PI) (dietary self-efficacy enhancement and planning skills) had significantly higher consumption of FVs than those receiving health education sessions (control)(Reference Kreausukon, Gellert and Lippke205). In Iran, an intervention based on the Health Action Process Approach (HAPA) increased consumption of FVs amongst adolescents and promoted more positive social cognitions and self-regulatory processes(Reference Lin, Scheerman and Yaseri206). Although action planning is a proximal predictor of intake of FVs, it is less likely to translate intentions into consumption of FVs if perceived dietary self-efficacy is low(Reference Zhou, Gan and Hamilton257,Reference Richert, Reuter and Wiedemann258) . A study based on a transtheoretical model entitled “Fruit & Vegetable-Friendly” was found to be effective in increasing the daily consumption of FVs amongst adolescents(Reference Gur, Erol and Kadioglu207).
Parental role modelling, planning and preparing healthy meals, and other environmental factors that determine the availability and accessibility of food and the dietary practices of mothers are identified as important variables affecting the consumption behaviour of FVs in school-aged children, indicating the need for family-based interventions(Reference Naidoo, Nyembezi and Thomas208,Reference Palfreyman, Haycraft and Meyer259,Reference Yung, Lee and Ho260) . As children age, their daily intake of FVs decreases because families have less influence on children’s eating habits(Reference Larson, Neumark-Sztainer and Hannan209). A pilot study using food experience, multimedia and role models (teachers, peers and parents) according to Social Learning Theory, to promote consumption of FVs in Bangkok’s public primary schools, revealed a significant increase in eating behaviour scores for FVs, the types of vegetables consumed and consumption of FVs(Reference Sirikulchayanonta, Iedsee and Shuaytong261). It has been reported that eating with and social support from families is favourable to intake behaviour of FVs(Reference Story, Sztainer and French262).
Moreover, investing in women’s education is widely advocated as a crucial strategy for improving children’s dietary habits(Reference Makoka263). Modern consumers’ limited intake of FVs and eating habits are determined not only by a lack of nutrition knowledge or poor decision-making by households but also by much broader conditions encompassing social, economic and environmental aspects(Reference Tecco, Giuggioli, Girgenti and Krmac264,Reference Pereira265) . Thus, to support adequate consumption of FVs, along with innovative behaviour-change strategies, a focus on wider structural barriers such as the availability or accessibility of FVs and horticultural interventions at home or school is also required(Reference Pereira265).
School gardens
School gardens have beneficial effects on children’s preferences for FVs, their willingness to taste FVs and their food knowledge and attitudes(Reference Ohly, Gentry and Wigglesworth266). Whilst evaluating the combined impact of school vegetable gardens and complementary NE on school children in Burkina Faso(Reference Schreinemachers, Ouedraogo and Diagbouga210), Bhutan(Reference Schreinemachers, Rai and Dorji211) and Nepal(Reference Schreinemachers, Bhattarai and Subedi212), a significant increase in nutrition knowledge, sustainable agriculture and their preferences for eating FVs was observed, but no effect on consumption of FVs was seen. In the South African provinces, some of the problems encountered with school gardens were a lack of funds, tools, infrastructure, garden workers and technical support. Thus, to ensure the sustainability of school gardens, support by the government, external role players and policy directives is needed(Reference Laurie, Faber and Maduna213).
In Brazil, Bulgaria, Ecuador, Fiji, Jamaica, Jordan, Malaysia, Mauritius, Peru, Romania and Thailand, several school-based strategies are being adopted to positively influence the intake of FVs amongst school children, including mandatory quality standards for meals, beverages and snacks available in schools and vending machines; restrictions on unhealthy, low-nutritional-value processed foods; provision of healthy recipes and nutrition guidelines; and maintenance of school gardens(214). Similarly, in India, certain measures are being implemented to enhance the consumption of FVs, such as free provision of FVs, curriculum additions and improvement of the environment to enable healthy choices by schools, workplaces and community programs(215). However, school gardening programs should involve parents and the community as well, so that children can apply the knowledge gained through school gardening at their homes(Reference Schreinemachers, Ouedraogo and Diagbouga210–Reference Schreinemachers, Bhattarai and Subedi212). In many cities and states of India, such as Mizoram(216), Bhubaneswar(217), Karnataka(218) and Andhra Pradesh(Reference Kommu219), children, teachers and parents are participating in school gardening initiatives. Therefore, to create synergies between school and home, hands-on gardening education programs in LMICs must consider both environmental and sociocultural factors(267).
Home and community gardening
High cost, seasonal availability and fear of chemical contamination were cited as the major barriers to eating FVs, indicating the need for strategies emphasising organic farming and ensuring year-round availability(Reference Nsiah-Asamoah and Amoah268). Pesticides are used to prevent crop loss and disease; as well as to increase crop yield and production of FVs and for mono-cropping(269,Reference Gondo, Kamakama and Oatametse270) . However, a major concern is the presence of pesticide residues on FVs as a result of excessive pesticide use(Reference Soydan, Turgut and Yalçın271), which has significant implications for human health and the environment(Reference Gondo, Kamakama and Oatametse270). Despite these risks, pesticides are widely used, particularly in LMICs with food deficits and limited legislative restrictions(Reference Sarkar, Gil and Keeley272) and where farmers often lack education and knowledge about the use of registered pesticides, label information, maximum acceptable limit, safety practices such as the use of personal protective equipment and the use of multiple pesticides on a single commodity(Reference Gondo, Kamakama and Oatametse270,Reference Sarkar, Gil and Keeley272,273) . Although various studies have demonstrated the health benefits of the consumption of FVs, they can also be a source of toxic pesticide residues(Reference Soydan, Turgut and Yalçın271). Additionally, the use of pesticides in homes and gardens that produce their own food has increased in LMICs because these pesticides are easily available in local shops and informal markets(273). Evidence from Kenya(Reference Sarkar, Gil and Keeley272), Pakistan(Reference Khan, Yaqub and Hafeez274), Zambia(Reference Mwanja, Jacobs and Mbewe275), Uganda(Reference Ssemugabo, Bradman and Ssempebwa276) and India(Reference Kumar, Singh and Gandhi277) has revealed the presence of pesticides in FVs that exceed the maximum residue limits (MRLs).
Women’s training in improved home or kitchen gardens proved to be an effective intervention for increasing the production and consumption of FVs as well as micronutrient supplies from the garden, thereby enhancing household dietary diversity and nutrition security(Reference Schreinemachers, Patalagsa and Uddin220,Reference Schreinemachers, Patalagsa and Islam221) . In South Asia, where the major source of livelihoods is agriculture, nutrition-sensitive agricultural interventions that promote the cultivation of FVs in home gardens are of particular importance. A systematic review of studies from India, Bangladesh, Nepal, Pakistan and Afghanistan revealed that household- or farm-level agricultural interventions, such as perennial kitchen gardens and homestead gardening, had the potential to improve dietary diversity(Reference Bird, Pradhan and Bhavani222).
In several Asian countries, the community-based Helen Keller International Homestead Food Production (HFP) program targets women from poor households as its primary beneficiaries, to promote and assist them in establishing home gardens with a variety of FVs, along with poultry raising, animal husbandry and NE. In Bangladesh, Cambodia, Nepal and the Philippines, HFP programs have been shown to increase food production and the consumption of vegetables amongst beneficiary households, improve household food diversity and security through year-round availability of micronutrient-rich FVs, improve household nutritional status through NE and provide a source of income for the participating families(Reference Talukder, Haselow and Osei223). Similarly, in Burkina Faso, the positive impact of the enhanced-HFP program (E-HFP) (consisting of home gardens, poultry and NE) has been observed on mothers’ nutrition and empowerment outcomes, which is likely to affect their own, and their children’s and family’s well-being, as well as their food and nutritional security(Reference Olney, Bliznashka and Pedehombga224).
A community-based participatory farm diversification approach that included NE and agricultural activities such as poultry raising and kitchen gardening has been shown to increase the dietary diversity of young children in Western Kenya(Reference Boedecker, Odour and Lachat226). Similarly, a study conducted amongst caregivers of highly vulnerable children in nine regions of Ethiopia revealed that a permagarden intervention led to the consumption of household vegetables with a higher frequency and diversity(Reference Alemu, Mecha and Medhin227). In the Baitadi District of Nepal, another E-HFP-based study revealed: significant improvements in food production and consumption by families; household food security; the participation of families in home gardening, poultry rearing and preventive public health programs(Reference Osei, Pandey and Nielsen225).
Gardening initiatives can play a significant role in increasing the consumption of local FVs and providing hands-on experience in planting, growing and harvesting FVs at home and in communities, with a greater impact when coupled with NE, especially when targeting women(Reference Ren, Liu and Cao111,Reference Talukder, Haselow and Osei223,278,Reference Kishore279) . However, when implementing strategies to promote the consumption of FVs, it is necessary to raise awareness amongst producers and farmers regarding the safe and controlled use of pesticides on FVs, good agricultural practices, and integrated pesticide management, through knowledge transfer programs, NE and behaviour change initiatives(Reference Soydan, Turgut and Yalçın271,Reference Sarkar, Gil and Keeley272,Reference Kumar, Singh and Gandhi277) . In addition, researchers should focus on regular monitoring of pesticide residues in FVs to ensure safe consumption(Reference Gondo, Kamakama and Oatametse270,Reference Sarkar, Gil and Keeley272) , whereas stakeholders and legislative authorities should make regulation and registration of household pesticides mandatory(273).
Nutrition education (NE)
NE interventions have been shown to increase the proportion of total calories derived from FVs(Reference Jaime, Machado and Westpha229), which may be attributed to short-term positive behavioural changes(Reference Ha and Caine-Bish280). Even in food-insecure households in Pakistan, nutrition counselling targeting mothers improved their feeding behaviour, which led to a significant increase in the intake of FVs amongst children, thereby reducing undernutrition(Reference Khan, Rafique and Qureshi228). Similar results have been reported with a theory-based intervention involving mothers in Iran(Reference Lin, Scheerman and Yaseri206), a participatory community-based NE for caregivers in Malawi(Reference Kuchenbecker, Reinbott and Mtimuni230), a NE program combined with an agriculture intervention for caregivers in rural Cambodia(Reference Reinbott, Schelling and Kuchenbecker231) and NE, cooking and grocery sessions based on a health belief model in Somalia(Reference Kehm, Hearst and Sherman232).
A systematic review of intervention studies to promote healthy eating in seven LMICs (Brazil, Chile, Colombia, Iran, Panama, Trinidad and Tobago, and Tunisia) revealed that all interventions used NE, and three of them combined NE with improved access to foods or social support. Interventions targeted mostly women and used printed material, media use or face-to-face training and lasted from 6 weeks to 5 years. Four interventions targeted disadvantaged populations, and three targeted the entire population. In three out of four interventions targeting disadvantaged populations, healthy eating outcomes were improved, suggesting they were likely to reduce social inequalities in diet. All interventions directed at the entire population improved healthy eating outcomes across all social strata and were considered to have no impact on social inequalities in diet(Reference Mayen, de Mestral and Zamora152).
A 10-week multimodal NE imparted through conventional lectures, brochures and text messages significantly improved the intake of fruits and decreased the intake of processed foods amongst university students in Malaysia(Reference Shahril, Dali and Lua233). Similarly, through a lecture-based NE intervention amongst Mauritian housewives, a significant increase in nutrition knowledge and attitude was observed, resulting in an increase in the baseline intake of FVs(Reference Cannoosamy, Pem and Bhagwant234). On the other hand, taste was cited as the main barrier to the implementation of the NE strategy amongst Mauritian adults, with a significant improvement only in fruit but not vegetable intake(Reference Pem, Bhagwant and Jeewon281). Therefore, when designing NE strategies to promote healthy eating, consideration must be given to personal-level barriers(Reference Cannoosamy, Pem and Bhagwant234). However, NE alone will not improve the consumption of FVs if fresh FVs are unavailable or unaffordable. According to a study conducted in northern Ghana, promoting FBDGs through NE or BCC activities alone is insufficient for dietary improvements. Additional agriculture-based interventions such as diversification of the crops grown, increased production of specific crops, market-based strategies and supportive regulations are required to improve the affordability, availability and accessibility of FVs to households(Reference Lee282,Reference de Jager, Giller and Brouwer283) .
Farm-to-institution programs (FIPs)
FIPs are favourable for both regional farms and community institutions (schools, universities, childcare services, primary care, workplaces, farmers’ and mobile produce markets and religious organisations), as farmers can sell their locally and regionally grown fresh FVs directly to institutions and communities(284). Six LMICs (Brazil, China, India, Mexico, Vietnam and the Philippines) have conducted institutionalised dietary survey programs using rolling survey designs, which are typically more common in HICs(285). However, due to differences in seasons and time periods, estimates across different geographic and administrative levels may not be comparable(Reference Lagarde, Haines and Palmer286). An umbrella review revealed that interventions that promote the availability of FVs in community or institutional settings were broadly effective in increasing the consumption of FVs amongst children and adults(Reference Wolfenden, Barnes and Lane287). Furthermore, school-based strategies targeting the food environment and BCC domains had the largest effect on the combined intake of FVs(Reference Wolfenden, Barnes and Lane287). However, most of the systematic reviews identified in the umbrella review had intervention strategies implemented in HICs, indicating the need to investigate interventions promoting FVs in LMICs(Reference Wolfenden, Barnes and Lane287).
School feeding programs (SFPs)
SFPs are typically an important part of multi-sectoral policies related to food and nutrition and serve as social safety nets, improving the nutritional status of children and adolescents whilst reducing poverty and inequality. Worldwide, 388 million children receive school meals, the majority in India (90 million), followed by Brazil and China (both 40 million), the United States (30 million) and Egypt (11 million). The BRICS countries (Brazil, China, Russia, India and South Africa) provide integrated packages to about 48 % of all children receiving school feeding globally. These are the Nutrition Improvement Program in China, Federal Law No. 47 in Russia, the Mid-Day Meal Scheme in India (the largest program in the world), the National School Nutrition Program in South Africa and the National SFP in Brazil (equal-second largest). Between 2013 and 2020, there was a 9 % increase in the number of children receiving school meals globally (36 % in LICs and 86 % in LMICs), particularly in Africa. This growth reflects the widespread institutionalisation of SFPs as part of government policies centred on national development(235).
However, the World Food Programme (WFP) has launched a new, 10-year (2020–30) School Feeding Strategy in response to the fact that these programs were least effective where they were most needed, and approximately seventy-three million children in sixty priority countries remained uncovered(235). In forty-six countries, the WFP-supported home-grown school feeding (HGSF) initiative connects SFPs with local smallholder farmers to provide school children with locally grown, safe, diverse and nutritious food; promotes healthy eating amongst children; and in turn, enhances the program through community participation(235). Some of the examples of FAO/WFP-supported integrated school food and nutrition programmes in LMICs are: Purchase from Africans for Africa (PAA) program in African countries (Ethiopia, Malawi, Mozambique, Niger and Senegal); Brazil-FAO’s SFP in Belize, Costa Rica, El Salvador, Granada, Guatemala, Guyana, Honduras, Jamaica, Paraguay, Peru, Dominican Republic, Saint Lucia and Saint Vincent and the Grenadines; School gardens in Asia; Brazil-FAO’s (Africa) SFP in Malawi, Sao Tome and Principe. Other ongoing FAO-supported national SFPs are being executed in Tajikistan, Ethiopia, Rwanda, Uganda and Senegal(236). As providing meals alone does not guarantee improvements in nutritional status, additional components such as food or cash transfers, vouchers, NE, school gardens, cooking demonstrations, health and weight control classes, health marketing campaigns and environmental changes should be incorporated to strengthen FIPs(Reference Leroy, Gadsden and Rodríguez-Ramírez237,284,Reference Kurdi288) .
During the coronavirus disease (COVID) pandemic, when schools were closed, many LICs and LMICs (South Africa, Brazil, Bangladesh, Chad, Guinea, Niger, Kyrgyz Republic, Malawi, Madagascar, Somalia, Bolivia, Haiti, Cambodia, Syria, Afghanistan, South Sudan and Ethiopia) adopted alternatives to school feeding, such as cash and voucher-based transfers for food and hygiene items, food baskets as take-home rations, home delivery of fortified food, NE interventions, school health and nutrition packages, and COVID-19 messaging(235).
Food/cash transfers
Conditional/unconditional transfers under social protection programs include in-kind food transfers, food vouchers and cash transfers, being implemented alone or as part of a mixed modality(149). Cash transfers work more efficiently in delivering micronutrient-rich diets where markets operate adequately, whereas in remote areas with deficient markets, in-kind transfers have been shown to have positive impacts on children’s nutrition through SFPs(Reference Olney, Gelli and Kumar289). However, in-kind transfers are more expensive to implement than other programs, and are often not utilised for food purchases(Reference Sabates-Wheeler and Devereux290).
Cash transfer programs, such as the SEWA-UNICEF cash transfer scheme, have the potential to improve the intake of FVs and household dietary diversity(Reference Desai and Vanneman291). In Mexico, the Programa de Apoyo Alimentario (PAL), a conditional food assistance program that provides food/cash transfers to marginalised communities, had a positive effect on intake of FVs whilst also increasing household energy consumption. The food basket had a greater impact on energy and nutrient consumption than the cash group, supporting the evidence from an Ecuador study(Reference Hidrobo, Hoddinott and Peterman239) that in-kind transfers increase food consumption by more than receiving the equivalent amount in cash, and the marginal propensity to purchase food with cash income is significantly lower than with food vouchers(Reference Leroy, Gadsden and Rodríguez-Ramírez237). In terms of nutrition-related outcomes, vouchers for micronutrient-rich foods may be more advantageous than cash transfers, as the latter could lead to increased spending on unhealthy foods(Reference Ambler, de Brauw and Herskowitz292).
An extensive review of studies conducted in Sri Lanka, Niger, Congo, Ecuador, Bangladesh, Cambodia, Ethiopia, Mexico, Yemen and Uganda between 2006 and 2013 revealed that, in absolute terms, both cash and food transfers improved food consumption, income, dietary diversity, poverty and malnutrition; however, relative impacts varied across a range of dimensions. Cash transfers appeared to be marginally more effective than food in enhancing food consumption, whereas food seemed to outperform cash in increasing the caloric intake of households. In general, cash transfers and vouchers have been demonstrated to be more effective than food-based interventions(Reference Gentilini293). To determine the impact of vouchers on consumption habits of consumers, a WHO-led study as a part of the larger “Fruits and Vegetables for Vietnam and Nigeria” project is underway at local markets in Hanoi, Vietnam and Ibadan, Nigeria(Reference Ambler, de Brauw and Herskowitz292).
An analysis of the supply policy of FVs in India revealed that school-based interventions that integrate NE and some structural change in the surroundings, as well as a monthly food basket or cash transfer program at the household level, were effective for increasing the intake of FVs(Reference Khandelwal, Thow and Siegel238). Other studies have indicated that nutrition-related behaviour change communication (BCC), social marketing about the importance of dietary diversity and nutritional supplement strategies should be included in cash transfers/cash plus programs, to help consumers better understand the significance of micronutrient-rich diets(Reference Leroy, Gadsden and Rodríguez-Ramírez237,Reference Kurdi288) . Cash transfer programs and direct agricultural support programs (for, e.g. E-HFP) have the potential to improve nutrition outcomes by improving access to food, either through increased income or food production, particularly for chronically poor and food-insecure people in rural areas(Reference Gitter, Manley and Bernstein294), whereas SFPs are effective in improving both access to schools and educational attainment(235). These findings emphasise the need for innovative, mixed-modality strategies to promote FVs spanning a broad range of agriculture–nutrition sectors, especially targeting impoverished segments of society in LMICs(Reference Gitter, Manley and Bernstein294).
Food environment-based strategies
Evidence at the macro level on the effectiveness of interventions to increase the availability and affordability of FVs in LMICs is severely limited(Reference Hoffmanna, Moser and Saak151,Reference Kirk, Melloy and Iyer295) . The current food environment in LMICs could be improved by value chain-based interventions such as: enhancing FVs productivity; investing in research and development (R&D) to improve processing, storage and distribution technologies; informing, educating or influencing consumer behaviour and food choices through advertising, sponsorships and endorsements; amending labelling regulations; promoting new markets for by-products; reducing food losses and waste; reducing transaction costs such as public investment in road and telecommunication infrastructure(Reference Mason-D’Croz, Bogard and Sulser95,Reference Ridoutt, Bogard and Dizyee296) .
Improving agriculture production and productivity
To supply affordable and nutritious food, there is a need to conserve crop diversity and increase agriculture productivity by improving soil and water management techniques(Reference Wenhold and Van197,Reference Pingali, Aiyar, Abraham and Barret244,Reference Kumar and Babu245) . In Kenya, two United States Agency for International Development (USAID)-funded projects, viz. the Kenya Horticulture Development Program (KHDP) and Kenya Business Development Services (KBDS), were initiated to increase the production and productivity of FVs through farmer training, extension services, research on new varieties, demonstration plots and market information, resulting in an increase in crop production and household income(Reference Joosten, Dijkxhoorn and Sertse240). Similarly, the government of the Netherlands has launched HortiFresh(241) in Ghana and vegIMPACT NL in Indonesia(242), to establish a sustainable production sector for FVs that contributes to economic growth and food and nutrition security. The National Horticulture Mission is also being implemented in India to maximise the production and productivity of horticultural crops(Reference Ali, Dixit and Sidhu243).
Diversifying existing cropping patterns
Agriculture policies should shift their focus from cereal intensification to broader food supply diversification, which would provide smallholder farmers with new opportunities for agriculture-led growth(Reference Pingali246). By shifting research expenditure away from staples and oil crops and investing more in lowering production costs for non-staples such as FVs, the price of FVs could be reduced, making them more affordable and accessible to the population(Reference Siegel, Ali and Srinivasiah148,Reference Pingali246) . However, to ensure safe and nutritious food for consumers without affecting soil health, it is necessary to promote good agricultural practices amongst the farming community, along with improved food safety standards and incentives for a more health-oriented food industry(Reference Pingali, Aiyar, Abraham and Barret244). In addition, investments in transport, cold storage and market information systems, farmer connectivity, general literacy, specialised training for farmers, property rights to land and other assets are required for developing markets for perishable products and diversifying production systems(Reference Pingali246). Agricultural marketing infrastructure and information services must be developed and strengthened, especially in rural areas(Reference Kumar and Babu245).
Improving access to markets and trade
Improving access to markets and trade will ultimately enhance the competitiveness of farmers in both domestic and international markets, thereby expanding access to food(Reference Kumar and Babu245). In Punjab (India), the most accessible and profitable market for both producers and consumers is Apni Mandi, where farmers sell fresh FVs directly to consumers without involving middlemen(Reference Ali, Dixit and Sidhu243). In LMICs, healthy foods are considerably more expensive and unaffordable for the vast majority of the population(Reference Temple, Steyn and Fourie297). Market-based fiscal and regulatory measures, such as increasing the price of unhealthy foods or reducing the cost of FVs through exemption from goods and services tax or a value-added tax; subsidies or voucher systems for vulnerable groups; subsidies to food and agriculture industries; improving nutritional information or restricting the marketing of unhealthy foods, are required to increase the purchasing power of households, and thus the consumption of FVs(Reference Braun195,Reference Wenhold and Van197,Reference de Jager, Giller and Brouwer283,Reference Lee, Mhurchu and Sacks298–Reference Claro, Carmo and Machado301) . In Ecuador, food transfers and financial incentives such as cash and vouchers, along with NE, led to a significant improvement in the quantity and quality of FVs consumed(Reference Hidrobo, Hoddinott and Peterman239). Furthermore, a study in Ghana concluded that agricultural and market-based strategies are important to increase the availability and accessibility of FVs(Reference Hidrobo, Hoddinott and Peterman239). FVs are highly perishable; therefore, in addition to border measures and other food safety-related policy objectives, the government should make efforts to reduce trade barriers for FVs, to increase their availability and affordability(149).
Remodelling governance and political structures
Better governance and political structures are crucial for the effective functioning of food-based policies and programs, and they must be contextualised according to socio-economic and environmental conditions. To improve the accessibility, availability and affordability of FVs in LMICs, it is now becoming more important for governments and agricultural communities to reposition nutrition as central to their development agenda(Reference Mayen, de Mestral and Zamora152,Reference Khandelwal, Verma and Shaikh164,Reference Kumar and Babu245,Reference Dev and Sharma302) . With government leadership, robust legislation, civil society participation and intersectorality in the food system, integrated programs and policies linking school meals, NE and local food production should be designed(Reference Sidaner, Balaban and Burlandy303). The WHO suggests implementing policies, such as increasing engagement with food retailers and caterers, to increase the availability, affordability and acceptability of FVs(304).
A qualitative policy analysis in India identified specific strategies to improve the external food environment for FVs, which included strategic framing and engagement with supply chain policy actors; using public–private partnerships for innovations in the food system; maximising existing coordination across the agriculture, economic and health sectors; multi-sectoral efforts to strengthen and expand good-quality data collection methods to estimate the impact of policies regarding FVs; and consumer access to FVs(Reference Thow, Verma and Soni247). Successful public sector, private sector and civil society collaborations were seen in LMICs to increase the consumption of FVs(305). For instance, Indonesia, Bangladesh, the Philippines, Brazil and China collaborated with Kraft Foods Inc. to invest in FVs-centred agriculture and NE(248). The Walt Disney Company’s “Outdoor Kitchens” concept in China and Morocco was intended to increase guests’ direct access to FVs whilst visiting theme parks(Reference Brandon249). In South Africa, 10–25 % subsidies on FVs and investment in agro-processing helped create jobs and increased supply and demand for FVs(Reference Sturm, An and Segal250,Reference Molele251) .
Considering that socioeconomic factors are modifiable, studies prioritise the need for income-generating policies and education-focused intervention programs that would improve household affordability and reduce food insecurity. However, increasing the affordability and availability of FVs alone would not tackle their inadequate intake in LMICs, unless people are made aware of the health benefits of FVs. Therefore, nutritionists, health ministries and other stakeholders must develop comprehensive interventions that are multipronged, flexible, open to input from target groups and theoretically based(Reference Pengpid, Vonglokham and Kounnavong306–Reference Karim, Zaman and Rahman310).
According to a recent FAO analysis, repurposing existing public support for agriculture in all regions of the world is urgently required to enhance the production of nutritious foods, which would make healthy diets more affordable globally and particularly in middle-income countries. However, due to certain policy constraints, policymakers, particularly in LICs and some LMICs, should seek international public investment support to mobilise significant financing for general services support and fiscal subsidies to consumers. In addition, for repurposing to be most effective, complementary policies targeting food environments and consumer behaviour towards healthy eating patterns will be important(149). However, the extent to which food and agricultural support can be repurposed depends on the local context, political regime, interests, ideologies and incentives of each country. Most importantly, a robust monitoring and surveillance system is required to track both the negative and positive impacts of repurposed food and agricultural policies(149).
Conclusion
Despite the importance of FVs, their consumption in LMICs is inadequate, which is mainly attributable to social, demographic, environmental, personal, cultural and macro-level barriers. Over the last decade, the mean intake of FVs decreased in Africa and Oceania, whilst it increased in Europe, Asia, Latin America and the Caribbean, and remained unchanged in North America. Significant regional and seasonal variation in the consumption of FVs was observed both within and across LMICs. However, none of the regions had intake levels reaching WHO recommendations. Studies on strategies and interventions to promote the intake of FVs in LMICs are very scarce. However, evidence has indicated that nutrition-agriculture-based interventions to improve the consumption of FVs, such as multicomponent FIPs with behaviour change initiatives, NE, food/cash transfers and gardening programs at the school, home and community level (E-HFPs), had an added impact; whereas NE or BCC or school gardening or skill development alone, without integrating other strategies, was the least effective or showed mixed results. The path to resolving the issue of low intake of FVs should not merely focus on promoting their consumption but also fixing the barriers as well. Achieving the goal of adequate consumption of FVs in LMICs requires multisectoral collaboration to develop a combination of innovative strategies, interventions and policies at the individual, community and national level, taking into account the psychosocial, environmental and social factors that influence the intake of FVs.
Implications for research
The relatively limited number of relevant studies identified in LMICs indicates a considerable gap in research on barriers to the intake of FVs and effective strategies to overcome them. Most of the strategies in LMICs focused solely on increasing the intake of FVs at the individual level, with less emphasis being placed on incorporating multiple factors such as social and environmental conditions, food system regulation, agriculture-nutrition policies and programs. Conversely, in developed countries, a number of multi-sectoral policy-based interventions are being implemented at the regional or state level to increase the consumption of FVs. However, the results from these countries cannot be generalised to LMICs because of the differences in socio-economic and environmental contexts in which food consumption behaviour develops. Therefore, to bridge this gap, a narrative review was conducted to expand research in this area with a wider perspective and to provide policymakers with evidence-based information for better implementation of multi-component interventions that would enhance the intake of FVs in LMICs. To develop a socio-ecological framework of interventions adapted to LMICs, future research should emphasise the following: identifying context-specific factors that influence dietary behaviours; widening and strengthening food environment research; targeting broader food environments, particularly beyond schools.
Financial support
This study received no specific grant from any funding agency in the commercial or not-for-profit sectors.
Conflicts of Interest
There were no conflicts of interest.