The retirement earnings test (RET) is a rule that applies to adults between age 62 and full retirement age (FRA) who are entitled to receive Social Security retirement benefits. The rule specifies that Social Security withholds a portion of the benefit if an individual has other earnings exceeding a certain level. For people attaining FRA after 2018, the annual exempt amount in 2018 was $17,040. That is, any earnings in excess of this amount are subject to withholdings. Social Security withholds $1 in benefits for every $2 of earnings in excess of the exempt amount. If earnings are above $45,360, Social Security withholds $1 in benefits for every $3 of earnings in excess of the higher exempt amount. Once a person attains their FRA, their benefits are increased to offset the withholdings.
RET could potentially affect a large number of Americans, a majority of whom claim at an age when the RET applies. About 40% of beneficiaries claim their benefits at 62, while an additional 15% claim after 62 but before FRA (Munnell and Chen, Reference Munnell and Chen2015). Whether the RET affects behavior is more difficult to ascertain. Several studies have aimed to estimate the impact of the RET on labor market outcomes of older adults (Burtless and Moffitt, Reference Burtless and Moffitt1985; Friedberg, Reference Friedberg1998, Reference Friedberg2000; Song, Reference Song2003; Song and Manchester, Reference Song and Manchester2007; Haider and Loughran, Reference Haider and Loughran2008; Engelhardt and Kumar, Reference Engelhardt and Kumar2009; Gelber et al., Reference Gelber, Jones and Sacks2014). While the magnitude of the estimates variesFootnote 1, it seems clear that at least some individuals are induced to drop out of the labor market due to the RET.
In recent years, economists and behavioral scientists have been interested in the questions of whether and how older adults understand the rules of the RET, which may affect retirement decisions. Research has shown that there is widespread confusion about the impact of work earnings on Social Security retirement benefits prior to FRA (Brown et al., Reference Brown, Kapteyn, Mitchell and Mattox2013; Liebman and Luttmer, Reference Liebman and Luttmer2015). In particular, even people who are aware of the RET do not know that benefits are increased after FRA to offset withholdings (Brown et al., Reference Brown, Kapteyn, Mitchell and Mattox2013). Brown et al. (Reference Brown, Kapteyn, Mitchell and Mattox2013) concluded that ‘the mechanics of the Earnings Test are sufficiently obscure to most people that they are likely to have great difficulty deciding what is in their best interest’ (p. 4).
A critical aspect of the rule is that these withholdings are not ‘lost’ to Social Security beneficiaries. Once a person reaches their FRA, their monthly benefit is increased permanently to account for the months in which benefits were withheld. This additional amount is actuarially fair; that is, it provides individuals with the same total expected lifetime benefits. The Social Security Administration's website has several webpages that explain how the RET works (e.g., the ‘program explainer’Footnote 2 and the RET CalculatorFootnote 3).
However, one could forgive people their lack of awareness of this point. A quick search for online resources providing information about the RET yielded numerous examples of articles on the impact of the RET on benefits for working claimants in prominent outlets such as MSNBC, the Washington Post, Fidelity and others. However, they typically fail to make salient, and in some cases to report, the post-FRA benefit increase of the RET.Footnote 4 It is little surprise, then, that people believe that benefits are ‘lost’ if one claims while earning any meaningful income from employment. This confusion may lead to suboptimal claiming choices, potentially reducing labor force participation among adults between age 62 and their FRA.
Prior research by Brown et al. (Reference Brown, Kapteyn, Mitchell and Mattox2013) tested the effectiveness of various ‘frames’ to describe the effects of the RET on benefits, but found very few significant effects on understanding of the test and in particular of the post-FRA benefits offset.
In this study, we similarly ask the question: Can better information improve the public's understanding of the RET? To answer it, we conducted an online experiment that tested the effect of simple, concise information treatments on respondents' knowledge on the rules of the RET. We find that a straightforward, simple information treatment has a large effect on knowledge of the RET and on prospective choices regarding working and claiming benefits. While we tested three distinct information treatments (a short, simple one, a treatment with detailed information and a narrative illustration of the effects of RET on benefits, and a treatment with detailed information and a visual illustration of the effects of RET on benefits), our results suggest that more detailed information does not improve knowledge; the simplest intervention yielded the same effect as the more comprehensive ones.
1. Our experiment
We conducted the experiment online, on the Understanding America Study (UAS) Internet panel, described in the introduction to this Special Issue. We obtained responses from 3,129 panel members for this study. Respondents were randomized into one of three information treatments. The first treatment provided a short, simple description of the RET, with text based on language found in the Social Security Administration's website (T1). The second treatment provided more detailed information about the RET, and included an illustrative example of how the RET would affect benefit amounts in practice for an individual – a 62-year-old working man – if he chose to either retire from work and claim his Social Security Administration (SSA) benefit, or to continue working and claim his SSA benefit (T2). The example provided the character's current salary, and the benefit amounts he could expect if he took each of those two possible paths. The example also specified the benefit amount he could expect after reaching FRA if he chose the second path (continue working and claim).
The third treatment provided the same detailed information as T2, but the example was provided in the form of a visual illustration of the effects of the RET on benefit amounts (T3), using the same character's salary and benefit amounts as in T2. This is reproduced in Figure 1.
Illustrative example of effect of RET on benefits.

Once presented with the information, participants were asked a series of questions to assess knowledge about the RET. The knowledge questions included True/False questions, questions through a vignette sequence first deployed in Brown et al. (Reference Brown, Kapteyn, Mitchell and Mattox2013) about a hypothetical character, and questions based on two shorter vignettes of individuals facing employment and benefit claiming decisions.
There were five True/False questions, which asked about knowledge of aspects of Social Security retirement benefit rules relevant to the RET, including whether individuals can claim benefits if they are still working; whether SSA withholds benefits from working individuals of any age; and the age at which the RET applies for working individuals. These questions provide a baseline understanding of respondents' basic knowledge of various aspects of the RET.
The vignette sequence (from Brown et al., Reference Brown, Kapteyn, Mitchell and Mattox2013) provides a more detailed overview of participants' grasp of the RET and its implications over the course of an individual's retirement, through a path-dependent set of scenarios (all about a single fictional character on his 63rd birthday), and associated questions. In the sequence, the character has been retired from work and claiming retirement benefits for 1 year, but decides to return to work part-time. The first question asked what the respondent believes will happen to the character's retirement benefit during the first year he returns to work (whether benefits remain unchanged, increase or decrease). A series of subsequent questions about the impact of the character's employment on his benefits depends on the answer to this first question. Respondents were then all asked to consider subsequent scenarios for the vignette character, including what happens to his benefit if he stops working again at 64 and what happens to his benefits after FRA.
Two additional short vignettes asked respondents to consider the case of two fictional characters facing working and claiming decisions. The characters' situations and choices were described, with specific salary and benefit amounts provided taking the RET into account. Respondents were asked to reflect on what choices they would make in the characters' place or what they would advise the character to do, and then to ‘explain’ their choice through agreement with statements regarding the reasons for their choice. While the first question (what respondents would do) does not have a right or wrong answer, the ‘reasons’ provided for that choice do. For instance, in one of the vignettes a character has decided to claim his SSA benefit at age 62. He faces the choice to stop working and claim or to continue working. Respondents were asked which one of those two paths would be preferable for the character. If a respondent chose ‘stop working’, then they were asked to select from among possible reasons for their choice, including: (1) the character should stop working because they will permanently loose part of their retirement benefit if they continue working, or (2) the character should stop working since he can live on his benefit and his savings. The first response option is incorrect: benefits are not permanently lowered, as per RET rules. Respondents were also allowed to select ‘other’ and type in their answer. These questions enable us to assess whether participants' choices are informed by correct or incorrect assumptions.
2. Results
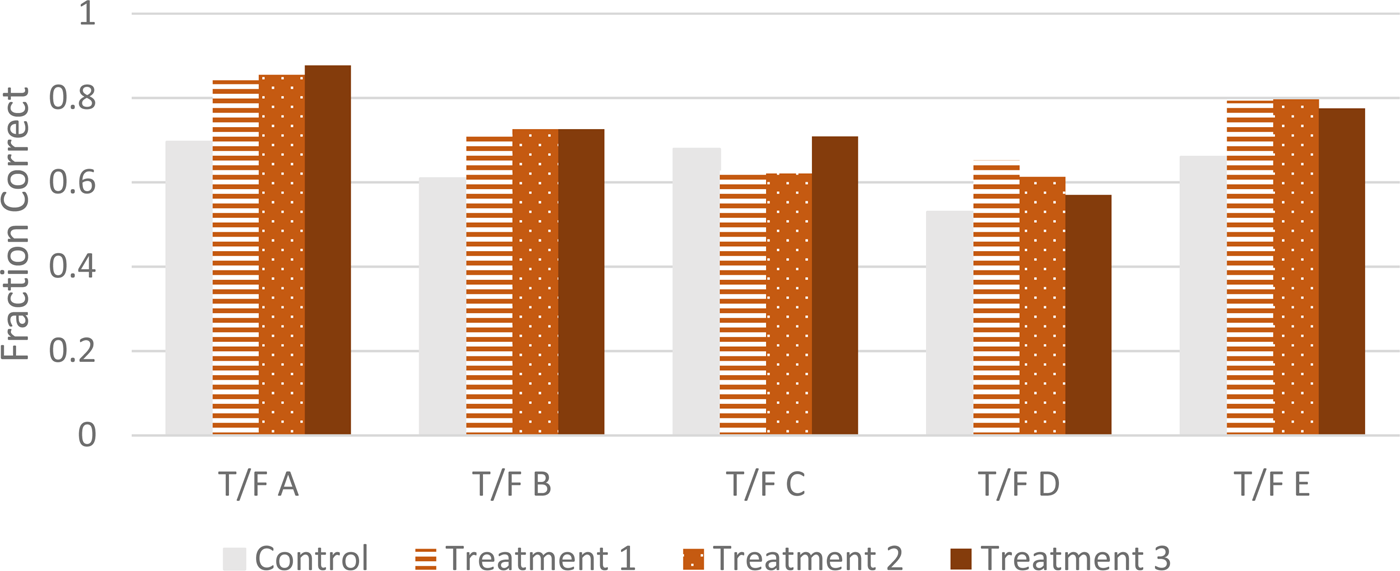
Figure 2 shows the fraction of people who answered each of the six True or False questions correctly. In all cases, a larger fraction of those in the treatment groups answered the question correctly, with the differences between the treatment and the control groups statistically significant. This is true for almost all of the knowledge questions, suggesting a difference in understanding of key aspects such as whether individuals can claim benefits while working, and the age at which the RET results in benefit withholdings. The exception is the third True/False question, where there are no statistically significant differences between the treatment groups and control groups.Footnote 5
Correct responses to True or False RET-knowledge questions by treatment status.
Note: Bars show fraction of respondents who got the answer correctly. N = 3,129. p-value of difference between any of the treatments and the control is <0.01 for questions T/F A, T/F B, T,F D (except for treatment 3, p-val = 0.12) and TF E. For question T/F_c, p-value > 0.01 for T1 (0.03) and T3 (0.23), and T < 0.01 for T2. In addition, the test for equality of coefficients for T1, T2 and T3 yields a p-value > 0.1 for T/F_a, T/F B and T/F E; p-value < 0.01 for T/F C and T/F D.

The effect of the simple treatment (T1) is important. One way to appreciate the magnitude of the impact is to see that the results imply a reduction of between a third and one-half of the respondents who get the answer wrong. On the other hand, there is generally no statistically significant difference across the different treatment groups. The null-hypothesis of equality of coefficients for T1, T2 and T3 cannot be rejected for three of the True/False Questions. In the True/False question about whether the RET withholdings apply only to people under their FRA, that hypothesis can be rejected with a p-value <0.01, but note that the coefficients for the more developed treatments are smaller than that of the simple treatment.
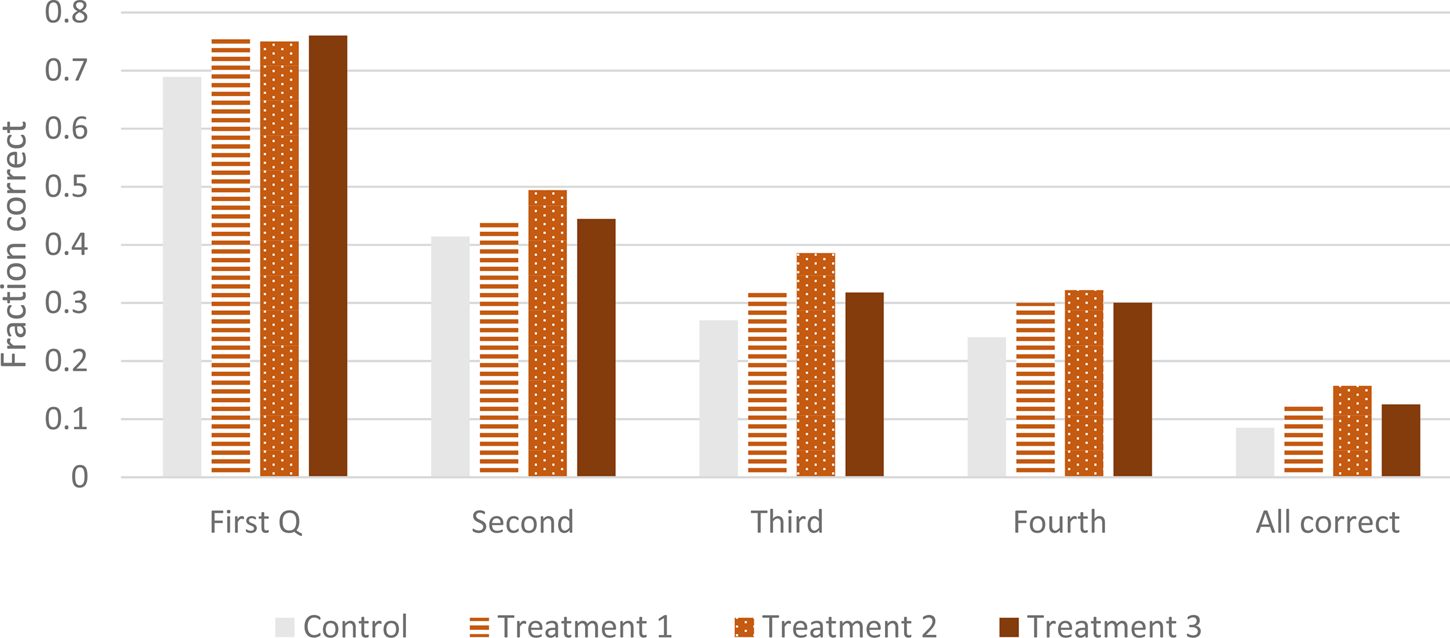
As described in the previous section, we also test knowledge through the use of the vignette sequence first deployed in Brown et al. (Reference Brown, Kapteyn, Mitchell and Mattox2013). In this case, since the questions asked are path-dependent, some questions are only asked to participants choosing a particular answer. Figure 3 shows the fraction of respondents who followed the correct paths up to different points. The first question, which asks respondents whether Social Security benefits for the vignette character would increase, decrease or remain unchanged during the year he returns to part-time work earning more than the cutoff amount, was correctly answered by about 69% of respondents in the control group, and above 75% of respondents in each of the treatment groups. Only 8.5% got all of the questions correctly in the control group, but this percentage increases by more than 50% in each of the treatment groups (12.5% in Treatments 1 and 3, and almost 16% in Treatment 2). The questions are relatively difficult, so it is not entirely surprising that even in the treatment groups only a small percentage gets them all correct.
Correct responses to vignette questions by treatment status.
Note: Bars show percentage of respondents who obtained all correct responses until that point by treatment status. N = 3,110. p-value of difference between any of the treatments and the control is <0.01 for each of the four levels and for ‘all correct”. p-values of the difference tests across each of the treatment arms are all >0.05.

A key thing to note is that a similar pattern as from the T/F questions of Figure 2 emerges: namely, there is an important but incomplete effect of all of the treatments. There is a statistically significant difference between the correct responses in the treatment and control groups, but not much difference across the treatment groups.
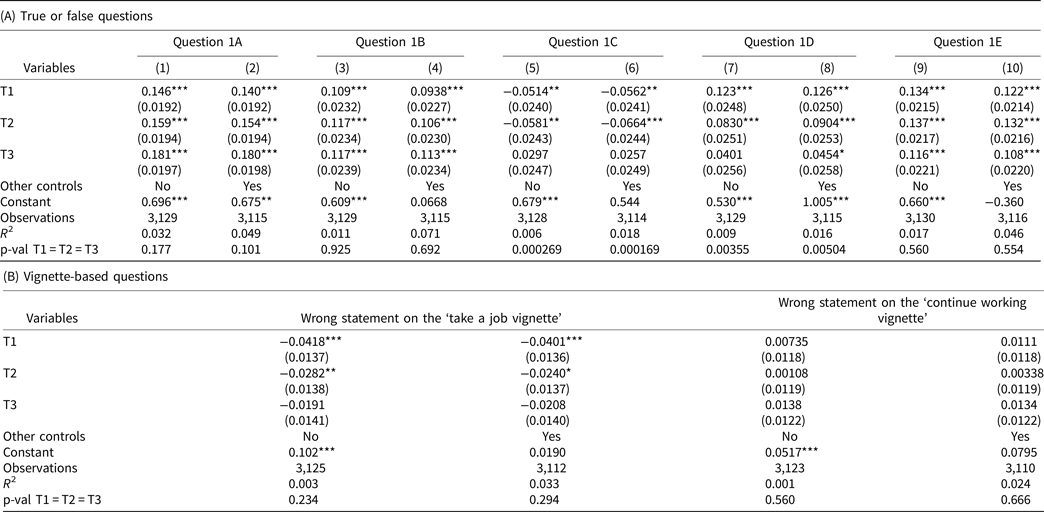
Table 1 shows the impact of the treatment groups on the knowledge questions and scores. It includes the questions described in Figures 2 and 3. The results are presented for regression models that include only the treatment status dummies, and also for models that include additional control variables (gender, age, race, ethnicity, education level and labor force status). Furthermore, we add two additional control variables: financial literacy and a Social Security knowledge score, which we link from earlier UAS surveys.Footnote 6 Adding control variables does not qualitatively change the results. The standard errors are somewhat reduced, but the coefficients are roughly of the same magnitude and significance level.
Treatment effects on knowledge scores

Note: Columns show the coefficients on a regression of indicators of answering the question correctly, against the treatment dummies (the control is excluded category). Second and fourth columns include demographic controls (age, gender, race and ethnicity) as well as measures of financial literacy and knowledge of social security from earlier surveys. The last row shows the p-value of the t-test of the null of equality of the coefficients of each of the treatment dummies.
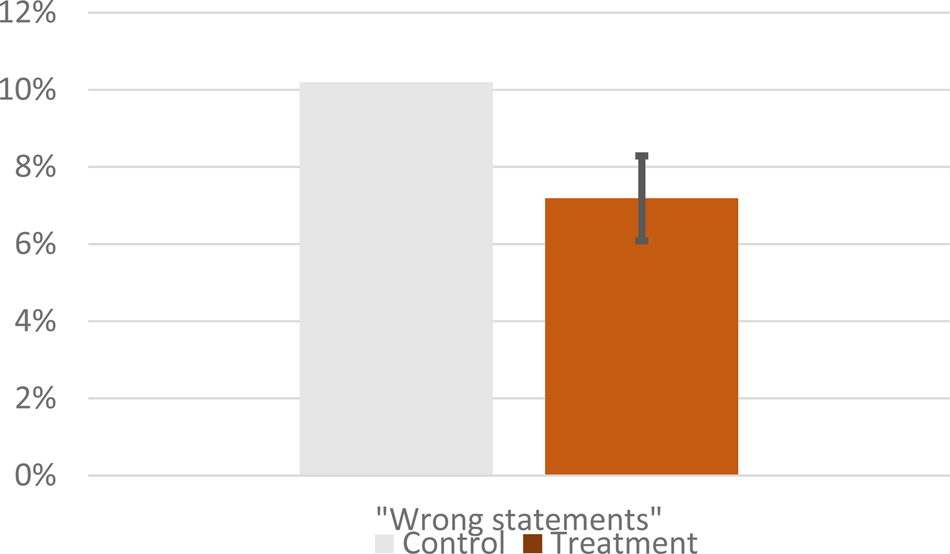
As described earlier, we added an additional set of questions based on two short vignettes about fictional characters facing employment versus benefit claim decisions. We asked respondents to consider what they would do in the characters' place, and why. The choice itself cannot be right or wrong, but the follow-up question about the respondents' reasons for the choice can be. A very small percentage of respondents gave reasons considered ‘wrong.’ In the control group, slightly above 10% of respondents gave such an answer (see Figure 4). Respondents in the treatment groups gave fewer of those answers (under 7%), and the difference is statistically significant. As with the knowledge outcomes, however, there are no statistical differences across the treatment groups.
Treatment effects of information on the probability of providing an advice based on a wrong statement on ‘Joe's vignette”.
Note: Bar chart shows the percentage, across the control group and the pooled treatment arms, giving advice and stating a reason for that advice that is inconsistent with RET rules (e.g., saying that a person should not keep working because their retirement benefits are lost if earning above the RET). The range plot shows 95% confidence interval of the difference treatment and control. p-value of the difference = 0.009, N = 3,125.

Finally, we investigate whether the treatment effects are stronger for certain groups of respondents. Of particular interest is whether those with low levels of literacy answer the questions differently. To assess this, we re-estimated the regression models reported in Table 1 for the sub-samples of respondents who had, at baseline, lower than median levels of financial or Social Security literacy, respectively. These results are presented in Online Appendix Tables A and B. The coefficients for T1, T2, and T3 under these subsamples tend to be only slightly larger than those corresponding to the full sample. Furthermore, it is also the case in these subsamples that the coefficients for T2 and T3 are not much larger than T1.
3. Conclusions
The potential lack of understanding of RET rules has been a concern among researchers and observers for decades. This lead Gruber and Orszag (Reference Gruber and Orszag2003) to recommend clear and concise mailings with information about Social Security benefit rules, in particular to older people. Biggs (Reference Biggs2008) suggested educating the media about these rules.Footnote 7 Five years ago, Brown et al. (Reference Brown, Kapteyn, Mitchell and Mattox2013) argued for updating the information of financial advisers and SSA field agents to ensure future beneficiaries are well-informed to make the best work and retirement decisions for themselves and their families.
Despite awareness about this problem, there have been very few attempts to study what type of information interventions may be successful (an exception is Brown et al., Reference Brown, Kapteyn, Mitchell and Mattox2013, which finds different ‘frames’ to present RET information to be unsuccessful in this regard). We conducted a study to assess whether and to what extent information about the RET can improve knowledge and affect retirement decision-making. The study included three broad types of questions to measure the effects of the information treatments (short vignettes, a long, path-dependent vignette sequence first used in Brown et al., Reference Brown, Kapteyn, Mitchell and Mattox2013, and a set of True/False questions). The results are consistent across the types of questions, with a relatively stable emerging pattern.
We find that a simple treatment with basic information can have important results. The simplest intervention had a substantial effect on understanding, which reduces miscomprehension by about one-third. We find that no further effect is achieved from the additional content provided in other treatments.
This result differs from what we hypothesized prior to the experiment. Based on the literature, we expected that the basic treatment (T1) would be less effective than it turned out to be, and that the additional treatments would be more effective than the basic treatment. Brown et al. (Reference Brown, Kapteyn, Mitchell and Mattox2013) had concluded that ‘knowledge of the mechanics of the earnings test is very limited. In particular, the actuarial adjustments of benefits after the FRA is largely not understood by the American workforce. Yet our efforts to find informational frames that help individuals make more informed decisions have proved disappointing…’ (p. 21). In that sense, our results are both optimistic and pessimistic about the potential for education campaigns to improve people's understanding of the RET. They are optimistic in the sense that they show that even a very simple information campaign can reduce misunderstandings by between 30% and 50%. But they are pessimistic in that our other, more comprehensive treatments did not result in additional improvement.
Other ways of presenting information should be explored to fill the RET knowledge gaps that these simple interventions cannot accomplish. In the meantime, since we confirm it is indeed possible to educate a significant fraction of the general population about RET with relatively accessible, straightforward information, policymakers could use these results to promote the provision of simple information treatments.
Supplementary material
The supplementary material for this article can be found at https://doi.org/10.1017/S1474747219000222.
Acknowledgements
Research reported in this publication was supported by the National Institute on Aging of the National Institutes of Health and by the Social Security Administration, under Award No. 3R01AG020717. The content is solely the responsibility of the authors and does not necessarily represent the official views of the National Institutes of Health or the Social Security Administration. We would like to thank David Rogofsky, Laith Alattar, Richard Chard, and Barbara Smith for their invaluable input. We also thank Arie Kapteyn, Tania Gutsche, and participants at the Workshop for the Special Issue of the JPEF on “New Longitudinal Data for Retirement Analysis and Policy” for their valuable comments. Programming the Internet survey was Bart Orriens; this research project would not have been possible without him.Footnote *