Introduction
Neglected tropical diseases (NTD) impose a huge disease burden worldwide. Visceral leishmaniasis (VL) is one of the NTD which leads to a high number of morbidity and mortality. It is marked by the existence of Leishmania parasites in the visceral organs such as spleen, liver and bone marrow and it accounts for clinical manifestations such as hepatomegaly, splenomegaly, pancytopenia, prolonged fever and weight loss (Tajebe et al., Reference Tajebe, Getahun, Adem, Hailu, Lemma, Fikre, Raynes, Tamiru, Mulugeta, Diro and Toulza2017). Leishmanial parasites have the potential to subvert the immune system of the host and survive within the macrophage phagolysosome. They change the immunological and inflammatory host responses to their profit by suppressing the nuclear factor κ B (NFκB) complex. The latter leads to the downregulation of nitric oxide synthase (iNOS) expression in infected macrophages and hinder the production of nitric oxide (NO), assisting its replication and sustained infection (Marcusso Orsini et al., Reference Marcusso Orsini, Kawakami, Panis, Fortes dos Santos Thomazelli, Tomiotto-Pellissier, Cataneo, Kian, Megumi Yamauchi, Junior, Florencio and de França Lopes2016). In recent years, many studies have been carried out to explore the possibility of development of new drugs with immunomodulatory properties.
At present, chemotherapy is the only option which can be used to control VL. For all clinical forms of leishmaniasis, pentavalent antimony is still used in Bangladesh, Nepal, West Bengal, Jharkhand and Uttar Pradesh (Sundar and Chakravarty, Reference Sundar and Chakravarty2015; Singh et al., Reference Singh, Singh, Chakravarty and Sundar2016). The adverse outcomes such as abdominal pain, hepatic and cardiac problems and growth of resistant parasites have severely affected the efficacy of antimonial drugs (Singh et al., Reference Singh, Singh, Chakravarty and Sundar2016). Other available options such as amphotericin B (AmB), miltefosine, pentamidine and paromomycin are also associated with unfavourable adverse outcomes. High toxicities associated with them have restrained their use in many regions (Das et al., Reference Das, Ranjan, Sinha, Verma, Lal, Gupta, Siddiqui and Kar2001; Chattopadhyay and Jafurulla, Reference Chattopadhyay and Jafurulla2011; Chawla et al., Reference Chawla, Jhingran, Panigrahi, Stuart and Madhubala2011; Sundar et al., Reference Sundar, Singh, Rai, Prajapati, Singh, Ostyn, Boelaert, Dujardin and Chakravarty2012). Although lipid formulations of AmB seem efficacious, its effectiveness is still a concern due to issues of resistance and high cost (Croft et al., Reference Croft, Sundar and Fairlamb2006).
The landmark cytokines such as TNF-α, IFN-γ, IL-17 and IL-12 indicate Th1 immune response and IL-10 and IL-4 indicate Th2 immune response (Piscopo and Mallia Azzopardi, Reference Piscopo and Mallia Azzopardi2007). IL-12 along with IFN-γ plays a crucial role in the control of disease via parasite death (Bacellar and Carvalho, Reference Bacellar and Carvalho2005). Likewise IFN-γ together with TNF-α protects the host against VL through increasing the levels of NO (Salim et al., Reference Salim, Sershen and May2016). In contrary to this, high concentrations of IL-4 and IL-10 deactivate the Leishmania killing efficacy of macrophages. In fact, these cytokines favour the growth and multiplication of intracellular parasites (Peruhype-Magalhães et al., Reference Peruhype-Magalhães, Martins-Filho, Prata, Silva LDe, Rabello, Teixeira-Carvalho, Figueiredo, Guimarães-Carvalho, Ferrari and Correa-Oliveira2005). Thus a dominant Th1 immune status over Th2 inhibits parasite growth through activated macrophages for the elimination of intracellular parasites via NO and other reactive oxygen species (ROS) (Piscopo and Mallia Azzopardi, Reference Piscopo and Mallia Azzopardi2007). Altogether the paucity of effective treatment approaches has been the driving impulse for the search of new therapeutic entities against Leishmania. A new approach to finding effective remedies for the cure of leishmaniasis necessitates a novel agent which not only has leishmanicidal activity but also has the potential to strengthen the immune status of the host. In this regard natural products are gaining increased attention as they are safe and many of them possess immunostimulatory efficacy (Duarte et al., Reference Duarte, Tavares, Valadares, Lage, Ribeiro, Lage, Rodrigues, Faraco, Soto, da Silva and Fumagalli2016). Many studies have researched the antileishmanial efficacy of single molecules in different murine animal models. For instance, oral administration of a clerodane diterpene to L. donovani-infected hamsters decreased the parasite burden in liver, bone marrow and spleen (Misra et al., Reference Misra, Sashidhara, Singh, Kumar, Gupta, Chaudhaery, Gupta, Majumder, Saxena and Dube2010). Similarly another compound, (-)-α-Bisabolol when administered to L. infantum-infected BALB/c via oral route at the concentration of 200 mg kg−1, showed marked parasite reduction (71–89%) with no toxic effects (Corpas-Lopez et al., Reference Corpas-Lopez, Morillas-Marquez, Navarro-Moll, Merino-Espinosa, Diaz-Saez and Martin-Sanchez2015). Triterpenoids are known to have many pharmacological effects such as immunostimulatory, antiviral, antimicrobial and anticancerous. These secondary metabolites are responsible for different biological activities like immunomodulation in many plants. Several triterpenoids such as derivative of oleanolic acid are under clinical trials for the treatment of chronic diseases like tumours (Han and Bakovic, Reference Han and Bakovic2015). These derivatives have also been found to show a significant activity against Mycobacterium tuberculosis in BALB/c mice (Hong et al., Reference Hong, Kurzrock, Supko, He, Naing, Wheler, Lawrence, Eder, Meyer, Ferguson and Mier2012; Jimenez-Arellanes et al., Reference Jiménez-Arellanes, Luna-Herrera, Cornejo-Garrido, López-García, Castro-Mussot, Meckes-Fischer, Mata-Espinosa, Marquina, Torres and Hernández-Pando2013). In the current research work, the leishmanicidal activity of a triterpenoid, lupeol was monitored as it possesses various biological effects such as hepatoprotection, nephroprotection, antileukemic and cardioprotection. Lupeol has the ability to annihilate diseased and unhealthy human cells without affecting normal cells (Wal et al., Reference Wal, Srivastava, Wal, Rai and Sharma2015). Das et al. (Reference Das, Jawed, Das, Sandhu, De, Dinda, Akhter and Bhattacharjee2017) also described the antileishmanial potential of lupeol against VL in BALB/c mice when administered via intraperitoneal route. In this study, infected mice were treated with lupeol (75 mg kg−1) for 5 days alternatively after 14 days of infection. Further, the parasitological and immunological parameters were examined on 30 post treatment day (p.t.d). However in our study, the therapeutic potential of lupeol was investigated after 30 days of infection. The latter time regimen is a conventional period which allows the substantial progression of infection (Melo et al., Reference Melo, Goyard, Fiette, Boissonnas, Combadiere, Machado, Minoprio and Lang2017). The infected mice were treated orally with lupeol (25 and 50 mg kg−1 b.wt.) for 2 weeks and sacrificed on 14th p.t.d. Moreover along with parasitological and immunological studies, the safety profile of lupeol was also checked in vitro and in in vivo model. In addition to this antileishmanial activity of lupeol was also compared with the standard drug AmB. Many reports suggest that lupeol is a non-toxic agent and causes no side-effects in animals up to the concentration of 2000 mg kg−1 (Siddique and Saleem, Reference Siddique and Saleem2011).
Methods
Parasite and culture maintenance
MHOM/IN/80/Dd8 strain of promastigotes of L. donovani was used and it was procured from the PGIMER, Chandigarh. Promastigotes were maintained in modified Novy, McNeal and Nicolle's (NNN) medium (Rao et al., Reference Rao, Mahajan and Ganguly1984) and RPMI-1640 medium at 22 + 1 °C in a B.O.D. incubator.
Evaluation of antipromastigote activity
Promastigotes of L. donovani were seeded in a 24-well plate (2 × 10⁶ cells mL−1) and incubated for 72 h with different concentrations of lupeol (10–100 µg mL−1) and AmB (0.1–1 µg mL−1) at 22 °C. A 0.01% of DMSO was taken as negative control. Further, the number of viable parasites was enumerated in Neubauer haemocytometer after staining with trypan blue dye. The mean percentage viability was computed as given below:
 $${\rm Percentage\;viability} = \displaystyle{{{\rm No}.{\rm \;of\;viable\;parasites\;in\;treated\;well}} \over {{\rm No}.{\rm \;of\;viable\;parasites\;in\;blank\;well}}} \times 100$$
 $${\rm Percentage\ growth\ inhibition} = {\rm} 100 -{\rm percentage\ viability}$$
The inhibitory concentration that reduced the parasite growth by 50% (IC50) was calculated by projecting percentage inhibition against concentrations of drug using software namely SPSS (Strober, Reference Strober2001).
Further to study the cell cycle of promastigotes, parasites (1 × 10⁶ mL−1) were treated with the IC50 value of lupeol and AmB at 22 °C for 72 h. These cells were fixed with chilled 70% ethanol and kept for 1 h at 4 °C. The cells were washed with PBS and then incubated with RNase (200 µg mL−1) for 1 h. Further, these cells were incubated with propidium iodide (PI, 50 µg mL−1) dye for 20 min in the absence of light at 37 °C. Sample acquisition and analysis was done by using CellQuest software of BD FACSCalibur and PI was measured in the PE channel (Zakraoui et al., Reference Zakraoui, Marcinkiewicz, Aloui, Othman, Grepin, Haoues, Essafi, Srairi-Abid, Gasmi, Karoui and Pages2017).
Cytotoxicity assay on human macrophages
PMA (phorbol-12-myristate-13-acetate) induced human THP-1 macrophages in RPMI 1640 medium in 96-well plate were incubated with various concentrations of lupeol or AmB (20–1000 µg mL−1) in a CO2 incubator. MTT (1 mg mL−1) was added into each well followed by incubation of 3–4 h. Then formazan crystals were solubilized with 100 µL of DMSO and optical density was read at 550 nm. The cell viability was monitored on the basis of optical density of the untreated, treated samples and blank wells using probit analysis on SPSS software (Das et al., Reference Das, Roy, Dutta and Majumder2008). Selectivity index was computed as the ratio between the activity of the drug against macrophages and parasites (CC50/IC50).
Design of experiment
Promastigotes (1 × 10⁷) of L. donovani were injected into the lateral tail vein of inbred BALB/c mice. After 30 days of infection, treatment was commenced. The experiment consisted of six groups and each group consisted of six animals: A – uninfected control; B – untreated infected animals; C – standard suspension vehicle; D, E – treatment of infected animals with lupeol, orally at two concentrations (25 and 50 mg kg−1 b.wt.) for 14 days; F – infected mice administered intraperitonally with AmB (2.5 mg kg−1 b.wt.) for 5 days served as positive control. All the animals were euthanized on 14th p.t.d.
qPCR for determination of parasite load
DNA was extracted from the spleen (25 mg) using phenol-CHCl3 extraction procedure as stated by Sambrook et al. (Reference Sambrook, Fritsch and Maniatis1989) with some alterations in the concentration of lysis buffer (10 mm Tris HCl, 0.5 mm EDTA, 20 mg mL−1 proteinase K and 5% SDS). Similarly DNA was purified from the promastigotes of L. donovani (1 × 10¹⁰ cells mL−1) to plot the calibration curve (up to 10-fold serial dilutions). The L. donovani microsatellite forward primer 5′-ACACGCAGAGAACTCGGTTT-3′ and the reverse primer 5′-TGGAGCGAGAAAGGACAAGT-3′ (accession number – FJ263505.1) of 229 bp were used. qPCR was carried out on LightCycler® 480 system (Roche) and 20 µL reaction mix was formulated by 1 µL (150 ng) of DNA, 10 µL of 2X SYBR Green (Thermo), a mixture of forward and reverse primers (1 µL, 10 µ m) and PCR grade water (8 µL). The conditions used in thermal cycler were: the first step at 95 °C (5 min), then 35 cycles at 94 °C (10 s), 58 °C (20 s) and 72 °C (30 s). Each run comprised at least one run with PCR grade water as negative control. The melting curve was attained at 65–97 °C to check the amplified product without dimers (Hossain et al., Reference Hossain, Ghosh, Khan, Duthie, Vallur, Picone, Howard, Reed and Mondal2017).
Assessment of delayed-type hypersensitivity responses
Immune status was monitored in various groups of animals by delayed-type hypersensitivity (DTH) response. The right footpad was challenged subcutaneously with phenol (0.5% in phosphate-buffered saline) killed promastigotes (leishmanin 40 µL, 2 × 10⁸ promastigotes mL−1) and left footpad was injected with PBS. The thickness of both footpads was measured with Vernier caliper after 48 h. Results were interpreted as an enhancement in the thickness of right footpad as compared to left footpad of animals in millimetres (Banerjee et al., Reference Banerjee, De and Ali2008).
Flow cytometric immunophenotypic analysis
Spleens were taken from all the groups of animals on scheduled time point and homogenized in cell strainer. The cell suspension was then incubated with 1% NH4Cl for lysis of erythrocytes for 20 min followed by centrifugation (3000 rpm for 5 min, 4 °C). The obtained pellet of splenocytes was washed two times with PBS. Then this suspension of splenocytes was adjusted to a concentration of 1 × 10⁶ cells per sample and labelled with monoclonal anti-CD3-PE, anti-CD4-FITC, anti-CD8-APC antibodies for 15–20 min at 4 °C. The splenocytes were then suspended in 200 µL PBS and captured on DIVA software of FACSCalibur (Gupta et al., Reference Gupta, Khajuria, Singh, Bedi, Satti, Dutt, Suri, Suri and Qazi2006).
Estimation of cytokine profile
Various cytokines such as Th1 (TNF-α, IL-17, IL-12, IFN-γ) and Th2 (IL-4, IL-10) were checked in the sera by sandwich enzyme-linked immunosorbent assay using kits (ELISA; Diaclone, France) according to the guidelines of the manufacturer.
Measurement of ROS and NO production
In all the experimental groups, the levels of NO were assessed by Griess assay. The spleen was homogenized (10% w/v) in 0.1 m PBS (pH 7.4) followed by centrifugation (10, 000 g at 4 °C) for 15–20 min and the supernatants were obtained. In 96-well plate, an equal volume (50 µL) of the supernatant and Griess reagent (0.1% of naphthyl ethylenediamine dihydrochloride in orthophosphoric acid and 1% sulfanilamide) was dispensed and kept at 37 °C for 10 min. The concentration of NO was measured at 550 nm on ELISA reader. Different concentrations of sodium nitrite (1.56–100 µ m) were used for the preparation of a standard curve with the same protocol as described earlier and the amount of NO formed in various groups was calculated from this standard curve.
ROS production was monitored by cell permeant 2′.7′-dichlorofluorescein diacetate (H2DCFDA) dye (Sigma, USA). Spleen from various groups of animals was homogenized and single-cell suspensions were prepared. Then these cells (1 × 10⁶ cells mL−1) were incubated with H2DCFDA dye (10 µ m) in a conventional incubator (37 °C, 5% CO2) for 25–30 min in dark. After washing the cells with PBS, these were taken up in PBS into 96-well plate and fluorometric measurements were done immediately at 485 nm of excitation and 535 nm of emission wavelength, respectively (Paik et al., Reference Paik, Das, Naskar, Pramanik and Chakraborti2016). Fold change in ROS production was calculated by the following equation:
 $$\hbox{Fold Change} = \,\displaystyle{{\hbox{fluorescent intensity of treated group} - \hbox{fluorescent intensity of uninfected group}} \over {\hbox{fluorescent intensity of uninfected group}}}$$
Evaluation of in vivo toxicity
Hepatic enzymes and renal function markers were estimated in the sera of all groups by measuring serum glutamic pyruvic transaminase (SGPT), lactate dehydrogenase (LDH), serum glutamic oxaloacetic transaminase (SGOT), uric acid, urea, blood urea nitrogen (BUN) and creatinine according to the protocol of manufacturer (Thermo Fischer Scientific. kits, India).
Further for histological analysis, liver and kidney tissues were taken out from all groups of mice and fixation of the tissues was commenced in Bouin's solution for 24 h. Then embedding of tissues was carried out in paraffin blocks followed by the cutting of sections with a microtome and the stretching of sections was carried out in hot water on albumin-coated slides. Further haematoxylin and eosin (H&E) dye was used to stain these slides and observed in the light microscope (Pearse, Reference Pearse1968).
Gene expression
Tri reagent (Sigma, USA) was used for the isolation of RNA from the spleen and RNA (5 µg) was reverse transcribed into cDNA by using a cDNA synthesis kit (Thermo Scientific, Lithuania). RT-qPCR was used to determine the expression of iNOS and NFκB genes. The primers used for this study were as follows: β-actin: forward primer: GCATTGCTGACAGGATGCAG, reverse primer: CCTGCTTGCTGATCCACATC; NFκB: forward primer: CTGGTGGACACATACAGGAAGAC, reverse primer: ATAGGCACTGTCTTCTTTCACCTC (annealing temperature: 57 °C); iNOS: forward primer: GATCCGATTTAGAGTCTTGGTG, reverse primer: TCCCTGGCTAGTGCTTCAG (annealing temperature: 60 °C) (accession numbers – NM_007393.5; NM_019408; NM_001313922.1 of β-actin, NFκB and iNOS, respectively). Total reaction mixture (20 µL) was comprised of cDNA (1 µL), 1 µL of a blend of forward and reverse primers (10 µ m), 10 µL of 2X SYBR green master mix and molecular grade water (8 µL). The thermal conditions followed in this experiment have been already described before. The reference gene used for this study was β-actin and the relative expression of the gene was estimated by the 2−ΔΔCT method (Livak and Schmittgen, Reference Livak and Schmittgen2001).
Statistical analysis
All the experiments were assessed in triplicate and results were presented as means ± s.e. (standard error). The differences between the groups were examined using Tukey test of one-way analysis of variance (ANOVA) and the differences were statistically significant at P < 0.05.
Results
In vitro leishmanicidal and cytotoxic activity
In vitro efficacy of lupeol against L. donovani promastigotes was assessed by trypan blue staining. Lupeol revealed potent in vitro efficacy with an IC50 value of 25.49 ± 2.5 µg mL−1 at 72 h (Fig. 1). However, AmB showed highest antileishmanial activity with an inhibitory concentration of 0.055 ± 0.003 µg mL−1. The solvent DMSO (0.01%) did not affect the viability of parasites. Further the cell cycle analysis of promastigotes after incubation with lupeol or AmB at the IC50 concentration was performed to assess the cells in the sub-G0/G1 phase as cells in this phase indicate the degradation of DNA and apoptosis of the cells. The population of promastigotes in this phase was significantly (P < 0.05) increased (39.23%) upon treatment with lupeol as compared to untreated controls (8.73%). However, the population of promastigotes in sub-G0/G1 was 53.56 ± 2.4% upon treatment with AmB. This finding clearly indicated that lupeol induced cell cycle arrest at the sub-G0/G1 phase (Fig. 2).
Estimation of antipromastigote activity by trypan blue dye exclusion assay. The inhibitory concentration that reduced the parasite growth by 50% (IC50) was calculated by projecting percentage inhibition against different concentrations of the drug.

Determination of sub G0/G1 population. Untreated or treated with IC50 concentration of lupeol and AmB were processed for cell cycle studies. Histograms represent the sub G0/G1 population in P3. (a) Untreated control, (b) AmB-treated, (c) Lupeol-treated, (d) graphical representation of the percentage of promastigotes in the sub G0/G1 phase of the cell cycle. Results were interpreted by mean ± s.e. and a significant difference was tested by one-way ANOVA. *P < 0.05: untreated control vs AmB/Lupeol treated; £P < 0.05: AmB vs Lupeol treated.

The cytotoxic potential of lupeol and AmB was determined by measuring oxidoreductase activity in human macrophage cell line THP1. Lupeol showed less cytotoxicity with a CC50 value of 960.04 ± 27.64 µg mL−1 in comparison to AmB (27.73 ± 0.1 µg mL−1) at 72 h. Moreover, the selectivity index of lupeol and AmB was found to be more than 10.
In vivo therapeutic potential of lupeol against L. donovani
Parasite burden was quantified in target organ spleen, in different groups of animals at 14th p.t.d. by qPCR. It was significantly (P < 0.05) found to decrease in lupeol (25 and 50 mg kg−1 b.wt.) and AmB-treated animals as compared to infected controls. Infected mice treated with a higher dose of lupeol caused marked (P < 0.05) reduction of parasites than the lower dose. Mice infected with L. donovani receiving lupeol at 25 and 50 mg kg−1 b.wt. caused 87.26 ± 0.95 and 97.75 ± 0.18% parasite reduction, respectively, while 98.16 ± 0.14% parasite reduction was detected in AmB-treated animals. However, a higher dosage of lupeol led to equivalent reduction (P > 0.05) in parasite burden in infected mice as was observed in AmB-treated infected mice. Vehicle suspension-treated infected animals revealed the same parasite burden as observed in only infected controls (Fig. 3).
Quantification of parasite load in different groups of animals. (a) Standard curve was prepared from the in vitro grown promastigotes of L. donovani. (b) Bar graph depicts the parasite burden in the spleen of various groups. Results are interpreted by mean ± s.e. and significant difference was tested by one-way ANOVA.*P < 0.05: Infected control vs Infected + AmB/Infected + Lupeol 25 mg kg−1/Infected + Lupeol 50 mg kg−1 b.wt.; #P < 0.05: Infected + Lupeol 25 mg kg−1 vs Infected + Lupeol 50 mg kg−1; £P < 0.05: Infected + AmB vs Infected + Lupeol 25 mg kg−1; ¥P > 0.05: Infected + AmB vs Infected + Lupeol 50 mg kg−1.

Immune response
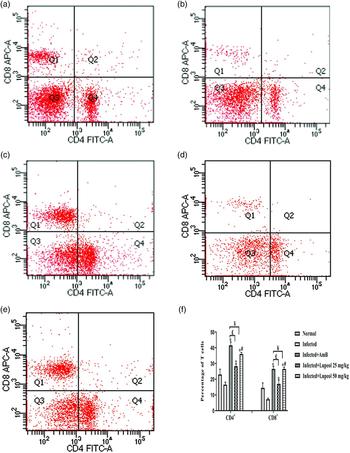
Induction of DTH response is a symbol of cell-mediated immunity against leishmaniasis. Infected mice treated with lupeol at both doses and AmB exhibited a significant (P < 0.05) enhancement in footpad thickness as compared to infected control mice. DTH response was significantly (P < 0.05) more in infected animals treated with a higher dose of lupeol as compared to those treated with the lower dose (Fig. 4). Moreover, no significant difference (P > 0.05) was noticed in DTH response in infected mice after treatment of a higher dose of lupeol and AmB. To further verify the induction of cell-mediated immune response, the population of CD4+ and CD8+ T cells was monitored in the spleen of different groups of animals by flow cytometry. The percentage of CD4+ and CD8+ T cells was significantly (P < 0.05) found to be enhanced in the lupeol (25 and 50 mg kg−1 b.wt.) and AmB-treated infected animals in comparison to untreated infected controls. The phenotypic analysis indicated that the infected mice receiving lupeol at 50 mg kg−1 b.wt. exhibited significantly (P < 0.05) higher population of these cells than lupeol at 25 mg kg−1 b.wt. (Fig. 5). Treatment of infected mice with lupeol at higher dose showed a similar increase (P > 0.05) in the percentage of CD4+ and CD8+ T cells as observed after administration of AmB.
Delayed type hypersensitivity response to leishmanial antigen. Footpad swelling (millimetre) was examined by measuring the difference between the right footpad (leishmanin) and left footpad (PBS) after 48 h. Results are interpreted as mean ± s.e. for six animals per group and the difference between means for statistical significance was checked by one-way ANOVA using Tukey's test. *P < 0.05: Infected control vs Infected + AmB/Infected + Lupeol 25 mg kg−1/Infected + Lupeol 50 mg kg−1 b.wt.; #P < 0.05: Infected + Lupeol 25 mg kg−1/Infected + Lupeol 50 mg kg−1 b.wt.; £P < 0.05: Infected + AmB vs Infected + Lupeol 25 mg kg−1; ¥P > 0.05: Infected + AmB vs Infected + Lupeol 50 mg kg−1.

Quantification of CD4+ and CD8+ T cells in different groups of animals by flow cytometry. Splenocytes were labelled with anti-CD4+ FITC and anti-CD8+ APC antibodies as explained in methodology. Dot plots represent the percentage of CD4+ and CD8+ T cells in different groups of animals. (a) Uninfected mice. (b) Infected mice. (c) Infected + AmB treated mice. (d) Infected + Lupeol 25 mg kg−1 treated mice. (e) Infected + Lupeol 50 mg kg−1 treated mice. (f) Bar graph is showing the mean percentage population of CD4+ and CD8+ T cells in different groups. Results are representing the mean ± s.e. and significance was analysed by ANOVA with Tukey's test. *P < 0.05: Infected control vs Infected + AmB/Infected + Lupeol 25 mg kg−1/Infected + Lupeol 50 mg kg−1 b.wt.; #P < 0.05:Infected + Lupeol 25 mg kg−1 vs Infected + Lupeol 50 mg kg−1 b.wt.; £P < 0.05: Infected + AmB vs Infected + Lupeol 25 mg kg−1; ¥P > 0.05: Infected + AmB vs Infected + Lupeol 50 mg kg−1.

The concentration of Th1 (IL-12, TNF-α, IFN-γ, IL-17) and Th2 (IL-4, IL-10) cytokines were measured in the serum by sandwich ELISA. The animals showed exhaustion of immune response in terms of decreased concentration of protective cytokines of Th1 type and increased levels of disease-promoting, Th2 cytokines. AmB and lupeol (at both doses) treatment significantly (P < 0.05) increased the Th1 cytokines (Fig. 6) and decreased the levels of Th2 cytokines as compared to infected controls. However, no significant difference (P > 0.05) was observed in the levels of Th2 cytokines after treatment of infected mice with a higher dose of lupeol as compared to the lower dose (Fig. 7). Treatment of lupeol (50 mg kg−1 b.wt.) and AmB in infected mice displayed almost equal increase (P > 0.05) in the levels of Th1 cytokines (IL-12, TNF-α, IFN-γ). However, AmB-treated infected mice revealed significant (P < 0.05) higher concentration of IL-17 in comparison to lupeol-treated infected mice. In the case of Th2 cytokines also, lupeol (50 mg kg−1 b.wt.) as well as AmB treatment led to a comparable decrease in the levels of IL-4 and IL-10 in the sera of infected mice.
Determination of Th1 cytokine levels in serum of various groups of animals by sandwich ELISA assay (Diaclone kit). (a) IL-12, (b) TNF-α, (c) IFN-γ and (d) IL-17. Data are expressed as mean±s.e. and a significant difference was examined by one-way ANOVA using Tukey's test. *P < 0.05: Infected control vs Infected + AmB/Infected + Lupeol 25 mg kg−1/Infected + Lupeol 50 mg kg−1 b.wt.; #P < 0.05: Infected + Lupeol 25 mg kg−1 vs Infected + Lupeol 50 mg kg−1 b.wt.; £P < 0.05: Infected + AmB vs Infected + Lupeol 25 mg kg−1 and 50 mg kg−1; ¥P > 0.05: Infected + AmB vs Infected + Lupeol 50 mg kg−1.

Determination of Th2 cytokine levels in serum of various groups of animals. (a) IL-10 and (b) IL-4. Data are expressed as mean ± s.e. and a significant difference was examined by one-way ANOVA using Tukey's test. *P < 0.05: Infected control vs Infected + AmB/Infected + Lupeol 25 mg kg−1/Infected + Lupeol 50 mg kg−1 b.wt.; $P > 0.05: Infected + Lupeol 25 mg kg−1 vs Infected + Lupeol 50 mg kg−1 b.wt.; £P < 0.05: Infected + AmB vs Infected + Lupeol 25 mg kg−1; ¥P > 0.05: Infected + AmB vs Infected + Lupeol 50 mg kg−1.

NO and ROS are the macrophage-derived oxidative molecules which are important for the termination of growth of parasites. Treatment of infected mice with lupeol at higher dosage induced significant (P < 0.05) enhancement (8.40 ± 0.30 µ m) in the levels of NO in splenocytes than the only infected controls (2.17 ± 0.81 µ m). Higher levels (17.75 ± 1.52 µ m) of NO were also detected in AmB-treated infected mice. Similarly a 1.5-fold change in the levels of ROS production (P < 0.05) was observed in splenocytes of infected mice after lupeol treatment in contrast to only infected controls where low levels of ROS (0.74-fold) were found. Treatment of infected mice with AmB revealed maximum fold change (2.7-fold) in the levels of ROS generation (Fig. 8).
Detection of NO (a) and ROS (b) production in splenocytes of various groups of animals by staining with Griess reagent and H2DCFDA dye. ROS was calculated in terms of fold change between uninfected control and treated groups. Data are presented as mean ± s.e. and a significant difference was checked by ANOVA using Tukey's test. *P < 0.05: Infected control vs Infected + AmB/Infected + Lupeol 50 mg kg−1 b.wt.; £P < 0.05: Infected + AmB vs Infected + Lupeol 50 mg kg−1.

Toxicity profile
The safety potential of all the treatment groups was checked by monitoring the levels of hepatic enzymes and renal function markers in the serum. The levels of SGPT, SGOT, and LDH were observed to be increased in untreated infected control animals. In AmB- and lupeol-treated infected mice, these enzymes reverted to the normal levels depicting no side-effects of these treatments on the functioning of the liver (Table 1). However, the LDH value was still significantly lower in lupeol-treated infected mice as compared to AmB-treated. Among the kidney function markers, uric acid, creatinine, urea and BUN levels were all measured above the normal range in untreated infected control animals. Treatment of lupeol in infected animals showed normal levels of renal function markers. In addition, these metabolites were found above the normal limits in infected mice treated with AmB. The findings depicted that AmB was injurious to kidneys and lupeol had no renal toxicities (Table 2).
Determination of serum hepatic enzymes in various groups of animals

Data were represented by mean±s.e. of hepatic enzymes which were computed by using commercial kits and a significant difference was measured by one-way ANOVA.
Normal range: SGOT: 10–35 U/L, SGPT: 0–38 U/L and LDH: 114–240 IU/L.
a P < 0.05: Infected + AmB vs Infected + Lupeol 25 and 50 mg kg−1.
b P > 0.05: Infected + AmB vs Infected + Lupeol 25 and 50 mg kg−1.
Determination of serum renal function markers in various groups of animals

Renal function markers were represented by mean ± s.e. and measured by using commercial kits.
Normal range: urea: 10–45 mg dL−1, creatinine: 0–1.4 mg dL−1, BUN: 5–21 mg dL−1 and uric acid: 2.6–7.0 mg dL−1.
The significant difference was checked by one-way ANOVA.
a P < 0.05: Infected + AmB vs Infected + Lupeol 25 and 50 mg kg−1.
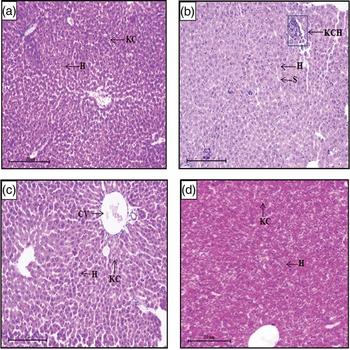
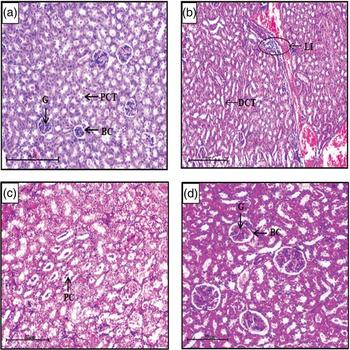
Further, the histological alterations in liver and kidney were estimated by H&E staining. The cross-section of a liver of infected mice exhibited Kupffer cell hyperplasia as compared to uninfected mice which revealed normal anatomical architecture. In all the treated groups, a normal histological architecture of the liver was observed as in the uninfected controls (Fig. 9). In the cross-section of the kidney of infected animals, lymphocytic infiltration was found which depicts the focal interstitial nephritis. Moreover, mild tubular disruption and casting of proteins were detected in the infected animals upon treatment with AmB. However, no such aberrations were found in the histological renal section of infected animals after treatment with lupeol (Fig. 10).
Histological studies of the liver of various groups of animals. (a) Uninfected mice. (b) Infected mice. (c) Infected + AmB treated mice. (d) Infected + Lupeol treated mice. The histological pattern of the liver was normal in uninfected, AmB and lupeol treated mice (a, c and d). Hyperplasia of Kupffer cells was found in infected mice (b) (H&E staining, 100X, scale bar: 50 µm). Abbreviations: S, sinusoids; H, hepatocytes; KC, Kupffer cell; CV, central vein; KCH, Kupffer cell hyperplasia.

Transverse sections of the kidney of different groups of animals. (a) Uninfected mice. (b) Infected mice. (c) Infected + AmB treated mice. (d) Infected + Lupeol treated mice. The renal morphology was found to be normal in lupeol-treated mice (d). Lymphocytic infiltration and some protein casts with mild damage to tubules were observed in infected mice (b) and in AmB-treated mice (c), respectively (H&E staining, 100X, scale bar: 50 µm). Abbreviations: BC, Bowman's capsule; G, glomerulus; PCT, proximal convoluted tubule; DCT, distal convoluted tubule; circle, lymphocytic infiltration; PC, protein cast.

Effect of lupeol on NFκB and iNOS mRNA expression
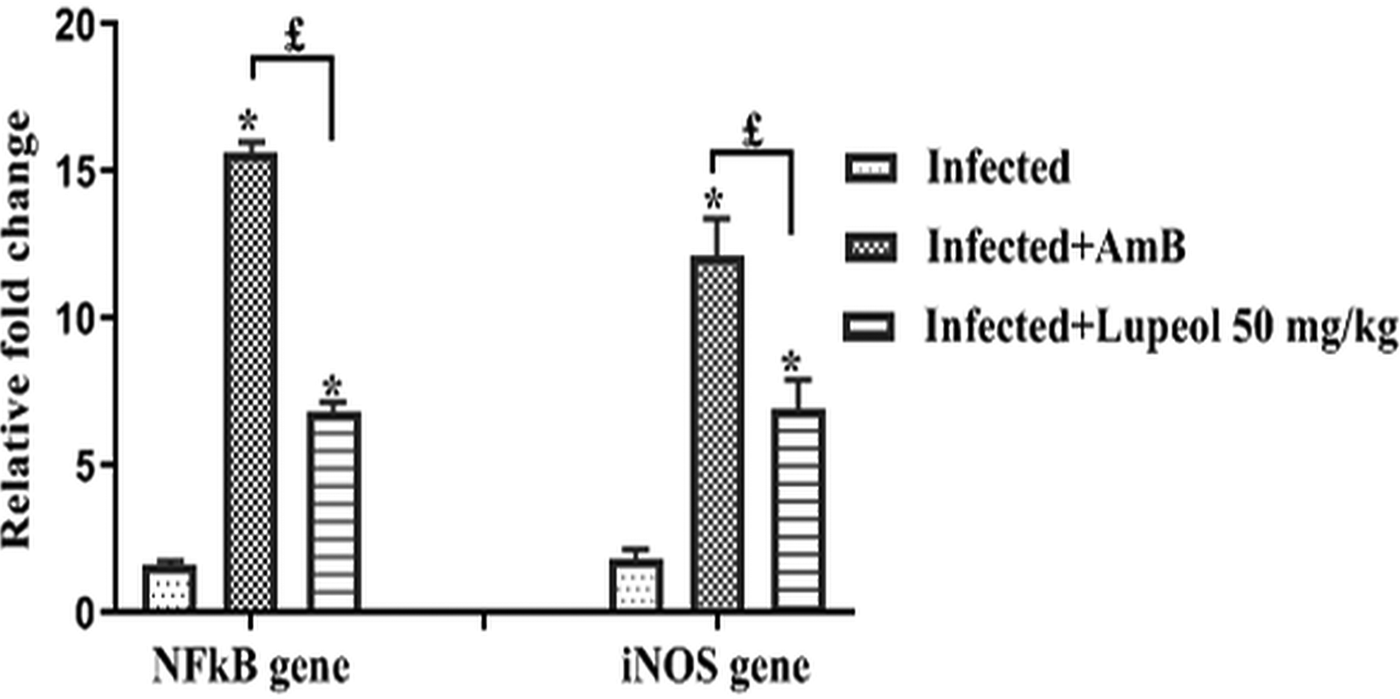
Further the effect of lupeol was monitored on the NFκB and iNOS gene expression in the target tissue, spleen by reverse transcriptase qPCR. Treatment of infected mice with lupeol showed a significant (P < 0.05) upregulation (6.82-fold) in NFκB when compared to only infected animals (1.6-fold). Moreover, treatment with lupeol also caused remarkable (P < 0.05) elevation (6.9-fold) in the expression of iNOS in contrary to infected untreated controls (1.84-fold). However, treatment with AmB in the infected mice exhibited maximum fold change in the expression of NFκB (15.64-fold) and iNOS (12.16-fold) in contrast to lupeol-treated mice (Fig. 11).
Quantification of NFκB and iNOS in splenocytes of various groups of animals by reverse transcriptase qPCR. The relative fold change in mRNA expression of iNOS and NFκB was calculated relative to the β-actin (housekeeping gene). One -way ANOVA test was used to check the significant difference. *P < 0.05: Infected control vs Infected + AmB/Infected + Lupeol 50 mg kg−1 b.wt.; £P < 0.05: Infected + AmB vs Infected + Lupeol 50 mg kg−1.
Discussion
The available chemotherapeutic drugs are in the appalling state as the treatment options are inadequate because of their adverse effects, development of resistance and high cost. The drugs can be administered either parenterally or via an oral route. However, the latter method of administration is relatively safer and more convenient to treat patients not only at the level of the community but during the times of epidemics also (Turner et al., Reference Turner, Brabb, Pekow and Vasbinder2011). One of the lacunae related to the conventional antileishmanial drugs like sodium stibogluconate, AmB, pentamidine and paromomycin is their parenteral administration. This has complicated the treatment options as it can lead to thrombosis, severe hypersensitivity reactions and other secondary infections at the site of injection (Bruce and Wong, Reference Bruce and Wong2001; Perez-Victoria et al., Reference Pérez-Victoria, Bavchvarov, Torrecillas, Martínez-García, López-Martín, Campillo, Castanys and Gamarro2011).
Lupeol is pharmacologically active in treating the number of diseases in animal models irrespective of routes of administration viz. oral, topical, intravenous and intra-peritoneal (Sankaran and Jayasri, Reference Sankaran and Jayasri2017). In the study of Sunitha et al. (Reference Sunitha, Nagaraj and Varalakshmi2001), treatment of lupeol (orally; 150 mg kg−1 b.wt.) protected the liver of rats from the toxicity of cadmium. In another study by Manoharan et al. (Reference Manoharan, Palanimuthu, Baskaran and Silvan2012), oral administration of lupeol at 50 mg kg−1 b.wt. decreased the volume and burden of tumour in hamsters treated with 7,12-dimethylbenz[a]anthracene. Thus, it is essential to find novel antileishmanial compounds which exhibit potent immunomodulatory property. In the current investigation, we evaluated the protective efficacy of lupeol against experimental murine VL and also evaluated its safety profile in comparison to the standard drug, AmB. Lupeol is an effective immunomodulatory triterpenoid found in various medicinal plants such as Bauhinia variegata, Euphorbia resinifera and Sterculia villosa. It is used as a therapeutic and preventive agent for a wide array of diseases as it possesses many pharmacological effects such as anticancer and antimicrobial activities (Wal et al., Reference Wal, Srivastava, Wal, Rai and Sharma2015).
In the in vitro studies, we found that lupeol was effective against promastigotes of L. donovani but it showed a negligible cytotoxic effect against human macrophage cell line THP1. Thus lupeol possesses good biological potential against leishmaniasis as depicted by its SI ⩾ 10 which describes that lupeol is more active against the pathogen and does not show any toxic effects on normal cells (Nagle et al., Reference Nagle, Khare, Kumar, Supek, Buchynskyy, Mathison, Chennamaneni, Pendem, Buckner, Gelb and Molteni2014). In contrast to lupeol, the CC50 value of AmB against mammalian macrophages was found to be very less, i.e. only 27.73 µg mL−1. This depicted that lupeol is safer for human cells and can be used in in vivo models. Further, flow cytometric analysis revealed that lupeol arrested the promastigotes at sub G0/G1 phase of the cell cycle which is a hallmark of apoptosis. Many phytoconstituents such as zerumbone showed inhibition against promastigotes and induced arrest at sub G0/G1 phase of the cell cycle (Mukherjee et al., Reference Mukherjee, Singh, Dey, Mandal, Ghosh, Mallick, Hussain, Swapana, Ross and Pal2016). In vitro activity of lupeol prompted us to further examine its antileishmanial efficacy in the in vivo model.
Immunotherapeutic potential of lupeol against VL was appraised in inbred BALB/c mice. Lupeol at 50 mg kg−1 b.wt. was significantly (P < 0.05) effective in declining the splenic parasite load in infected animals as compared to the lower dose (25 mg kg−1 b.wt.). Similarly, Das et al. (Reference Das, Jawed, Das, Sandhu, De, Dinda, Akhter and Bhattacharjee2017) also described the reduction of parasite load in the spleen of infected mice after treatment of lupeol at 75 mg kg−1. In addition, our study also established that the efficacy of lupeol at 50 mg kg−1 b.wt. is comparable to AmB in reducing the splenic parasite burden on 14 p.t.d. Similarly, enhancement in the DTH response in mice was found to be significant (P < 0.05) at a higher dose in comparison to the lower dose of lupeol. Therefore, lupeol restored the protective immune responses and showed a remarkable reduction in parasite burden. Similar observation has been noticed in oleuropein-treated infected mice (Kyriazis et al., Reference Kyriazis, Koutsoni, Aligiannis, Karampetsou, Skaltsounis and Dotsika2016) where a decrease in the parasite load was accompanied by the increase in the DTH reaction.
During VL, the functioning of CD4+ and CD8+ T cells gets impaired (Tsagozis et al., Reference Tsagozis, Karagouni and Dotsika2003). Similarly in the current study too, the percentage of these cells was found to be suppressed in the untreated infected controls. CD8+ and CD4+ T cells have a crucial role in the effective control of leishmanial infection as these cells produce proinflammatory cytokines such as IFN-γ and TNF-α which activate the macrophages to release the oxidative radicals like NO to kill intracellular parasites. CD8+ T cells also possess cytotoxic potential against cells expressing Leishmania antigens (Tsagozis et al., Reference Tsagozis, Karagouni and Dotsika2003). In the present study, the percentage of CD4+ and CD8+ T cells was increased in the infected mice upon treatment with lupeol in contrast to only infected controls. The increment in the percentage of CD8+ and CD4+ T cells was more pronounced with a higher dose of lupeol than at the lower dose. Moreover, lupeol (50 mg kg−1 b.wt.) treatment was as effective as AmB in increasing the percentage of both T cells in infected mice. This immunopotentiating effect has also been seen in the treatment of astrakurkurone to BALB/c mice infected with L. donovani (Mallick et al., Reference Mallick, Dutta, Chaudhuri, Mukherjee, Dey, Halder, Ghosh, Mukherjee, Sultana, Biswas and Lai2016).
Switching of the immune response to Th1 or Th2 determines vulnerability or resistance towards Leishmania infections in mice (Oliveira et al., Reference Oliveira, Ribeiro, Schrieffer, Machado, Carvalho and Bacellar2014). Similarly in our study also, Th2 cytokines were found to be increased and the concentration of Th1 cytokines was observed to be suppressed in L. donovani-infected animals. Activation of the protective Th1 immune response leads to the secretion of many cytokines, especially IFN-γ and TNF-α. These cytokines further activate macrophages to enhance iNOS activity that in turn boosts up the generation of NO for the killing of the parasite (Salim et al., Reference Salim, Sershen and May2016). In the present investigation, the lupeol's ability to differentiate CD4+ T cells to protective Th1 immune response was analysed by investigating the levels of Th1 and Th2 cytokines. Lupeol treatment developed a protective immune response through the induction of Th1 cytokines and reduction of Th2 cytokines in serum. The elevation in the levels of Th1 cytokines after lupeol treatment at 50 mg kg−1 b.wt. was comparatively higher than that observed at 25 mg kg−1 b.wt. These findings were consistent with previous studies which demonstrated that lupeol enhanced the production of Th1 cytokines and suppressed the Th2 cytokines (Wu et al., Reference Wu, Liu, Lu, Chen, Zhou, Wang, Zhu and Fei2013; Das et al., Reference Das, Jawed, Das, Sandhu, De, Dinda, Akhter and Bhattacharjee2017). Moreover, our study also showed that lupeol at higher dose and AmB had equal potential in augmenting the Th1 cytokines and repression of Th2 cytokines in the infected mice. On the other hand, the study of Sanchez-Burgos et al. (Reference Sanchez-Burgos, Ramirez-Mares, Gallegos-Infante, Gonzalez-Laredo, Moreno-Jimenez, Chairez-Ramirez, Medina-Torres and Rocha-Guzman2015) is in contrary to our findings as this study has reported that lupeol could suppress the proinflammatory cytokines.
In view of the immunotherapeutic potential of lupeol against murine VL, toxicity studies were carried out by biochemical tests and histological studies. Lupeol-treated animals showed normal levels of liver enzymes and kidney function markers. Histological examination further verified that the lupeol treatment did not cause any injuries to the liver and kidneys. Conversely, AmB-treated infected mice resulted in the enhancement in the concentration of uric acid, creatinine, urea and BUN. In addition, AmB-treated infected mice also displayed protein casts and mild tubular disruption in kidneys. The nephrotoxic action of AmB has also been described in earlier studies (Jesus et al., Reference Jesus, Fragoso, Yamamoto, Laurenti, Silva, Ferreira, Lago, Gomes and Passero2017). Thus lupeol can be considered as a safe candidate for the treatment of VL.
NFκB plays a crucial role in the host defence to leishmanial infection and is essential for the proliferation of CD4+ T-cells and the generation of Th1 immune responses (Artis et al., Reference Artis, Speirs, Joyce, Goldschmidt, Caamano, Hunter and Scott2003). The current investigation has demonstrated that the lupeol modulates the iNOS and NFκB expression at the transcriptional level in the spleen. However, downregulation of the expression of these genes was observed in the untreated infected animals. The capacity of lupeol in increasing the expression of NFκB gene might be allied to its ability to augment the levels of T cells (CD4+) and proinflammatory cytokines. Furthermore, the enhanced iNOS expression could be attributed to the increased expression of NFκB gene due to lupeol treatment. It demonstrated the effect of lupeol at the transcriptional level. Similar induction of iNOS expression due to increment in the expression of NFκB after the treatment of cystatin was reported (Kar et al., Reference Kar, Ukil and Das2011). In the present study, the enhancement in the proinflammatory cytokines due to lupeol treatment might have led to the activation of iNOS. It is corroborated with the investigation of Horta et al. (Reference Horta, Mendes, Roma, Noronha, Macedo, Oliveira, Duarte and Vieira2012) which revealed that TNF-α and IFN-γ are directly involved in the induction of iNOS expression which further leads to the production of NO for the killing of the parasite. Moreover in the present study, NO was also raised in the splenocytes of infected animals treated with lupeol which is correlated with the reduction in parasite load. Likewise, Das et al. (Reference Das, Jawed, Das, Sandhu, De, Dinda, Akhter and Bhattacharjee2017) also demonstrated that lupeol treatment upregulated the expression of iNOS and consequently NO production in mice infected with L. donovani. The enhancement in the levels of NO might also be due to the activation of iNOS upon the treatment of infected mice with lupeol. In addition, lupeol treatment also resulted in ROS production which could be correlated with the reduction of parasite burden in infected mice. Similar findings were found in many studies in which the leishmanicidal activity of natural products was due to the augmentation of ROS and NO production (Rodrigues et al., Reference Rodrigues, Farias, Carvalho, Santos, do Nascimento and Silva2014).
Currently, the usage of phytomedicines has been enhanced due to less toxic effects and therapeutic effects in comparison to the allopathic medicines. However, plant compounds reveal limited pharmacological activity in in vivo models because of their less solubility and lipophilicity. This leads to meager absorption and thus an insufficient distribution of the drug in tissues. In the present day, new drug delivery carriers are being developed which can enhance the bioavailability of phytoconstituents. Various drug delivery systems such as liposomes, phytosomes and nanoparticles are known to increase the distribution of herbal components (Kesarwani and Gupta, Reference Kesarwani and Gupta2013). The combination of plant components in delivery systems helps in improving the stability and bioavailability. It also decreases degradation in metabolic processes which leads to more biological activity (Karimi et al., Reference Karimi, Ghanbarzadeh, Hamishehkar, Pezeshki, Mostafayi and Gholian2015). Therefore in the present study, the absence of a delivery system to enhance the effect of lupeol for treating leishmaniasis is a limiting factor.
In conclusion, our data indicated that lupeol treatment efficiently impeded the growth of the parasite in infected mice which was comparable to a conventional drug, AmB. Moreover, treatment of lupeol in infected mice did not exhibit any side-effects in human cells and in infected mice. Leishmanicidal effect of lupeol was associated with the induction of iNOS-mediated NO production. The induction of iNOS might be attributed to the increased expression of NFκB due to lupeol treatment. NFκB also caused the activation of CD4+ T cells and subsequently proinflammatory cytokines as a result of lupeol therapy which ultimately induced the NO and ROS production. Therefore lupeol boosted the immunity of host by the production of immunostimulatory molecules (Th1 cytokines) and leishmanicidal molecules (NO, ROS) for controlling the infection. So lupeol can serve as an active and safer agent against VL. Further studies of antileishmanial potential of lupeol should be carried in higher test models.
Author ORCIDs
Gurpreet Kaur, 0000-0002-4515-6709
Financial support
We are thankful to UGC-BSR [F.4-1/2006 (BSR)/7-150/2007 (BSR) dated 22.10.2013] and DST-PURSE of Panjab University for providing us the financial support.
Conflict of interest
None.
Ethical standards
Susceptible BALB/c mice of both sexes (inbred, weight 20–25 g), 6–8 weeks age were taken in the current study. The study was approved by the Institutional Animal Ethics Committee of the Panjab University, Chandigarh (PU/IAEC/S/14/139) which has the certification from the Committee for the purpose of control and supervision of experiments on animals (CPCSEA). Mice were provided with feed and water ad libitum and all assays were performed as per the accepted instructions of European Convention for the Protection of Vertebrate Animals used for Experimental and Other Scientific purposes.