Introduction
Water, energy and food serve as core resource elements in the survival of humans and their socio-economic development, while carbon emissions have also become a critical issue under climate change, including for the overall environment as well as international policy dynamics (Xie et al. Reference Xie, Feng and Zhao2024, Zhao et al. Reference Zhao, Li, Wang, Liu and Li2024). Energy-related carbon emissions are being subject to stricter regulations as the greenhouse effect gets stronger (Xiong Reference Xiong2022). Furthermore, the growth and development of crops and vegetation that serve as carbon sinks are significantly impacted by the unequal geographical distribution of water resources (Wang et al. Reference Wang, Hou and Zhou2021), which also creates barriers to the extraction and use of energy (Li et al. Reference Li, Wang and Wang2022b). In response to the global warming challenge created by high carbon emissions and energy consumption, President Xi Jinping declared at the 2020 United Nations General Assembly that China would strengthen its Nationally Determined Contributions and implement more vigorous policies and measures regarding climate change. China’s objective is to reach peak carbon dioxide emissions before 2030 and attain carbon neutrality by 2060, a target commonly known as China’s ‘dual carbon’ goals (Xi Reference Xi2020). The three north-eastern provinces of China represent a major grain production base, an energy supply hub and a vital industrial area. However, with rapid economic development and continuous human population growth, the region is increasingly facing prominent issues concerning water resources, energy, food security and carbon emissions. Coordinating the interrelationships among these four elements to reinforce resource security and promote regional sustainable development has become an urgent task for Northeast China (Li et al. Reference Li, Cao, Fan, Wang, Zhou and Ren2023a). This also represents a crucial component of China’s efforts to tackle resource and environmental challenges and to realize the United Nations Sustainable Development Goals (SDGs; Yuan et al. Reference Yuan, Cheng, He and Xu2024, Sun & Wang Reference Sun and Wang2025).
The water–energy–carbon (WEC) system, first proposed by Aldrin and Bills in 1997, combines several components, including energy, carbon emissions and water resources, into a comprehensive, multi-level and holistic coupled system. The ‘Water–Energy–Food (WEF) Nexus for System Security’ (Hoff Reference Hoff2011) research framework was later systematically articulated at the Bonn Conference in Germany. This marked a change in academic focus from dual-element security relationships (Hao et al. Reference Hao, Sun and Song2021) to investigating the intricately intertwined security dynamics among food, energy and water (Sun & Yan Reference Sun and Yan2018, Wang et al. Reference Wang, Pu, Yan and Sun2020, Chen et al. Reference Chen, Zhou and Han2023). The water–energy–food–carbon (WEFC) system was developed within the framework of global carbon-neutrality targets to guarantee a sufficient supply of resources while reducing carbon emissions in order to support safe and sustainable regional economic growth (Liu et al. Reference Liu, Liu, Zhu and He2024). Current research on water resources, energy, food and carbon emissions largely concentrates on pairwise or tripartite interactions, employing methods such as data envelopment analysis, life-cycle assessment, system dynamics, pressure–state–response and coupling coordination degree models (Liu et al. Reference Liu, Wang, Liu, Sun and Fang2020, Sun et al. Reference Sun, Zhou and Zhao2021, Hao & Sun Reference Hao and Sun2022, Wang & Fang Reference Wang and Fang2023a) to investigate internal mechanisms, evaluate interlinkages, assess output efficiency and optimize resource allocation. While progress has been made in security evaluations of individual resources (Yao et al. Reference Yao, Teng and Huang2015, Wang & Fang Reference Wang and Fang2023a, Reference Wang and Fang2023b, Lin & Zhao Reference Lin and Zhao2025), most studies treat these elements in isolation and overlook their interdependencies. Moreover, multi-factor system security evaluations are largely conducted at national or river basin scales, lacking in-depth analysis of localized regions such as Northeast China. We set up a WEFC system security evaluation index model to assess and analyse Northeast China’s WEFC system security from 2013 to 2022.
Water resources, energy, food and carbon are interconnected yet relatively independent elements (Appendix S1 Fig. S1). Water resources are considered a key indicator for assessing a country’s level of economic development (Fang et al. Reference Fang, Song, Li, Lei, Song and Yuan2025). Food security, as the strategic cornerstone of national security, is closely associated with the national economy, public welfare and societal stability (Yin et al. Reference Yin, Yang and Kong2025). The domain of energy security, however, faces multiple challenges. The characteristics of China’s resource endowment include that it is coal-rich, oil-poor and gas-scarce, while total energy consumption continues to rise and carbon emissions remain substantial. Furthermore, the relatively tight timeline from peak carbon to carbon neutrality has made energy supply security increasingly critical (Yan et al. Reference Yan, Yan and Liu2025). Within the WEFC system, water resources directly affect the growth and development of food crops while also exerting an indirect effect on energy consumption and carbon emissions through processes such as crop irrigation and industrial operations. Energy, as the driving force of economic growth, generates substantial carbon emissions during its extraction, processing and utilization. In food production, the use of fertilizers and pesticides and the advancement of agricultural mechanization also directly or indirectly contribute to carbon emissions. In addition, the stability and security of food supplies are closely linked to the sustainability of both energy consumption and water resource management. Carbon emissions, as a key metric for assessing the climate impact of regional economic activity, directly affect the safety status and future trajectory of water, energy and food systems. Therefore, any fluctuation in one component of the WEFC system may trigger a cascade across the other three. Changes among these four interconnected elements collectively impact water security, energy security, food security, carbon security and, ultimately, the overall security of the socio-economic system.
This paper builds a comprehensive security evaluation index model of the WEFC system and assesses the security of the WEFC system in Northeast China from 2013 to 2022. The coupling coordination degree of the WEFC system in Northeast China from 2023 to 2030 is also predicted through a coupling coordination degree model and a deep-learning long short-term memory (LSTM) model, and the impact of the current development model on achieving the peak carbon goal in 2030 is explored. The aim is to provide a basis for Northeast China to optimize its resource utilization structure and achieve coordinated and safe development among these four types of resources and to realize the ‘dual carbon’ goals as soon as possible.
Methods
Data sources and standardization
Northeast China includes three provinces: Heilongjiang, Jilin and Liaoning. The research period was 2013–2022. The original dataset included total water resources, energy production and consumption, grain output, carbon emissions and absorption, as well as related socio-economic data such as human population and gross domestic product (GDP). The China Water Resources Bulletin (n.d.), China Water Resources Statistical Yearbook (n.d.) and China Environmental Statistical Yearbook (n.d.) were the sources of information on total water resources. Data on energy output and consumption came from the China Industrial Statistical Yearbook (n.d.) and the China Energy Statistical Yearbook (n.d.). The China Land and Resources Statistical Yearbook (n.d.), China Statistical Yearbook (n.d.) and China Rural Statistical Yearbook (n.d.) were the sources of the grain output statistics. Data on carbon emissions and absorption were taken from the IPCC Guidelines (IPCC n.d.), the China Energy Statistical Yearbook (n.d.) and the China Emission Accounts and Datasets (n.d.). Additional data such as human population and GDP were acquired from the China Macroeconomic Database (n.d.), the National Bureau of Statistics (n.d.), provincial statistical yearbooks and the EPS database (n.d.). Missing data were supplemented by employing linear interpolation methods to ensure data completeness.
An efficacy coefficient method was employed to calibrate the raw data. Indicators were divided into positive and negative types according to their efficacy, utilizing Equations 1 & 2:
 ${\rm{For}}\;{\rm{positive}}\;{\rm{indicators}}:{X'_{ij}} = {{{X_{ij}} - \min {X_{ij}}} \over {\max {X_{ij}} - \min {X_{ij}}}} + 0.0001$
 ${\rm{For}}\;{\rm{negative}}\;{\rm{indicators}}:{X'_{ij}} = {{\max {X_{ij}} - {X_{ij}}} \over {\max {X_{ij}} - \min {X_{ij}}}} + 0.0001$
where
 $X_{ij}^{}$
denotes the initial magnitude of the jth indicator for the ith sample, X
’
ij
is the standardized index value, max X
’
ij
denotes the largest value of the jth indicator and min X
’
ij
represents the smallest value of the jth indicator.
Comprehensive security evaluation index model
The security evaluation indices of each subsystem were combined using a linear weighting technique. The comprehensive safety index covered the interval from 0 to 1, where larger values corresponded to a stronger safety level, whereas smaller values reflected a weaker safety level. The safety evaluation index was divided into five levels at intervals of 0.2: extremely unsafe, unsafe, marginally safe, relatively safe and very safe (Hao et al. Reference Hao, Wang, Li, Wan and Wei2023). The calculations were according to Equations 3–7:
 $T = \alpha f\left( x \right) + \beta g\left( y \right) + \gamma h\left( z \right) + \chi l\left( q \right)$
 $f\left( x \right) = \mathop \sum \limits_{j = 1}^m {a_j}^{\rm{\;}}X_{ij}^{\rm{'}}$
 $g\left( y \right) = \mathop \sum \limits_{j = 1}^m {b_j}{Y'_{ij}}$
 $h\left( z \right) = \mathop \sum \limits_{j = 1}^m {c_j} {Z'_{ij}}$
 $l\left( q \right) = \mathop \sum \limits_{j = 1}^m {d_j}{Q'_{ij}}$
where T stands for the comprehensive security evaluation index of the WEFC system; f(x), g(y), h(z) and l(q) represent the security evaluation indices of each subsystem;
 ${X'_{ij}},{\rm{\;}}{Y'_{ij}},\;{Z'_{ij}}\;and\;{Q'_{ij}}$
represent the standardized indicator values for each subsystem; m represents the number of indicators for each subsystem; a
j
, b
j
, c
j
and d
j
are the dimension weights, respectively representing the weights of the jth indicator of the water resources, energy, food and carbon subsystems in year i; and α, β, γ and χ respectively represent the weights of the water resource, energy, food and carbon subsystems in terms of their influence on the overall system’s safety. According to the existing research (Wang et al. Reference Wang, Hou and Zhou2021, Li et al. Reference Li, Cao, Fan, Wang, Zhou and Ren2023a, Liu et al. Reference Liu, Liu, Zhu and He2024), the four subsystems have an equal degree of impact on the security of the overall system; that is to say,
 $\alpha = \beta = \gamma = \chi = {\rm{\raise.5ex\hbox{$\scriptstyle 1$}\kern-.1em/ \kern-.15em\lower.25ex\hbox{$\scriptstyle 4$} }}$
.
Construction of the security evaluation index system and weight determination
Based on a thorough review of the existing literature on water security, energy security, food security and carbon emissions (Yao et al. Reference Yao, Teng and Huang2015, Sun & Yan Reference Sun and Yan2018, Gu & Gao Reference Gu and Gao2022, Li et al. Reference Li, Huang and Huang2022a, Wang & Sun Reference Wang and Sun2022, Li et al. Reference Li, Cao, Fan, Wang, Zhou and Ren2023a, Reference Li, Wang and Liu2023b, Liu et al. Reference Liu, Liu, Zhu and He2024, Yuan et al. Reference Yuan, Cheng, He and Xu2024, Lin & Zhao Reference Lin and Zhao2025, Zhu et al. Reference Zhu, Zhang and Xu2025), and fully considering the disciplinary backgrounds related to water resources, energy, food and carbon, the construction of the evaluation indicator system adhered to the principles of integrity, comprehensiveness, scientific rigour and data availability and representativeness. Ultimately, 38 evaluation indicators (Appendix S1 Table S1) were selected to assess the system’s safety. Among these, 18 indicators were positive and 20 were negative. The entropy method was applied to assign weights to these indicators.
The entropy method served as a more robust weighting technique than the analytic hierarchy process and the relative index method (Deng & Liu Reference Deng and Liu2023, Xu Reference Xu2023). This method determined weights based on the information entropy of indicators; a smaller entropy value signified that the indicator contained more information, thus receiving a greater weight (Tian et al. Reference Tian, Fan, Jin, Wu and Zhao2025). Therefore, this study implemented the entropy method to quantify weights in order to minimize the impact of subjective elements on the evaluation process. The specific calculations were according to Equations 8–11:
 ${Y_j} = {X'_{ij}}/\mathop \sum \limits_{i = 1}^m {X'_{ij}}$
 ${e_j} = - k\mathop \sum \limits_{i = 1}^m ({Y_{ij}} \times \ln {Y_{ij}}),{\rm{\;}}0 \le e \le 1$
where
 $\;k = {1 \over {\ln m}}$
and when
 ${Y_{ij}} = 0,\;{\rm{set}}\;{Y_{ij}} \times \ln {Y_{ij}} = 0;$
 ${d_j} = 1 - e$
 ${w_j} = {d_j}/\mathop \sum \limits_{j = 1}^n {d_j}$
where X ’ ij is the standardized index value, m is the number of evaluation years, n is the number of indicators, e j is the information entropy, d j is the redundancy of information entropy and w j is the indicator weight.
Coupling coordination degree model
The developmental stages and coordination level of the four systems were analysed using the coupling coordination degree model to explore the linkages among water resources, energy, food and carbon and to assess their mutual impacts. The calculations were according to Equations 12 & 13:
 $C = {{{4^4}\sqrt {f\left( x \right)g\left( y \right)h\left( z \right)l\left( q \right)} } \over {f\left( x \right) + g\left( y \right) + h\left( z \right) + l\left( q \right)}}$
 $D = \sqrt {C \times T}$
where D represents the coupling coordination degree,
 $D \in \left[ {0,1} \right]$
(a higher degree of safe and coordinated subsystem development was indicated by a larger value of D), C stands for the coupling degree,
 $C \in \left[ {0,1} \right]$
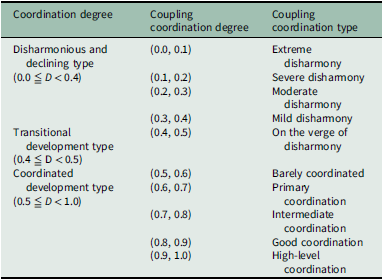
(a higher coupling score indicated a stronger correlation among the subsystems) and T stands for the total safety evaluation index. Based on existing studies (Gai & Zhang Reference Gai and Zhang2018, He et al. Reference He, Wang, Xu, Li and Zhang2023, Li et al. Reference Li, Cao, Fan, Wang, Zhou and Ren2023a), the coupling coordination degree was categorized into multiple grades (Table 1). This paper employed visual analysis to examine the coupling coordination degree over a 10-year period due to limitations in data availability, and we used ArcGIS 10.8 software to analyse the coupling coordination degree of the WEFC system in the three provinces.
Coupling coordination degree and evaluation grades.

Table 1. Long description
A table categorizing coupling coordination degrees and their corresponding evaluation grades. The table has three columns: Coordination degree, Coupling coordination degree, and Coupling coordination type. It is divided into three main sections based on the coordination degree: Disharmonious and declining type, Transitional development type, and Coordinated development type. Each section lists specific ranges of coupling coordination degrees and their corresponding types. Row 1: Coordination degree: Disharmonious and declining type (0.0 <= D < 0.4), Coupling coordination degree: (0.0, 0.1), Coupling coordination type: Extreme disharmony. Row 2: Coordination degree: Disharmonious and declining type (0.0 <= D < 0.4), Coupling coordination degree: (0.1, 0.2), Coupling coordination type: Severe disharmony. Row 3: Coordination degree: Disharmonious and declining type (0.0 <= D < 0.4), Coupling coordination degree: (0.2, 0.3), Coupling coordination type: Moderate disharmony. Row 4: Coordination degree: Disharmonious and declining type (0.0 <= D < 0.4), Coupling coordination degree: (0.3, 0.4), Coupling coordination type: Mild disharmony. Row 5: Coordination degree: Transitional development type (0.4 <= D < 0.5), Coupling coordination degree: (0.4, 0.5), Coupling coordination type: On the verge of disharmony. Row 6: Coordination degree: Coordinated development type (0.5 <= D < 1.0), Coupling coordination degree: (0.5, 0.6), Coupling coordination type: Barely coordinated. Row 7: Coordination degree: Coordinated development type (0.5 <= D < 1.0), Coupling coordination degree: (0.6, 0.7), Coupling coordination type: Primary coordination. Row 8: Coordination degree: Coordinated development type (0.5 <= D < 1.0), Coupling coordination degree: (0.7, 0.8), Coupling coordination type: Intermediate coordination. Row 9: Coordination degree: Coordinated development type (0.5 <= D < 1.0), Coupling coordination degree: (0.8, 0.9), Coupling coordination type: Good coordination. Row 10: Coordination degree: Coordinated development type (0.5 <= D < 1.0), Coupling coordination degree: (0.9, 1.0), Coupling coordination type: High-level coordination.
Time series forecasting model
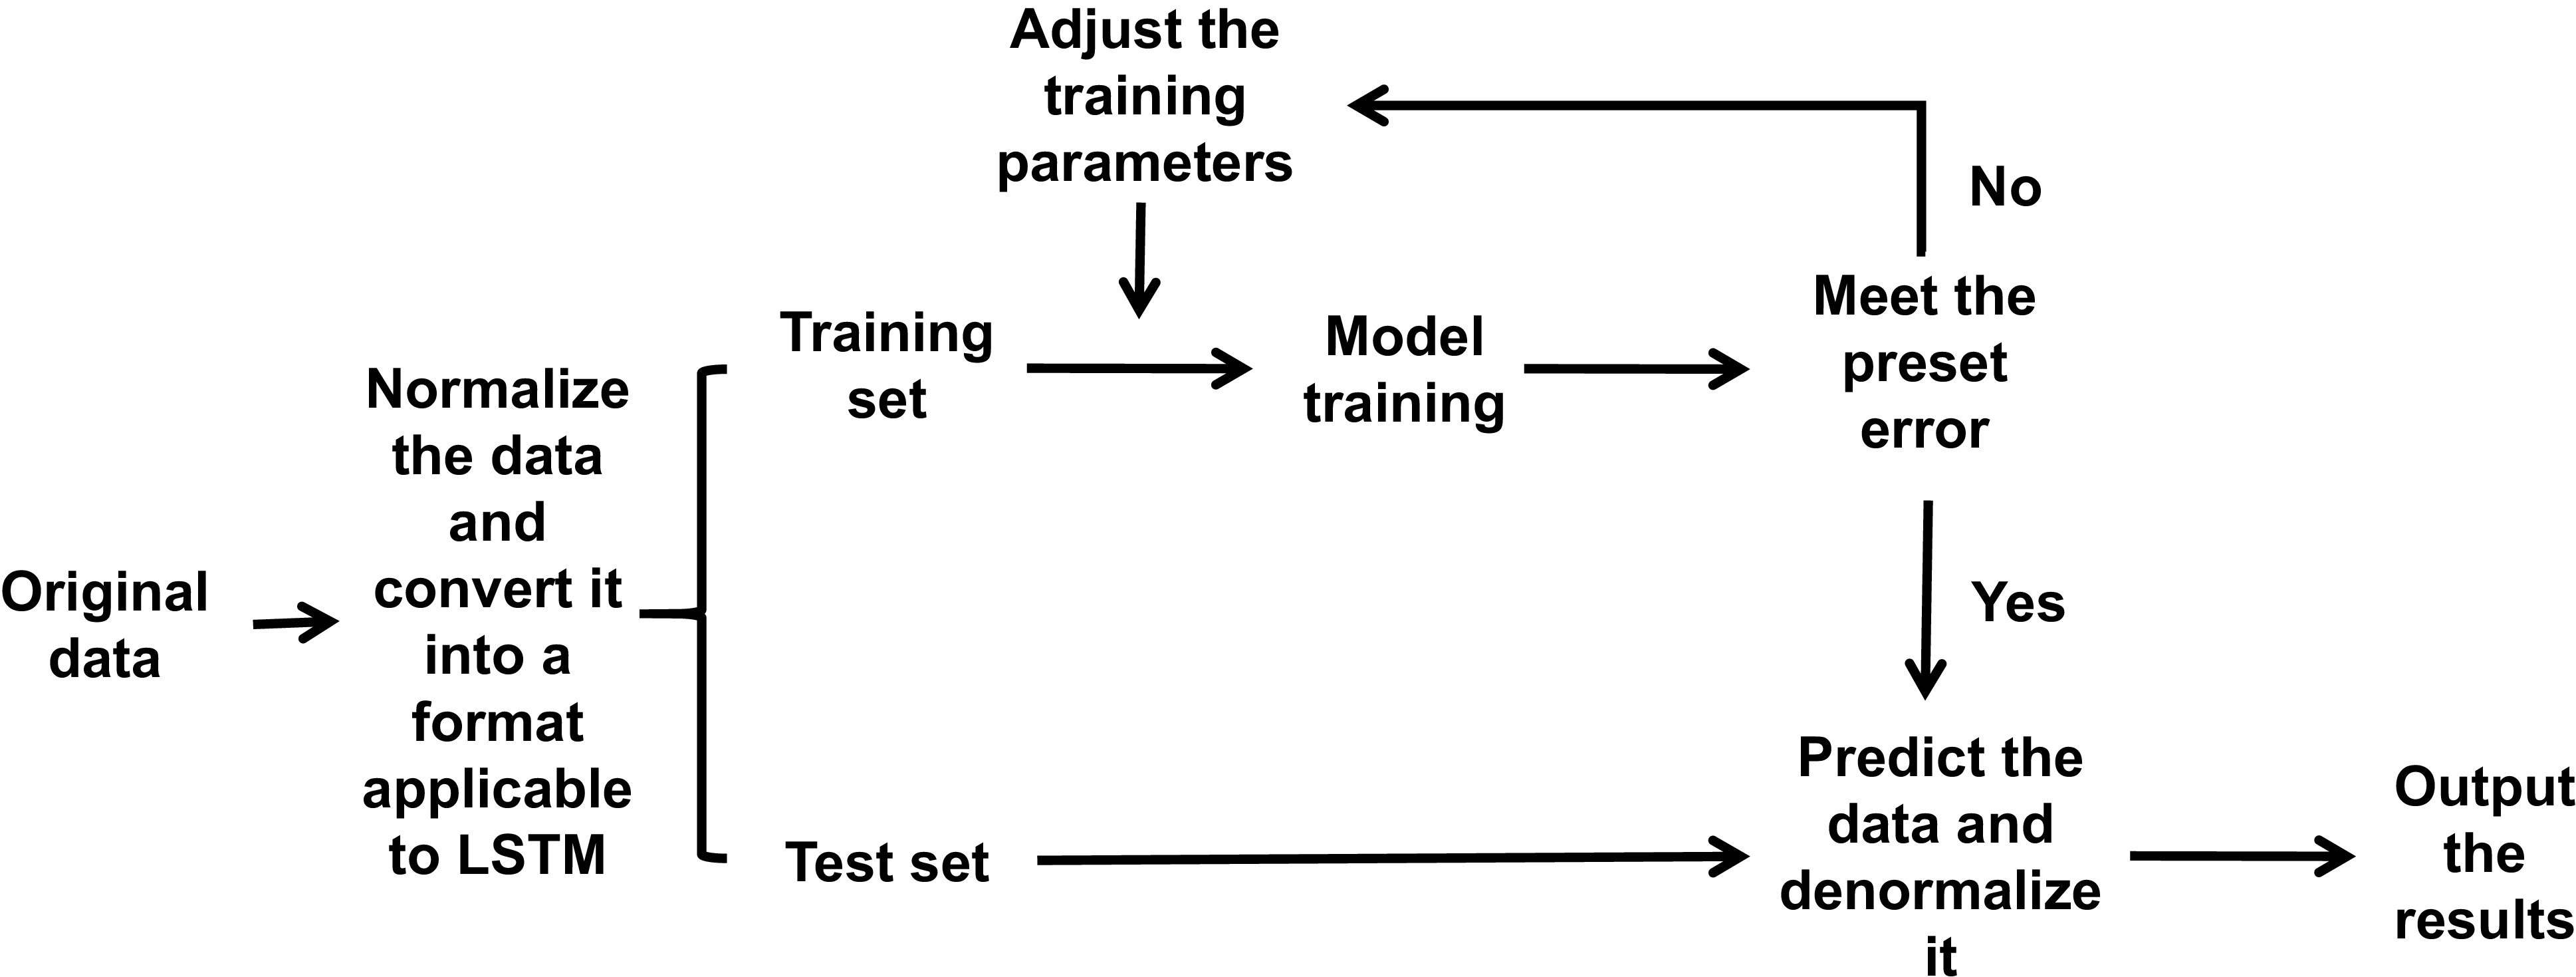
Utilizing the Python programming environment, an LSTM model was constructed using PyCharm software to forecast the WEFC coupling coordination degree of Northeast China from 2023 to 2030. During the modelling process, the selected sample data were first normalized using the ‘MinMaxScaler’ function and then converted into a format suitable for LSTM modelling. In a cross-validation phase, the 10-year dataset was split into training and testing subsets using an 80:20 ratio while preserving the chronological sequence. The LSTM model consisted of an eight-unit memory layer, with the total number of training epochs set to 78. Upon completion of the model training, the predictions for the coupling coordination degree in the testing set were normalized and inverted to get the final forecast results (Fig. 1).
Outline of the long short-term memory (LSTM) model construction process.

Results
Security evaluation of the WEFC system
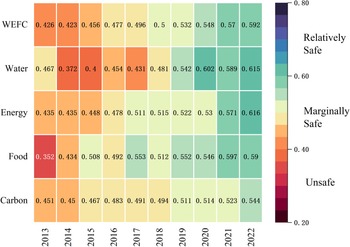
The comprehensive safety evaluation index of the WEFC system during 2013–2022 displayed an upward trajectory accompanied by fluctuations, rising from 0.426 in 2013 to 0.592 in 2022 (Fig. 2). The water resource safety evaluation index exhibited an upward trajectory with fluctuations, rising from marginal safety in 2013 to relatively safety in 2022 (Fig. 2). In 2014, the safety evaluation index dropped to its lowest value of 0.372, corresponding to an unsafe level. Declines in the water safety index also occurred in 2017 and 2021. The energy safety evaluation index showed overall positive development between 2013 and 2022, exhibiting a steady upward trend and achieving a level transition from marginal to relative safety (Fig. 2). The food safety evaluation index demonstrated the greatest fluctuation and the largest overall increase, rising from 0.352 (unsafe) in 2013 to 0.590 (marginal safety) in 2022 – a growth of 23.8% (Fig. 2). The carbon safety evaluation index also demonstrated an upward trajectory during the period, despite growth remaining relatively slow, and the index remaining at a marginal safety level throughout (Fig. 2).
The security evaluation indices of the water–energy–food–carbon (WEFC) system in Northeast China.

Coupling coordination of the WEFC system
There was an overall upward trend in the coupling coordination degree, increasing from 0.639 in 2013 to 0.756 in 2022, representing a transformation from primary coordination to an intermediate status of coordination (Table 2). Notably, as the concluding year of the 12th Five-Year Plan, 2015 witnessed a rapid increase in the coupling coordination degree of the WEFC system in Northeast China, reaching 3.5%, the fastest growth rate in the previous decade, albeit with a slight decline of 0.7% in 2014 compared to the previous year (Table 2).
The coupling coordination degrees of the water–energy–food–carbon system in the three north-eastern provinces of China and the whole region from 2013 to 2022.

Table 2. Long description
The table presents the coupling coordination degrees of the water-energy-food-carbon system in Liaoning Province, Jilin Province, Heilongjiang Province, and Northeast China from 2013 to 2022. It has 5 rows and 10 columns. The columns are labeled with the years 2013, 2014, 2015, 2016, 2017, 2018, 2019, 2020, 2021, and 2022. The rows are labeled with the names of the provinces and the region: Liaoning Province, Jilin Province, Heilongjiang Province, and Northeast China. Row 1: Liaoning Province, 0.642, 0.621, 0.639, 0.671, 0.688, 0.679, 0.693, 0.707, 0.737, 0.749. Row 2: Jilin Province, 0.657, 0.665, 0.710, 0.729, 0.732, 0.734, 0.756, 0.777, 0.784, 0.805. Row 3: Heilongjiang Province, 0.618, 0.617, 0.624, 0.632, 0.652, 0.675, 0.712, 0.706, 0.706, 0.715. Row 4: Northeast China, 0.639, 0.635, 0.658, 0.677, 0.691, 0.696, 0.721, 0.730, 0.743, 0.756. The table shows an overall upward trend in the coupling coordination degree, increasing from 0.639 in 2013 to 0.756 in 2022. Notably, 2015 witnessed a rapid increase in the coupling coordination degree of the WEFC system in Northeast China, reaching 3.5%, the fastest growth rate in the previous decade, albeit with a slight decline of 0.7% in 2014 compared to the previous year.
According to the levels of coupling coordination degree, four temporal points – 2013, 2016, 2019 and 2022 – were selected for analysis from the 2013–2022 period. During 2013–2022, the regional configuration of the WEFC system’s coupling coordination degree followed the spatial order: Jilin Province > Liaoning Province > Heilongjiang Province, with corresponding values of 0.731, 0.683 and 0.671, respectively. Overall, the provinces showed significant imbalances between the northern and southern regions compared to the central region (Fig. 3).
The coupling coordination degree of the water–energy–food–carbon system in the three north-eastern provinces of China for the years 2013, 2016, 2019 and 2022.

Coupling coordination forecast
The coupling coordination development trend of the WEFC system in Northeast China is expected to follow the development trend observed in 2013–2022, exceeding 0.8 by 2030 and achieving good coordination, gradually advancing towards high-level coordination (Fig. 4).
Coupling coordination degree of the water–energy–food–carbon system during 2013–2022 and predictions for 2023–2030 using the long short-term memory model.

Discussion
The WEFC system remained at a marginal safety level over 2013–2022 while progressing towards a relatively safe level. Notably, the comprehensive safety evaluation index dropped to its lowest value of 0.423 in 2014, with water resource factors having the greatest influence on this trend (Appendix S1 Fig. S2). The analysis reveals that the water resource safety evaluation index showed an upward trend over the period. However, in 2014, 2017 and 2021, total water resources were relatively low and had declined compared to the previous years, while other water demands, such as ecological water use, remained high, aligning with the views of Wang et al. (Reference Wang, Jiang and Zhu2024) regarding the significant water resource pressure in northern regions. Furthermore, in, the urban sewage treatment rate declined, ultimately causing water resources to be insufficient to meet societal development needs, leading to a decrease in the water resource safety evaluation index. The growth of the energy safety evaluation index was primarily attributed to the proactive response of the Northeast China provinces to the national 12th, 13th and 14th Five-Year Plans, which involved reformative adjustments to the energy industry structure. These adjustments not only increased per-capita energy production but also effectively controlled the generation of industrial solid waste, thereby improving the overall safety level of the energy system. The food safety evaluation index peaked at 0.597 in 2021, with a fluctuation amplitude of 24.4%. Slight declines were observed in 2016, 2018, 2020 and 2022, primarily due to the continuous expansion of the grain planting area accompanied by a yearly increase in fertilizer usage, which severely impacted the sustainability of the food system and subsequently exerted a negative effect on the food security evaluation index. In addition, the carbon safety evaluation index was only 0.544 in 2022, significantly lower than those of the other subsystems, which constrained the overall safety performance of the WEFC system. This was primarily due to Northeast China being a traditional fossil energy-consumption region, posing challenges for improving carbon safety, a finding consistent with Liao et al. (Reference Liao, Li and Roosli2022).
The decline of coupling coordination degree in 2014 was mainly caused by the coupling coordination degrees of Liaoning Province and Heilongjiang Province experiencing their largest negative growth in a decade, which lowered the overall coordination level of Northeast China. In 2014, Liaoning Province implemented the ‘Implementation Plan for Atmospheric Pollution Prevention and Control in Liaoning Province’, which mandated industrial enterprises to reduce production and emissions. As a traditional heavy industry base, this policy directly led to a sharp decrease in industrial water and energy demand. At the same time, the stagnation of industrial projects hindered the optimization of the energy consumption structure, maintaining a significant reliance on coal and thus exacerbating carbon emission pressures. This resulted in a temporary disruption among the subsystems’ coordination. Additionally, Liaoning Province experienced its most severe drought since 1951 (Liaoning Meteorological Bureau 2015), resulting in an increase in agricultural irrigation water consumption. This intensified competition with urban and industrial water demands, disrupting the synergy between food production and energy supply and further lowering Liaoning’s coupling coordination degree within the WEFC system. The enforcement of the ‘Regulations on the Implementation of the Water Law of the People’s Republic of China’ in Heilongjiang Province in 2014 (Heilongjiang Daily 2013) marked the beginning of deep reforms in water resource management. However, due to the initial lack of supporting policies and insufficient local coordination, water resource management experienced temporary disorder and only slow improvements in utilization efficiency, which impacted water security. Overall, the decline in coupling coordination degrees in Liaoning and Heilongjiang in 2014 fundamentally resulted from the conflict between policy transition periods and traditional path dependencies, compounded by the external shock of extreme climate events. This phase exposed deficiencies in the coordination of the WEFC system and a lack of policy synergy in Northeast China, providing valuable lessons for promoting green transformation in the future.
From 2016 to 2022, spanning both the 13th and 14th Five-Year Plans, the systematic reconstruction of policy frameworks – including the establishment of a river basin ecological compensation mechanism (State Council of the People’s Republic of China 2021), support for resource-based city transformation (Ministry of Natural Resources of the People’s Republic of China 2014), promotion of the integration of artificial intelligence with agriculture (State Council of the People’s Republic of China 2021) and development of industrial greenification (State Council of the People’s Republic of China 2016) – provided a necessary foundation for the continued growth of the WEFC system’s coupling coordination degree. Over the span of this period, the coordinated advancement of four major pathways – intensive water resource utilization, energy structure optimization, food security protection and enhancement of carbon sink capacity – formed a closed-loop logic chain: ‘water for production, energy for food, food for carbon and carbon promoting innovation’. The synergy of policy coordination and path innovation jointly propelled the WEFC system in Northeast China to achieve intermediate coordination in 2019, with the coupling coordination degree reaching its highest value in 2022.
From the perspective of inter-provincial differences, Jilin Province consistently maintained a leading position during the period of study, progressing from primary coordination to intermediate coordination and ultimately achieving a transition to good coordination. The success of Jilin is due to its abundant black soil and wind/solar energy resources, along with technological innovation. By conserving black soil (e.g., controlling the use of chemical fertilizers and pesticides, improving farming practices), Jilin strengthened the foundation for both food production and carbon sinks. Through the replacement of traditional energy with clean energy sources, Jilin effectively reduced carbon intensity and improved resource efficiency. Although Liaoning Province was the last among the three to reach the intermediate coordination stage, its coupling coordination degree eventually surpassed that of Heilongjiang, ranking it second. This transition was largely due to Liaoning’s historical reliance on energy-intensive industries, which initially generated substantial conflicts between the energy and carbon subsystems, suppressing the overall coordination level. Nonetheless, through the stringent development of clean energy and continuous innovation in agricultural technologies, Liaoning achieved major breakthroughs in circular economy practices. As a result, this resource-based region successfully increased the coupling coordination level of its WEFC systems. Heilongjiang Province, although the second to reach intermediate coordination in 2019, ultimately stagnated at this level, with a coupling coordination degree that ended up lower than that of Liaoning. The province initially benefitted from its extensive black soil arable land and substantial energy reserves, allowing it to reach an early peak in 2019. Nevertheless, subsequent delays in adjusting the energy structure and the over-exploitation of black soil led to dual pressures from high energy consumption and high carbon emissions. From these findings, a single-factor advantage was evidently insufficient to sustain long-term system coordination, which corroborates the findings of Tian et al. (Reference Tian, Fan, Jin, Wu and Zhao2025). Therefore, the urgent task for promoting the coordinated advancement of the WEFC system in Northeast China lies in accurately identifying critical bottlenecks and enhancing cross-provincial policy coordination.
The coupling coordination degree of the WEFC system indicates that Northeast China has made stable progress in areas such as the rational allocation of water resources, the clean energy transition, smart food production and carbon emission control. The coordinated development of various industries has effectively driven the enhancement in the system’s coupling coordination degree. In the future, Northeast China can be expected to sustain momentum in coordinated development, augmenting investments in technological innovation, enhancing regional cooperation and resource sharing, addressing regional disparities and proactively responding to emerging challenges through dynamic strategy adjustments. These initiatives will enhance the WEFC system in Northeast China, promoting greater coordination and sustainable development.
Coordinated growth of WEFC systems will undoubtedly become a powerful force for environmental protection and sustain ecological diversity. However, studies in local regions lack sufficient sample sizes and general representativeness. In the future, research should integrate data from across China and conduct WEFC system safety analyses elsewhere, enabling more reliable predictive analyses with longer sequence data.
Conclusion
From 2013 to 2022, the comprehensive security evaluation index of the WEFC system in Northeast China showed an overall upward trend, with water resource factors having the greatest influence on this trend and the food safety index exhibiting the largest fluctuation range and fastest growth rate. The coupling coordination degree of the WEFC system in the region transitioned from primary coordination to intermediate coordination, with Jilin Province being greater than Liaoning Province, which exceeded Heilongjiang Province. Predictions based on the LSTM model for the coupling coordination degree of the WEFC system in Northeast China from 2023 to 2030 suggested that the system coupling coordination degree would continue to rise, demonstrating the potential to achieve higher coordination levels. Northeast China should continue to ensure stable and coordinated system development, optimize resource utilization and regional sustainability and contribute to achieving the national ‘dual carbon’ goals.
Supplementary material
To view supplementary material for this article, please visit https://doi.org/10.1017/S0376892926100538.
Acknowledgements
We thank the editor and two anonymous reviewers for their valuable comments and suggestions.
Author contributions
Yanqiu Wang: Writing – review & editing, Supervision, Conceptualization, Funding acquisition. Shumin Liu: Writing – original draft, Formal analysis, Methodology, Visualization, Data curation, Investigation, Conceptualization. Lianwei Liu: Writing – review & editing, Supervision, Funding acquisition. Anni Zhang: Writing – review & editing, Supervision. Yutianyi Zhang: Writing – review & editing, Supervision.
Financial support
This work was supported by the Heilongjiang Provincial Social Sciences Association (25121) and the key research projects of the Heilongjiang Provincial Government Research Office (SKGW-ZDKT2025012).
Competing interests
The authors declare none.
Ethical standards
Not applicable.