I. INTRODUCTION
Ever since graphene was experimentally isolated about a decade ago, Reference Novoselov, Geim, Morozov, Jiang, Zhang, Dubonos, Grigorieva and Firsov1 the high temperature (1300–1700 °C) Si sublimation from crystalline silicon carbide (SiC) bulk substrates has been extensively regarded as the cleanest and most controlled means of obtaining quality graphene at the wafer level. Reference Berger, Song, Li, Li, Ogbazghi, Feng, Dai, Marchenkov, Conrad, First and De Heer2–Reference Forti and Starke4 However, the transfer of this approach to its natural pseudo-substrate, i.e., epitaxial SiC films on silicon, Reference Ouerghi, Kahouli, Lucot, Portail, Travers, Gierak, Penuelas, Jegou, Shukla, Chassagne and Zielinski5–Reference Fukidome, Abe, Takahashi, Imaizumi, Inomata, Handa, Saito, Enta, Yoshigoe, Tareoka, Kotsugi, Ohkouchi, Kinoshita, Ito and Suemitsu7 has lagged behind despite being strongly driven by substantial cost (SiC wafers are about 100 times more expensive than silicon) and large-scale fabrication arguments. This endeavor has proved more challenging than expected, in particular, because of the upper limit set by the melting temperature of silicon and the scarce availability of a defect-free and atomically smooth epitaxial SiC on Si(111) starting template. Reference Fukidome, Takahashi, Abe, Imaizumi, Handa, Kang, Karasawa, Suemitsu, Otsuji, Enta, Yoshigoe, Teraoka, Kotsugi, Ohkouchi, Kinoshita and Suemitsu8,Reference Mishra, Hold, Iacopi, Gupta, Motta and Iacopi9
In response to such challenges, we have recently demonstrated an alternate approach to the wafer-level, transfer-free uniform synthesis of graphene on silicon. Reference Cunning, Ahmed, Mishra, Kermany, Wood and Iacopi10 As for the sublimation process, our new methodology relies on the use of epitaxial SiC on silicon as a solid source of carbon. The main advantage of this approach is that it enables a wafer-scale patterned synthesis of graphene by prepatterning of the source SiC layer. Reference Cunning, Ahmed, Mishra, Kermany, Wood and Iacopi10,Reference Fukidome, Kawai, Handa, Hibino, Miyashita, Kotsugi, Ohkochi, Jung, Suemitsu, Kinoshita, Otsuji and Suemitsu11 However, our catalyst-mediated process Reference Cunning, Ahmed, Mishra, Kermany, Wood and Iacopi10 allows for a reduction in the optimal synthesis temperature and for a relaxation of the strict requirements on the starting template. In this study, we will review the alloy-mediated catalytic synthesis and show that this process works equally well on both SiC(100) and SiC(111) orientations of the pseudo-substrate. We demonstrate an outstanding graphene bilayer with remarkable adhesion to the substrate and outstanding electrical conduction properties.
II. EXPERIMENTAL
Monocrystalline 3C-(cubic polytype) SiC films, 250 nm thick, were epitaxially grown on <111> and <100> oriented 2″ silicon substrates in a hot wall, horizontal low-pressure chemical-vapor deposition reactor, as described by Wang et al., Reference Wang, Dimitrijev, Tanner, Han, Iacopi, Hold and Harrison12 yielding two types of films that will be referred to as SiC(111) and SiC(100), respectively Reference Iacopi, Walker, Wang, Malesys, Ma, Cunning and Iacopi13 [Fig. 1(a)]. Subsequently, either a single layer of Ni or a double layer of Ni and Cu was sputtered on the SiC samples, as illustrated in Fig. 1(b), and then annealed in a Carbolite HT furnace for 75 min at 1100 °C in a medium vacuum atmosphere (below 10−3 mbar) to induce graphitization. As per our recent work, Reference Cunning, Ahmed, Mishra, Kermany, Wood and Iacopi10 the annealing generates a highly intermixed layer, which is then removed by immersion of the samples in a wet etch solution (Freckle) and sonication, to reveal a few-layer graphene at the top surface of SiC [Fig. 1(c)]. In this study, we have kept the Cu thickness constant to ∼15 nm, while varying the Ni thickness to analyze and compare the properties of the produced graphene.
Schematic of the process steps for the preparation of graphene on epitaxial 3C-SiC on silicon. The starting substrate can be either a <100> or <111> oriented substrate (a), on which a single- or double-thin catalyst layer of Ni alone or Ni and Cu is deposited (b). An anneal at 1100 °C leads to the formation of a few-layer graphene covered with a metallic highly intermixed layer (c) that is subsequently removed by wet etching.

The few-layer graphene on SiC/Si samples was characterized with Raman spectroscopy with a Renishaw inVia Raman, using a 514 nm laser. The laser spot size was ∼1 µm (50x objective), and the laser power at the sample was about 7.5 mW. Atomic force microscopy (AFM) was performed with a Park NX20 instrument in a noncontact mode with a 512 × 512 pixel resolution on 5 × 5 and 1 × 1 μm2 scan areas to extract the root-mean-square (RMS) surface roughness as well as the power-spectral-density (PSD) of the spatial frequencies composing the surface topography pattern. X-ray photoelectron spectroscopy (XPS) was carried out with a Kratos Axis ULTRA high resolution system (Manchester, UK) with monochromatic Al Kα (1486.6 eV) incident radiation. Survey (wide) scans were taken with an analyzer pass energy of 160 eV while multiplex (narrow) high resolution scans at 20 eV. The used aperture leads to an analysis area of 700 × 300 μm2. The base pressure in the analysis chamber was below 1.0 × 10⁻⁸ Torr. Data analysis was performed with the CasaXPS software and a Shirley baseline with Kratos library relative sensitivity factors.
Sample foils for transmission electron microscopy were prepared via a focused ion beam liftout technique using a FEI Strata DB235 FIB/SEM with a Ga+ ion source. Prior to ion milling, the samples were protected with a plasma sputtered gold layer of ∼300 nm and then a 2 µm Pt cap was deposited at 5 keV by an e-beam to preserve the initial surface integrity. Site specific foils were excavated from the bulk samples and thinned to ∼500 nm. Subsequent Ar+ ion milling was conducted in a Fiscione NanoMill™ to remove Ga ion damage and provide a high resolution transmission electron microscope (HRTEM) foil. HRTEM characterization was performed using a FEI Cs corrected Titan3 microscope under 80 keV source illumination.
An initial analysis of the adhesive fracture energies of the graphene/SiC/Si system was made by loading these samples within a four point bend sandwiched configuration. Reference Dauskardt, Lane, Ma and Krishna14,Reference Lane, Dauskardt, Krishna and Hashim15 The sandwiched structures containing the graphene on SiC were prepared by sputtering an additional 500 nm Si “spacer” layer, subsequently bonded with epoxy to the mirroring silicon slab. 5 × 40 mm beams were diced out of the sandwiched structures and tested. The average critical strain energy release rates measured from such specimens yield an indication of the adhesion energy along the debonded pathway. Extensive detailed descriptions of this methodology are found in the literature. Reference Dauskardt, Lane, Ma and Krishna14,Reference Lane, Dauskardt, Krishna and Hashim15 The location of the debonding is verified through failure analysis with surface XPS analysis on both sides of the delaminated interface.
Sheet resistance measurements were taken using four electrical contacts in a van der Pauw configuration on the corners of 1 × 1 cm2 samples. 150 nm of Ni were sputtered at 100 °C through a shadow mask for forming the contacts. A total of eight measurements were taken for each sample by positioning the electrical probes on the sputtered metal contacts and sweeping the DC input current from a HP4145B parameter analyzer from 0 to 10 mA, which were then separately averaged into “vertical” and “horizontal” sheet resistance groups. Provided the material is uniform and isotropic, the measurements are expected to all converge to the same line with only marginal variation due to probe positioning.
III. RESULTS AND DISCUSSION
A. Mechanisms for catalytic alloy graphitization and physical analysis
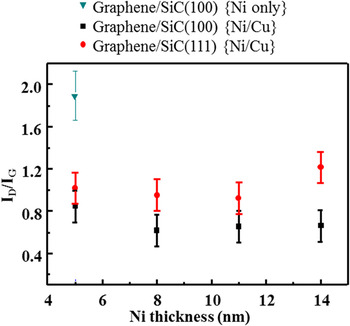
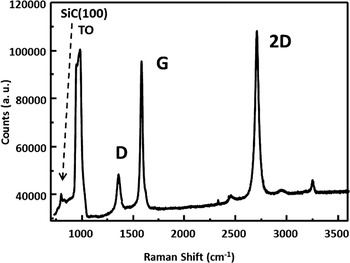
Figure 2 shows an overview of the I D/I G band ratios, indicative of the defect density of graphene layers, Reference Ferrari and Basko16 calculated from the Raman spectra of graphene prepared with different compositions of metal catalysts on SiC(100) and SiC(111), as measured after the removal of the reacted metal layer by wet etching. The error bar represents the variation obtained by measuring five different sites over the prepared samples. Note that data extracted from samples produced over more than 10 experimental runs fell within those error bars. Confirming and extending the scope of our recent findings for graphene on SiC(111), Reference Cunning, Ahmed, Mishra, Kermany, Wood and Iacopi10 these data show that the use of a Ni/Cu mixture improves dramatically the quality of the obtained graphene on SiC(100), as compared to when only Ni is used. In fact, the I D/I G ratio of graphene on SiC(100) decreases from ∼2 for 5 nm Ni catalyst alone to ∼0.8 when the Cu catalyst layer is added. Note that the graphene on SiC(100) seems to be consistently of better quality than that grown on SiC(111) under the same conditions. Figure 3 shows an example of Raman spectrum of graphene grown on SiC(100) with 8 nm Ni and 15 nm Cu. The intensity of the 2D band around 2700 cm−1 is slightly higher than that of the G band (∼1580 cm−1), which indicates monolayer to bilayer graphene. Reference Ferrari and Basko16 The spectrum in Fig. 3 includes Raman shifts down to 750 cm−1 to reveal the TO peak of the underlying SiC(100) at 795 cm−1. Note from Fig. 2 that the final graphene quality, as seen from the Raman spectrum, appears rather insensitive to the further increase of Ni thickness when the Ni/Cu mixture is used.
Comparison of the defectivity of different graphenes on SiC preparations as estimated from the ratio of the intensities of the D over G Raman bands. The thickness of the Cu layer, when present, was kept constant. The error bar is calculated from the measurements variation over five different sites. The use of a Ni/Cu alloy leads to a remarkable decrease in defectivity. Graphene on SiC(100) shows consistently a slightly lower defect density than that on SiC(111).

Example of Raman spectrum (graphene D, G, and 2D bands region) from graphene on SiC(100) prepared with ∼8 nm Ni and ∼15 nm Cu. Additionally to the low D over G band intensity, indicative of a good quality graphene, note that the 2D over G intensity ratio higher than 1 is indicative of a few-layer graphene. The Raman shift region for 3C-SiC is also shown.

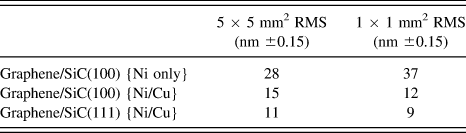
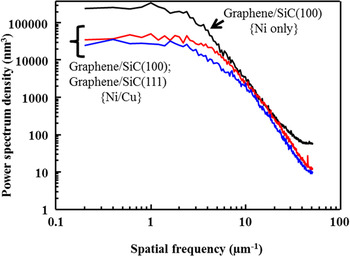
We have also compared the surface morphology of graphene samples prepared with Ni only (8 nm) and the Ni/Cu approach with AFM. As shown in Table I, the use of the alloy halves the surface RMS roughness of the final graphene sample. This is also clearly shown by the power spectral distributions in Fig. 4, indicating that the use of Ni/Cu reduces dramatically the large-range (spatial frequencies below 5 μm−1) as well as the smallest-range roughness (frequencies larger than 20 μm−1). This means that asperities larger than 200 nm and smaller than 50 nm are considerably reduced with the use of Ni/Cu.
Surface roughness comparison of different graphenes on SiC preparations. Note that the graphene prepared with Ni/Cu indicates a 50% decrease in RMS as compared to the use of Ni alone as a catalyst, and that the graphene roughness does not seem dependent on the orientation of the starting substrate. Note that the typical RMS roughness of the initial SiC surface is 2–3 nm. Reference Mishra, Hold, Iacopi, Gupta, Motta and Iacopi9

Surface roughness comparison of different graphenes on SiC preparations. Note that the graphene prepared with Ni/Cu indicates a 50% decrease in RMS as compared to the use of Ni alone as a catalyst, and that the graphene roughness does not seem dependent on the orientation of the starting substrate. Note that the typical RMS roughness of the initial SiC surface is 2–3 nm. Reference Mishra, Hold, Iacopi, Gupta, Motta and Iacopi9
Comparison of the spatial frequency spectra defining the surface topography of different graphenes on SiC preparations (power spectral densities), related to the AFM measurements in Table I. Note that the graphene prepared with Ni only has substantially more large (frequencies below 5 μm−1) as well as very small surface asperities as compared to the Ni/Cu preparations.

In our recent work, Reference Cunning, Ahmed, Mishra, Kermany, Wood and Iacopi10,Reference Iacopi, Cunning and Ahmed17 we had presented a preliminary elucidation of the mechanisms that allow the Ni/Cu alloy to induce a better quality and more controlled graphitization as compared to Ni alone. The use of Ni only had been in fact already reported in an earlier literature on SiC wafers and then abandoned as yielding graphene on the metal surface rather than on SiC, and of inferior quality compared to the sublimation approach. Reference Juang, Wu, Lo, Chen, Huang, Hwang, Chen, Leou and Tsai18,Reference Woodworth and Stinespring19 The catalytic action of Ni is essential because it reacts with SiC at relatively low temperature to form stable NiSi x , Reference Lauwers, Steegen, De Potter, Lindsay, Satta, Bender and Maex20 and therefore allows for the release of the atomic C needed for the synthesis of graphene. However, the control of a uniform reaction of a thin Ni film over a large SiC surface is not trivial, as nickel silicidation appears dominated by strong local driving forces leading to typical clustering. Reference Lauwers, Steegen, De Potter, Lindsay, Satta, Bender and Maex20,Reference Escobedo-Cousin, Vassilevski, Hopf, Wright, O'Neill, Horsfall, Goss and Cumpson21 This is confirmed by the high nonuniformity of graphene observed using only Ni in the past and confirmed with Raman bands in Fig. 2 and by the substantial topography of about 30 nm RMS shown by our surface roughness measurements in Table I.
The addition of Cu has a twofold beneficial action. Firstly, Cu acts like an efficient medium to dilute and helps to distribute as uniformly as possible the Ni over the SiC surface. Note in this regard that the thermal process for graphitization takes place very close to the melting temperature of Cu. Secondly, the Cu is known as a very efficient catalyst for graphitization, since free C has an extremely low saturation in melt Cu (only a few ppm, lower than Ni 22 ), as calculated from a simple binary C–Cu phase diagram. This allows for a fast precipitation and graphitization of C released through the Ni silicidation reaction, leading to an extraordinary improvement in the uniformity and quality of the graphene obtained through Ni/Cu.
The second important advance of this study is the demonstration that the Ni/Cu alloy graphitization achieves quality graphene on both SiC(111) and SiC(100) surface orientations, with a consistently better quality obtained from SiC(100), as inferred from the I D/I G trend in Fig. 2. This is in contrast with the Si sublimation process from SiC on silicon that is typically more successful on the SiC(111) surfaces, Reference Ouerghi, Belkhou, Marangolo, Silly, El Moussaoui, Eddrief, Largeau, Portail and Sirotti23–Reference Yazdi, Vasiliauskas, Iakimov, Zacharov, Syvajarvi and Yakimova26 which are believed to be more suitable templates for graphene because of their hexagonal atomic arrangement. We suggest here that our graphene synthesis conditions are close to those of a liquid phase epitaxy, Reference Baliga27 a process whose benefits are largely known to nanotechnology, Reference Wagner and Ellis28,Reference Iacopi, Richard, Eichhammer, Bender, Vereecken, De Gendt and Heyns29 with a larger adatom surface mobility that can somewhat relax the requirements on the starting template as compared to a more conventional epitaxial process like in the case of the sublimation. The reason why the SiC(100) template leads in our case to an even better graphene quality than SiC(111) could be related to the combination of a considerably higher tensile stress and higher surface defectivity of the latter epitaxial SiC as discussed in our previous work. Reference Iacopi, Walker, Wang, Malesys, Ma, Cunning and Iacopi13 SiC(111) layers indeed show a higher density of stacking faults appearing at the surface that, combined to a residual tensile SiC stress in the range of 700 MPa to 1 GPa, could provide a strong driving force around distinct preferential diffusion paths of the Ni atoms into the SiC layer and thus a less uniform silicidation reaction.
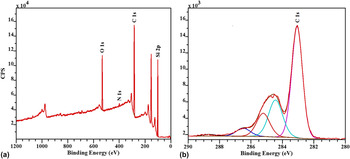
We have selected the sample series showing the best (lowest) Raman I D/I G ratio in Fig. 2, prepared on SiC(100) with 8 nm Ni and our standard Cu thickness (full spectrum in Fig. 3) for a more detailed physical and chemical analysis. XPS analysis shows a near-surface composition of 50% C, 39% Si, and about 9% O, as shown in the survey spectrum in Fig. 5(a). Other elements found in just trace amounts are F (0.7%), N (0.7%), and Ni (0.15%). The F and N traces are attributed to residues from the nitric and fluoroboric acids in the wet etch Freckle solution. Note that the wet etch procedure was successful in removing completely any Cu residues leaving only minor traces of Ni. A high resolution spectrum of Ni 2p reveals that this residue is Ni(II) oxide, with the main peak at 855 eV and its corresponding “shake-up” satellite peak. Finally, a high resolution spectrum of the C1s region (Fig. 5) appears very similar to that shown in our recent report, Reference Cunning, Ahmed, Mishra, Kermany, Wood and Iacopi10 with two main peaks centered at 284.5 eV for the graphene and 282.5 eV corresponding to the underlying SiC, accompanied by lower intensity peaks at higher eV, attributed to C–O–Si, C–O, and C=O bonds (285.2, 286.5, and 288.7 eV, respectively).
(a) XPS surface survey spectrum and (b) high resolution spectrum of the C1s region of a graphene on SiC(100) prepared with Ni/Cu, corresponding to the Raman spectrum in Fig. 3. The C1s spectrum reveals a peak centered at 284.5 eV for the graphene, one 282.5 eV corresponding to the underlying SiC, plus lower intensity peaks at higher eV, attributed to C–O–Si, C–O, and C=O bonds.

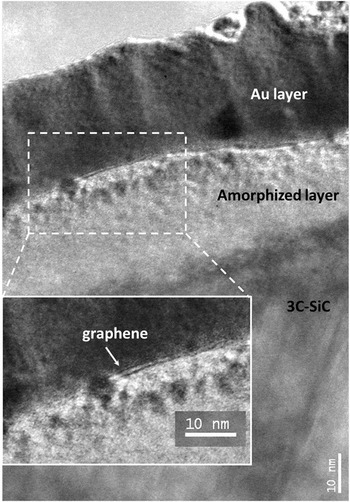
TEM micrographs from the same sample series, i.e., SiC(100) with 8 nm Ni/15 nm Cu, reveal a bilayer graphene and are shown in Fig. 6. The total estimated thickness of the bilayer is about 0.8–0.9 nm. Note that as TEM observation is extremely challenging, because of shadowing induced by the topography of the sample surface (∼15 nm RMS, Table I) and the necessity for 20–30 nm thick metal layer deposition on the top of the sample (and thus of the graphene) for TEM preparation, it is not surprising that the nanolayer is not clearly visible along the whole cross-sectional image. Nevertheless, the presence of a bilayer was confirmed by imaging at several different sites.
TEM micrograph of a graphene on SiC(100) prepared with Ni/Cu, corresponding to the Raman spectrum in Fig. 3. The small magnification image shows a region near the top surface of the epitaxial SiC. The dark region on top of the sample corresponds to the Au deposited during TEM preparation. The graphene is found just below the Au layer and on the top of an amorphous layer (inset), most probably originated from the SiC during the graphitization process. The graphene is found to be a distinctive bilayer.

Another point worth noting from Fig. 6 is that there appears to be a 20–30 nm thick amorphous layer between the graphene and the crystalline SiC. It is reasonable to expect that the metal-induced graphitization of SiC would proceed through an amorphization of a thin top portion of the SiC film, as the Ni helps to weaken the Si–C bonds and to release the atomic C. Given the <1 nm thin nature of the graphene, the XPS analysis is also clearly probing the underlying amorphous layer. The presence of about 16% of the total C found in a C–O–Si bond form versus about 55% in a Si–C form would point to the fact that the top amorphized layer includes roughly a 20–25% content of oxygen normally not found in 3C-SiC, and that some of the Si–C bonds broken or weakened during the graphitization process have been replaced by an oxycarbide bond.
B. Adhesion
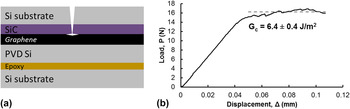
We attempted an evaluation of the adhesion of graphene to the substrate through four point bend testing as described in the Experimental section. To this purpose, we have chosen graphene wafers on a 250 nm SiC(111) epitaxial layer prepared with an optimal 8 nm Ni/15 nm Cu catalyst, from which the individual beams were prepared for the test. Five beams were tested in the sandwiched configuration shown in Fig. 7(a). The beams exhibited a plateau of nearly steady-state delamination corresponding to adhesion energies between 4 and 8 J/m2. One example of measurement is reported in Fig. 7(b), with an average plateau around 6.5 J/m2. Note that this is the first attempt of this kind, and more systematic measurements will be necessary to quantify and understand the graphene/SiC adhesion energy. Nevertheless, these preliminary measurements show that it is unlikely that the tested samples in Fig. 7(a) contained any interface with adhesion energies as low as 0.45 J/m2, which is the adhesion value reported in the literature for a monolayer graphene transferred onto a SiO2 layer. Reference Koenig, Boddeti, Dunn and Bunch30 This would imply an extraordinary improvement in reliability for transfer-free graphene grown on SiC, with significant impact for any type of practical device application.
(a) Schematic of the sandwiched beam structure containing the graphene on SiC prepared for four point bend testing of the interfacial debonding energies. The structure comprises an additional sputtered Si layer and an adhesive layer for bonding of the mirroring silicon slab. (b) Example of a four point bend measurement for a graphene sample prepared with Ni/Cu. The near-steady state energy release rate plateau for this measurement corresponds to an average debonding energy of 6.4 J/m2.

C. Electrical measurements
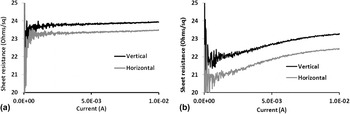
We have performed sheet resistance measurements on the graphene samples prepared with the same graphitization process as the one shown in the TEM micrograph in Fig. 6. The results are reported in Fig. 8(a). The “vertical” and “horizontal” lines represent an average value of all measurements where conduction was along one axis of the samples (horizontal and vertical), so that each point on those curves is an average of four distinct van der Pauw measurements. The difference between the vertical and the horizontal measurements is constant and less than 1 Ω, with no evidence of intrinsic anisotropy. By averaging measurements taken on five samples fabricated with the same graphitization procedure over separate runs, we can conclude that the sheet resistance of our bilayer graphene prepared on a SiC(100) layer with Ni/Cu is around 24.8 Ω/square ± 0.7 from sample-to-sample variation. Note that this value is considerably lower than 170 Ω/square, we had recently reported from graphene on SiC(111) with Ni/Cu, Reference Cunning, Ahmed, Mishra, Kermany, Wood and Iacopi10 and orders of magnitude lower than that of the underlying n-type SiC layer, in the 4–7 × 10³ Ω/square range. In fact, this value is comparable with the best sheet resistance reported so far for graphene by Bae et al. Reference Bae, Kim, Lee, Xu, Park, Zheng, Balakrishnan, Lei, Kim, Song, Kim, Kim, Ozyilmaz, Ahn and Ijima31 In Fig. 8(b), we report for comparison sheet resistance measurements performed onto the ∼23 nm Ni/Cu catalyst layer on SiC(100) before annealing/graphitization. Metal oxidation from exposure to the ambient is contributing to a relatively high resistivity around ∼5 × 10⁻⁷ Ω m.
(a) Sheet resistance of the ∼1 nm thick graphene on SiC(100) prepared with Ni/Cu and measured on a 1 × 1 cm2 sample in a van der Pauw contact configuration. This sheet resistance corresponds to a resistivity of about 2 × 10⁻⁸ Ω m for the graphene, as low as bulk Au metal; (b) sheet resistance measured on the ∼23 nm Ni/Cu alloy as a reference.

As we have already shown before, the measured sheet resistance is insensitive to the thickness of the underlying SiC, indicating that the electrical conduction is controlled by the graphene nanocoating. Therefore, for benchmarking purposes, it is meaningful to translate the sheet resistance of the bilayer graphene into a corresponding resistivity value by using the 0.9 nm thickness revealed by TEM. This leads to the resistivity of approximately 2 × 10⁻⁸ Ω m for our bilayer graphene, which is equivalent to the resistivity of bulk Au (2.2 × 10⁻⁸ Ω m). Reference Kaestle, Boyen, Schroeder, Plettl and Ziemann32
This is an astonishing result, given that our graphene bilayer is less than a nanometer thick. Even if the challenges around a uniform and continuous deposition of 1 nm thick Au layer with grain size larger than the film thickness were resolved, this layer would show a resistivity roughly an order of magnitude higher than bulk Au just because of surface scattering, Reference Kaestle, Boyen, Schroeder, Plettl and Ziemann32 as the electron mean free path in Au for electron–phonon scattering is 30–40 nm. Reference Kanter33 Note that this is a general and intrinsic limitation of classical metal conduction, on top of which any other nanometer-thin metal layer than Au would also additionally suffer from (1) more severe grain size constraints in nanovolumes and (2) partial or total oxidation.
IV. CONCLUSIONS
We have demonstrated what is, to our knowledge, the first successful approach to transfer-free, direct growth of uniform and high-quality bilayer graphene over full silicon wafers. The methodology relies on the use of an epitaxial SiC layer on silicon as a carbon source for graphene, and the use of a catalyst alloy of Ni and Cu, and can be used with both SiC(111) and SiC(100) surface orientations. The obtained bilayer graphene is around 0.8–0.9 nm thick, matching the electrical resistivity of bulk Au. Such a low resistivity of 2 × 10⁻⁸ Ω m cannot be matched by any classical metal conductor at the nanoscale. Additionally, preliminary results indicate that the adhesion of graphene to the underlying substrate could be an order of magnitude higher than the adhesion of a graphene layer grown ex situ and transferred onto a SiO2 layer on silicon.
These results point toward a fundamental advance, offering the ultimate advantage for miniaturization of electrical devices: Superior performance due to the exceptional conduction at the nanoscale of graphene, superior mechanical reliability together with transfer-free uniform synthesis at the wafer scale on silicon substrates. Large benefit from this advance is anticipated in areas such as actuation for micro- and nano-electro-mechanical systems (MEMS/NEMS) and advanced on-chip interconnects for micro and nanocircuits.
ACKNOWLEDGMENTS
We acknowledge Glenn Walker, Philip Tanner, Alan Iacopi, and Anthony Christian for their valuable technical support. The authors acknowledge the support from the Australian National Fabrication Facility (ANFF) and the Air Force Office of Scientific Research through the grant AOARD 144045. Dr. Francesca Iacopi is the recipient of a Future Fellowship from the Australian Research Council (FT120100445).