1. Introduction
The radiocarbon signature of gaseous CO2 and aqueous dissolved inorganic carbon (DIC: CO2(aq), HCO3–, CO32–) can provide valuable information on carbon cycling dynamics and residence times. A wide variety of studies have applied this approach to elucidate ages of groundwater aquifers (e.g. Jurgens et al., Reference Jurgens, Faulkner, McMahon, Hunt, Casile, Young and Belitz2022), determine residence times of crustal fluids (e.g. Elderfield et al. Reference Elderfield, Wheat, Mottl, Monnin and Spiro1999), identify sources of CO2 in oceanic hydrothermal vent systems (e.g. Proskurowski et al. Reference Proskurowski, Lilley and Brown2004), and to determine the fate of methane in seeps, sediments, and peatlands (Chasar et al. Reference Chasar, Chanton, Glaser, Siegel and Rivers2000; Pohlman et al. Reference Pohlman, Riedel, Bauer, Canuel, Paull, Lapham, Grabowski, Coffin and Spence2013; Komada et al. Reference Komada, Burdige, Li, Magen, Chanton and Cada2016).
In many of these systems, hydrogen sulfide (H2S) is present alongside the CO2 or DIC of interest. During the sample extraction, H2S is also trapped cryogenically with CO2. The H2S can interfere with the downstream reduction of CO2 to elemental filamentous carbon (“graphite”) as sulfur adsorbs strongly to the iron catalyst (Bartholomew et al. Reference Bartholomew, Agrawal and Katzer1982; Schneider et al. Reference Schneider, Inden, Grabke, Wei, Pippel and Woltersdorf2000; Nelson et al. Reference Nelson, Spencer, Snook and Yarovsky2005) and poisons the reaction (Arabczyk et al. Reference Arabczyk, Moszyński, Narkiewicz, Pelka and Podsiadły2007; Moszynski et al. Reference Moszyński, Grabke and Schneider2002). Silver foil or wire is commonly used during combustion of organic carbon samples for radiocarbon analysis and can remove sulfur impurities from S-rich materials such as soil (Koarashi et al. Reference Koarashi, Takeuchi, Saito-Kokubu and Atarashi-Andoh2025). Since silver nitrate can precipitate H2S for gravimetric analysis, we explored whether AgNO3 could also be used to purify gas samples for radiocarbon analysis. We report here on a simple and effective method to remove H2S from samples during extraction, eliminating downstream interference with graphitization.
2. Methods
2.1. System description
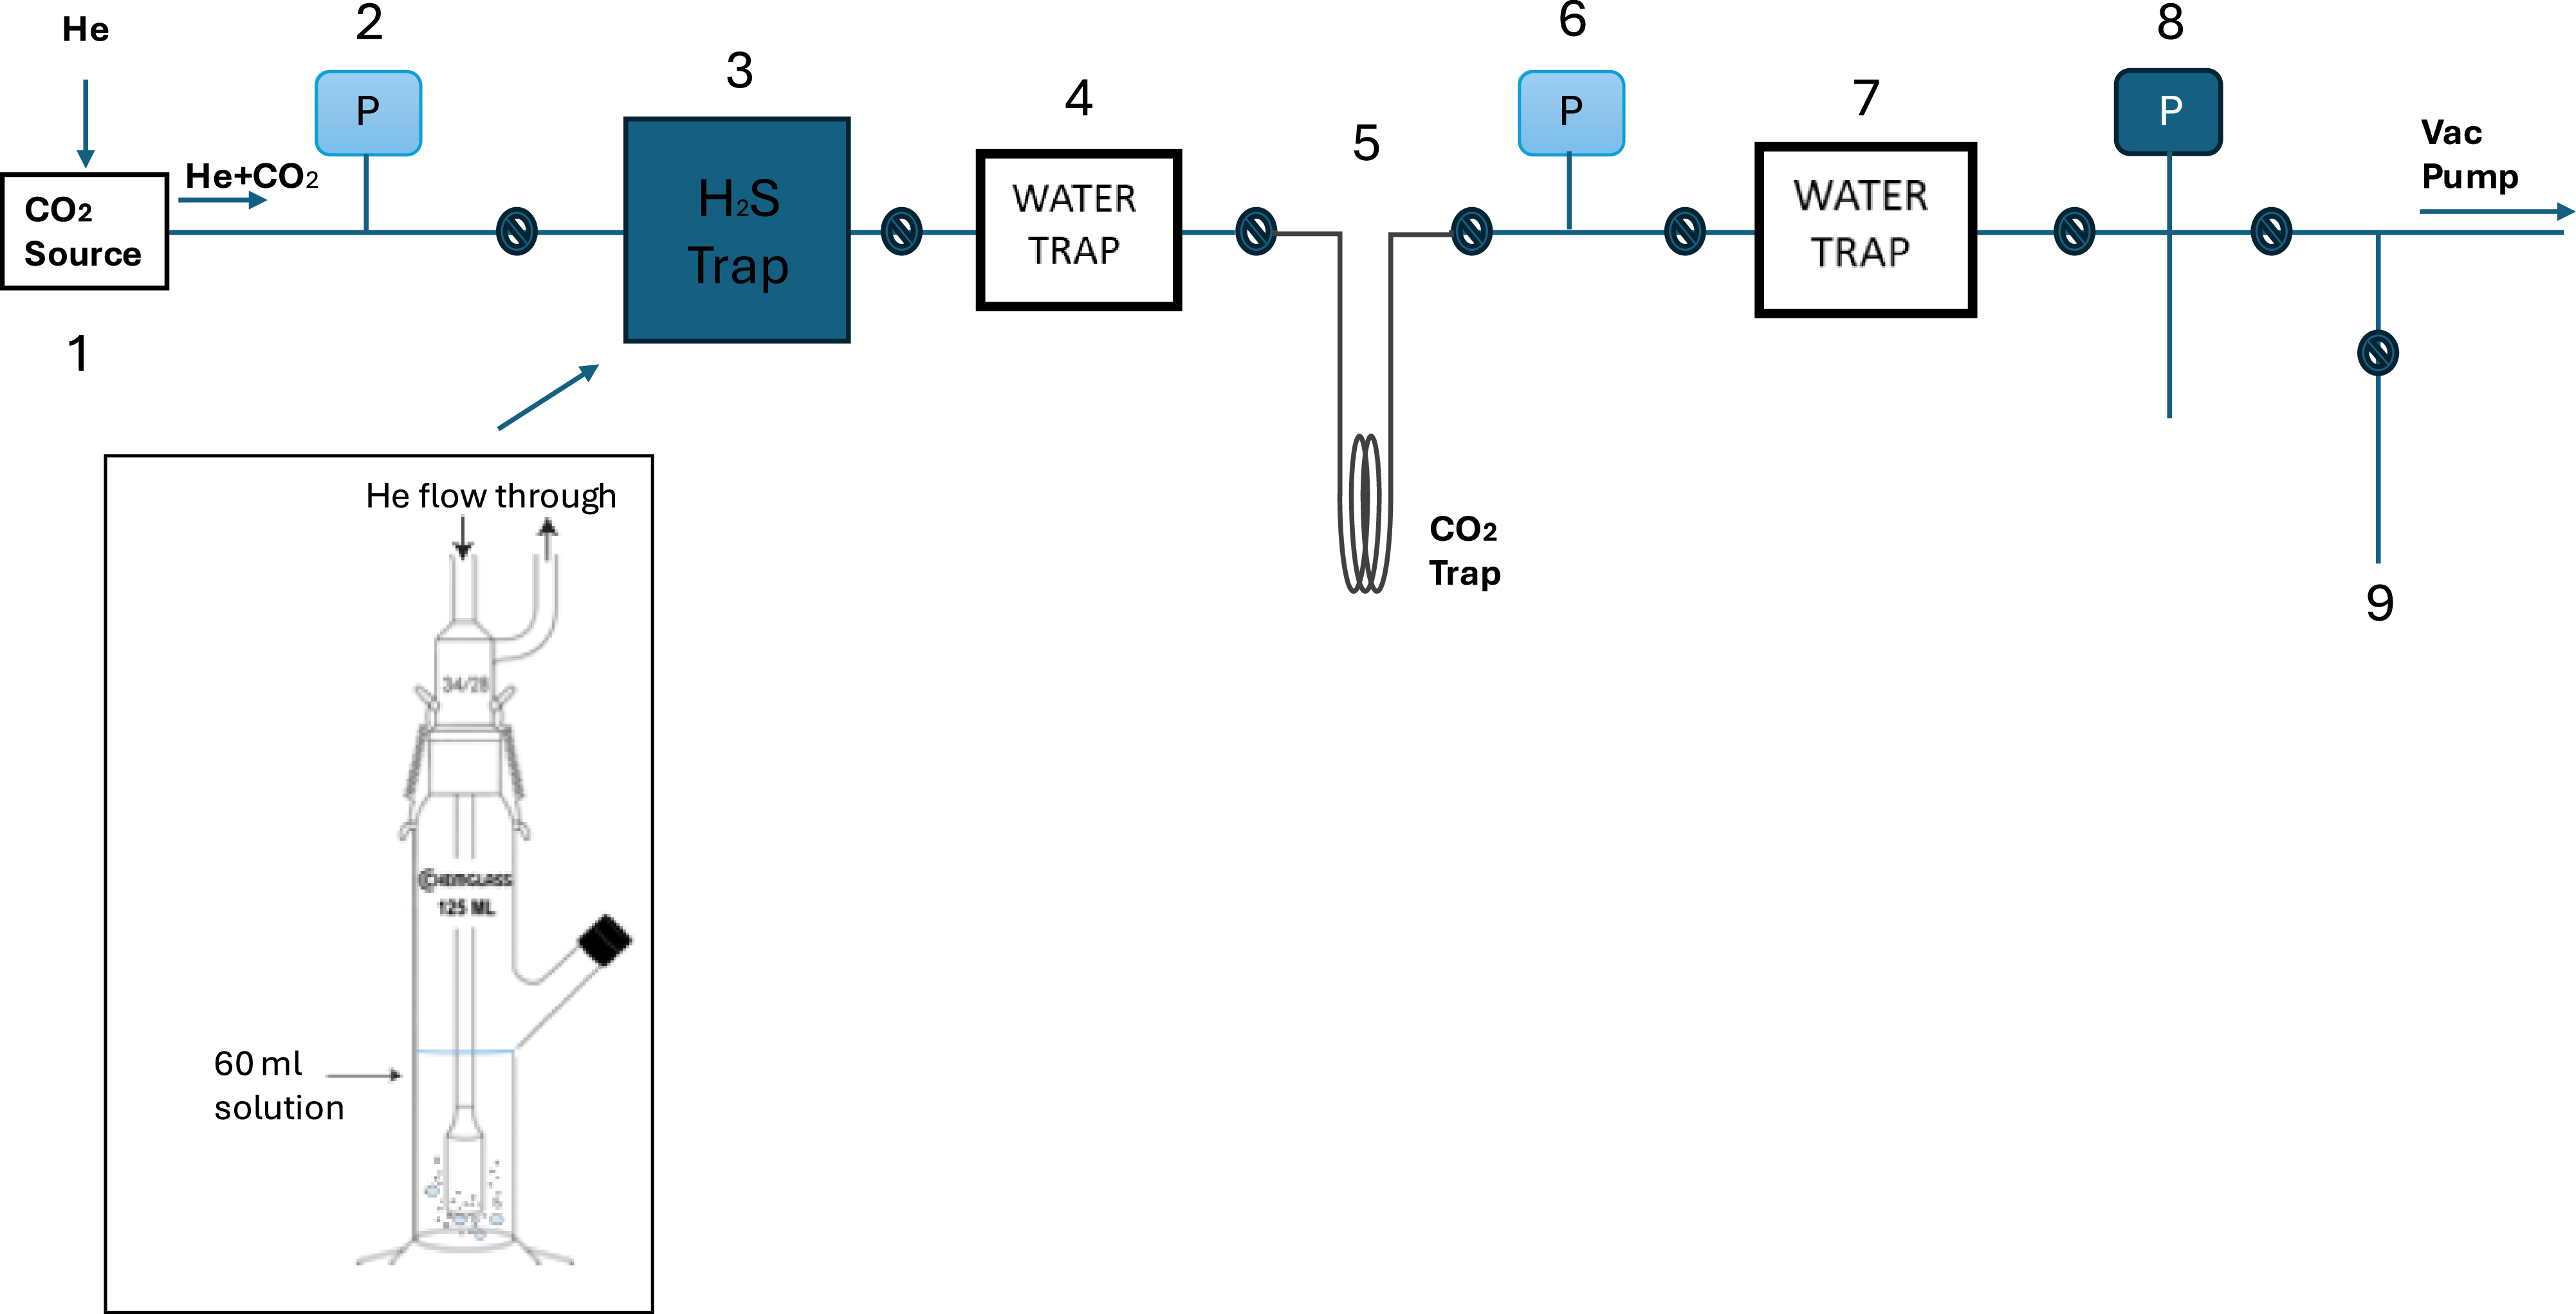
The system is based on an existing vacuum line that is typically devoted to the extraction of CO2 oxidized from seawater dissolved organic carbon (DOC; described in Xu et al. Reference Xu, Roberts, Elder, Kurz, McNichol, Reddy, Collin and Hanke2021). It has been modified to allow the introduction of different sample containers and the addition of the H2S trap (Figure 1). A gas sample can be introduced to the extraction line in a 6.4 mm OD glass ampoule using in an in-line flexible cracker, or by stripping DIC from acidified fluids with helium. CO2 from the cracker or the vessel is carried by helium (He, ultrahigh purity grade) at a rate of 120 mL/min. DIC samples are loaded into a gas washing device (e.g., Figure 1 item 3) that is purged with helium then acidified with 0.5 mL of 14.6 M phosphoric acid through a side port equipped with a septum. DIC samples that have been collected into pre-acidified Exetainer vials (e.g. Torres et al. Reference Torres, Mix and Rugh2005) can also be analyzed. These are attached via 2 in-line needles; one that bubbles helium at the bottom of the exetainer and one in the headspace that introduces the sample to the system (Lang et al. Reference Lang, Nernasconi and Fruh-Green2012).
Schematic drawing of the hydrogen sulfide clean-up line at NOSAMS 1) CO2 source, an in-line flexible gas cracking tube, gas washing device, or Exetainer vial can be used 2.) 0 to 1000 torr pressure gauge 3.) H2S trap with a solution of acidified silver nitrate 4.) Modified glass Horibe trap as water trap (in isopropyl alcohol/dry ice slush) 5.) 1/8″ OD thin wall SS loop trap for CO2 in LN, 6.) 0 to 1000 torr pressure gauge 7.) glass loop water trap (in isopropyl alcohol/dry ice slush) 8.) MKS capacitance manometer 9.) sample port to collect purified CO2.

When in use, the H2S trap replaces the halogen trap of the DOC line (Figure 1). It consists of a 125 mL tall gas washing bottle with a standard taper 34/28 top joint and a coarse pore sized frit at the gas inlet (Chemglass CG-1114-13). The trap is partially filled with a solution consisting of five grams of silver nitrate and 5 mL of 15.2 M nitric acid brought to a final volume of 100 mL with Milli-Q water. The helium carrier gas is bubbled through the acidified silver nitrate solution for 25 minutes. Any H2S in the sample reacts with silver nitrate to form silver sulfide that collects on the internal glass wall or at the frit in the trap (2 AgNO3 + H2S → Ag2S + 2 HNO3).
After passing through the H2S trap, water is removed in a dry ice/isopropanol slush (Figure 1 item 4) and then CO2 is trapped in a 1/8″ OD stainless steel tubing coil in liquid nitrogen (Figure 1 item 5). At the end of purifying and trapping, the He is pumped away. The CO2 is then transferred statically to a glass cold finger connected to a capacitance pressure gauge and quantified monometrically. Then the CO2 is sealed in 6.4 mm OD tubes for graphitization (using the port at Figure 1 item 9). As this particular vacuum line was designed for oxidizing and isolating DOC from aqueous samples, a second water trap (Figure 1 item 7) is necessary to purify sample CO2; for simplicity, this second trap remains in use when the line is utilized for H2S removal.
Finally, the purified CO2 gas is reduced to graphite at 575°C with hydrogen as reducing agent and iron powder as catalyst. The graphite is pressed into the aluminum target holders of AMS ion source for radiocarbon measurement (Roberts et al. Reference Roberts, Burton, Elder, Longworth, McIntyre, von Reden, Han, Rosenheim, Jenkins and Galutschek2010).
2.2. Determination of the processing blank
To determine the process blank of the method, a size series of small CO2 aliquots (13 to 163 µg C) generated from IAEA-C1 (F14C = 0.0002; Rozanski Reference Rozanski1991; Rozanski et al. Reference Rozanski, Stichler, Gonfiantini, Scott, Beukens, Kromer and van der1992) and OX-I (F14C = 1.0398, δ13C = –25‰; Stuiver and Polach Reference Stuiver and Polach1977) were sealed in 6.4 mm OD glass tubes and processed as described above. Deviations from expected values were assumed to be due to the introduction of extraneous carbon. The mass and F14C of the extraneous carbon blank were calculated by a chi-squared statistical method as described in Hanke et al. Reference Hanke, Wacker, Haghipour, Schmidt, Eglinton and McIntyre2017 and Roberts et al. Reference Roberts, Elder, Jenkins, Gagnon, Xu, Hlavenka and Longworth2019.
2.3. Stable isotope (δ13C) tests
To confirm that samples can be processed by this method without fractionating for 13C, two USGS isotope reference material, caffeine (USGS 61, δ13C = –35.05 ± 0.04‰; Schimmelmann et al. Reference Schimmelmann, Qi, Coplen, Brand, Fong, Meier-Augenstein, Kemp, Toman, Ackermann, Assonov, Aerts-Bijma, Brejcha, Chikaraishi, Darwish, Elsner, Gehre, Geilmann, Gröning, Hélie, Herrero-Martín, Meijer, Sauer, Sessions and Werner2016) and glycine (USGS 66, δ13C = –0.67 ± 0.04‰; Schimmelmann et al. Reference Schimmelmann, Qi, Coplen, Brand, Fong, Meier-Augenstein, Kemp, Toman, Ackermann, Assonov, Aerts-Bijma, Brejcha, Chikaraishi, Darwish, Elsner, Gehre, Geilmann, Gröning, Hélie, Herrero-Martín, Meijer, Sauer, Sessions and Werner2016), were combusted to CO2. Each was then split into replicate sub-samples of 12 to 36 µg C and processed as described above (collected at the sample port, #9 in Figure 1). The δ 13C was measured before and after the procedure on a VG Prism isotope ratio mass spectrometer (IRMS), with a typical precision between 0.1‰ and 0.23‰ (Gospodinova et al. Reference Gospodinova, McNichol, Gagnon and Shah2016; Griffith et al. Reference Griffith, McNichol, Xu, McLaughlin, MacDonald, Brown and Eglinton2012).
2.4. Environmental test samples
To test the reproducibility of the method under natural sample conditions, hydrothermal vent fluid was collected from the Ringvent site in the Northern Guaymas Basin (27.5080364ºN, 111.674823ºW) during research expedition RR2107 aboard the R/V Roger Revelle. Hydrothermal fluids were drawn directly from an advective flow during ROV Jason dives J1390 and J1392 using a sampling wand and transferred shipboard into serum bottles that had been pre-flushed with N2 to remove oxygen. Each bottle was filled completely so that no headspace remained, thereby minimizing sulfide oxidating and degassing. Subsamples were immediately aliquoted into a 2 mM zinc acetate solution and stored at –80°C until analysis. Dissolved sulfide concentrations were quantified using a modified LaMotte colorimetric assay for spectrophotometric detection at 670 nm following Mitchell et al. Reference Mitchell, Leonard, Delaney, Girguis and Scott2019. The Ringvent hydrothermal fluid containing elevated H2S (7.12 ± 0.80 mM) were combined and filtered to remove precipitates. The sample was then split into seven replicates that were analyzed independently.
An additional 5 hydrothermal vent fluid samples with elevated H2S were obtained from the mid-Cayman Rise with 150-mL titanium isobaric gas-tight samplers (Seewald et al. Reference Seewald, Doherty, Hammar and Liberatore2002) deployed by the remotely operated vehicle Jason II aboard the R/V Atlantis (Cruise AT42-22) in February 2020. Aliquots for the concentration and F14C of dissolved inorganic carbon were withdrawn with a gas-tight syringe and injected into Exetainer® (Labco) vials that had previously been spiked with phosphoric acid and flushed with helium. Concentrations of total dissolved H2S were determined by sparging a sample aliquot after acidification with 4.3 M phosphoric acid and precipitation of evolved H2S as Ag2S in 5 wt % AgNO3. Ag2S precipitates were stored for subsequent shore based gravimetric determination following recovery on a 0.22 µm pore size filter. Concentrations of CO2 were determined by gas chromatography. These samples were also processed with the optimized method to confirm that graphite could be generated with complex unknowns and to test repeatability.
3. Results and discussion
3.1. Blank assessment
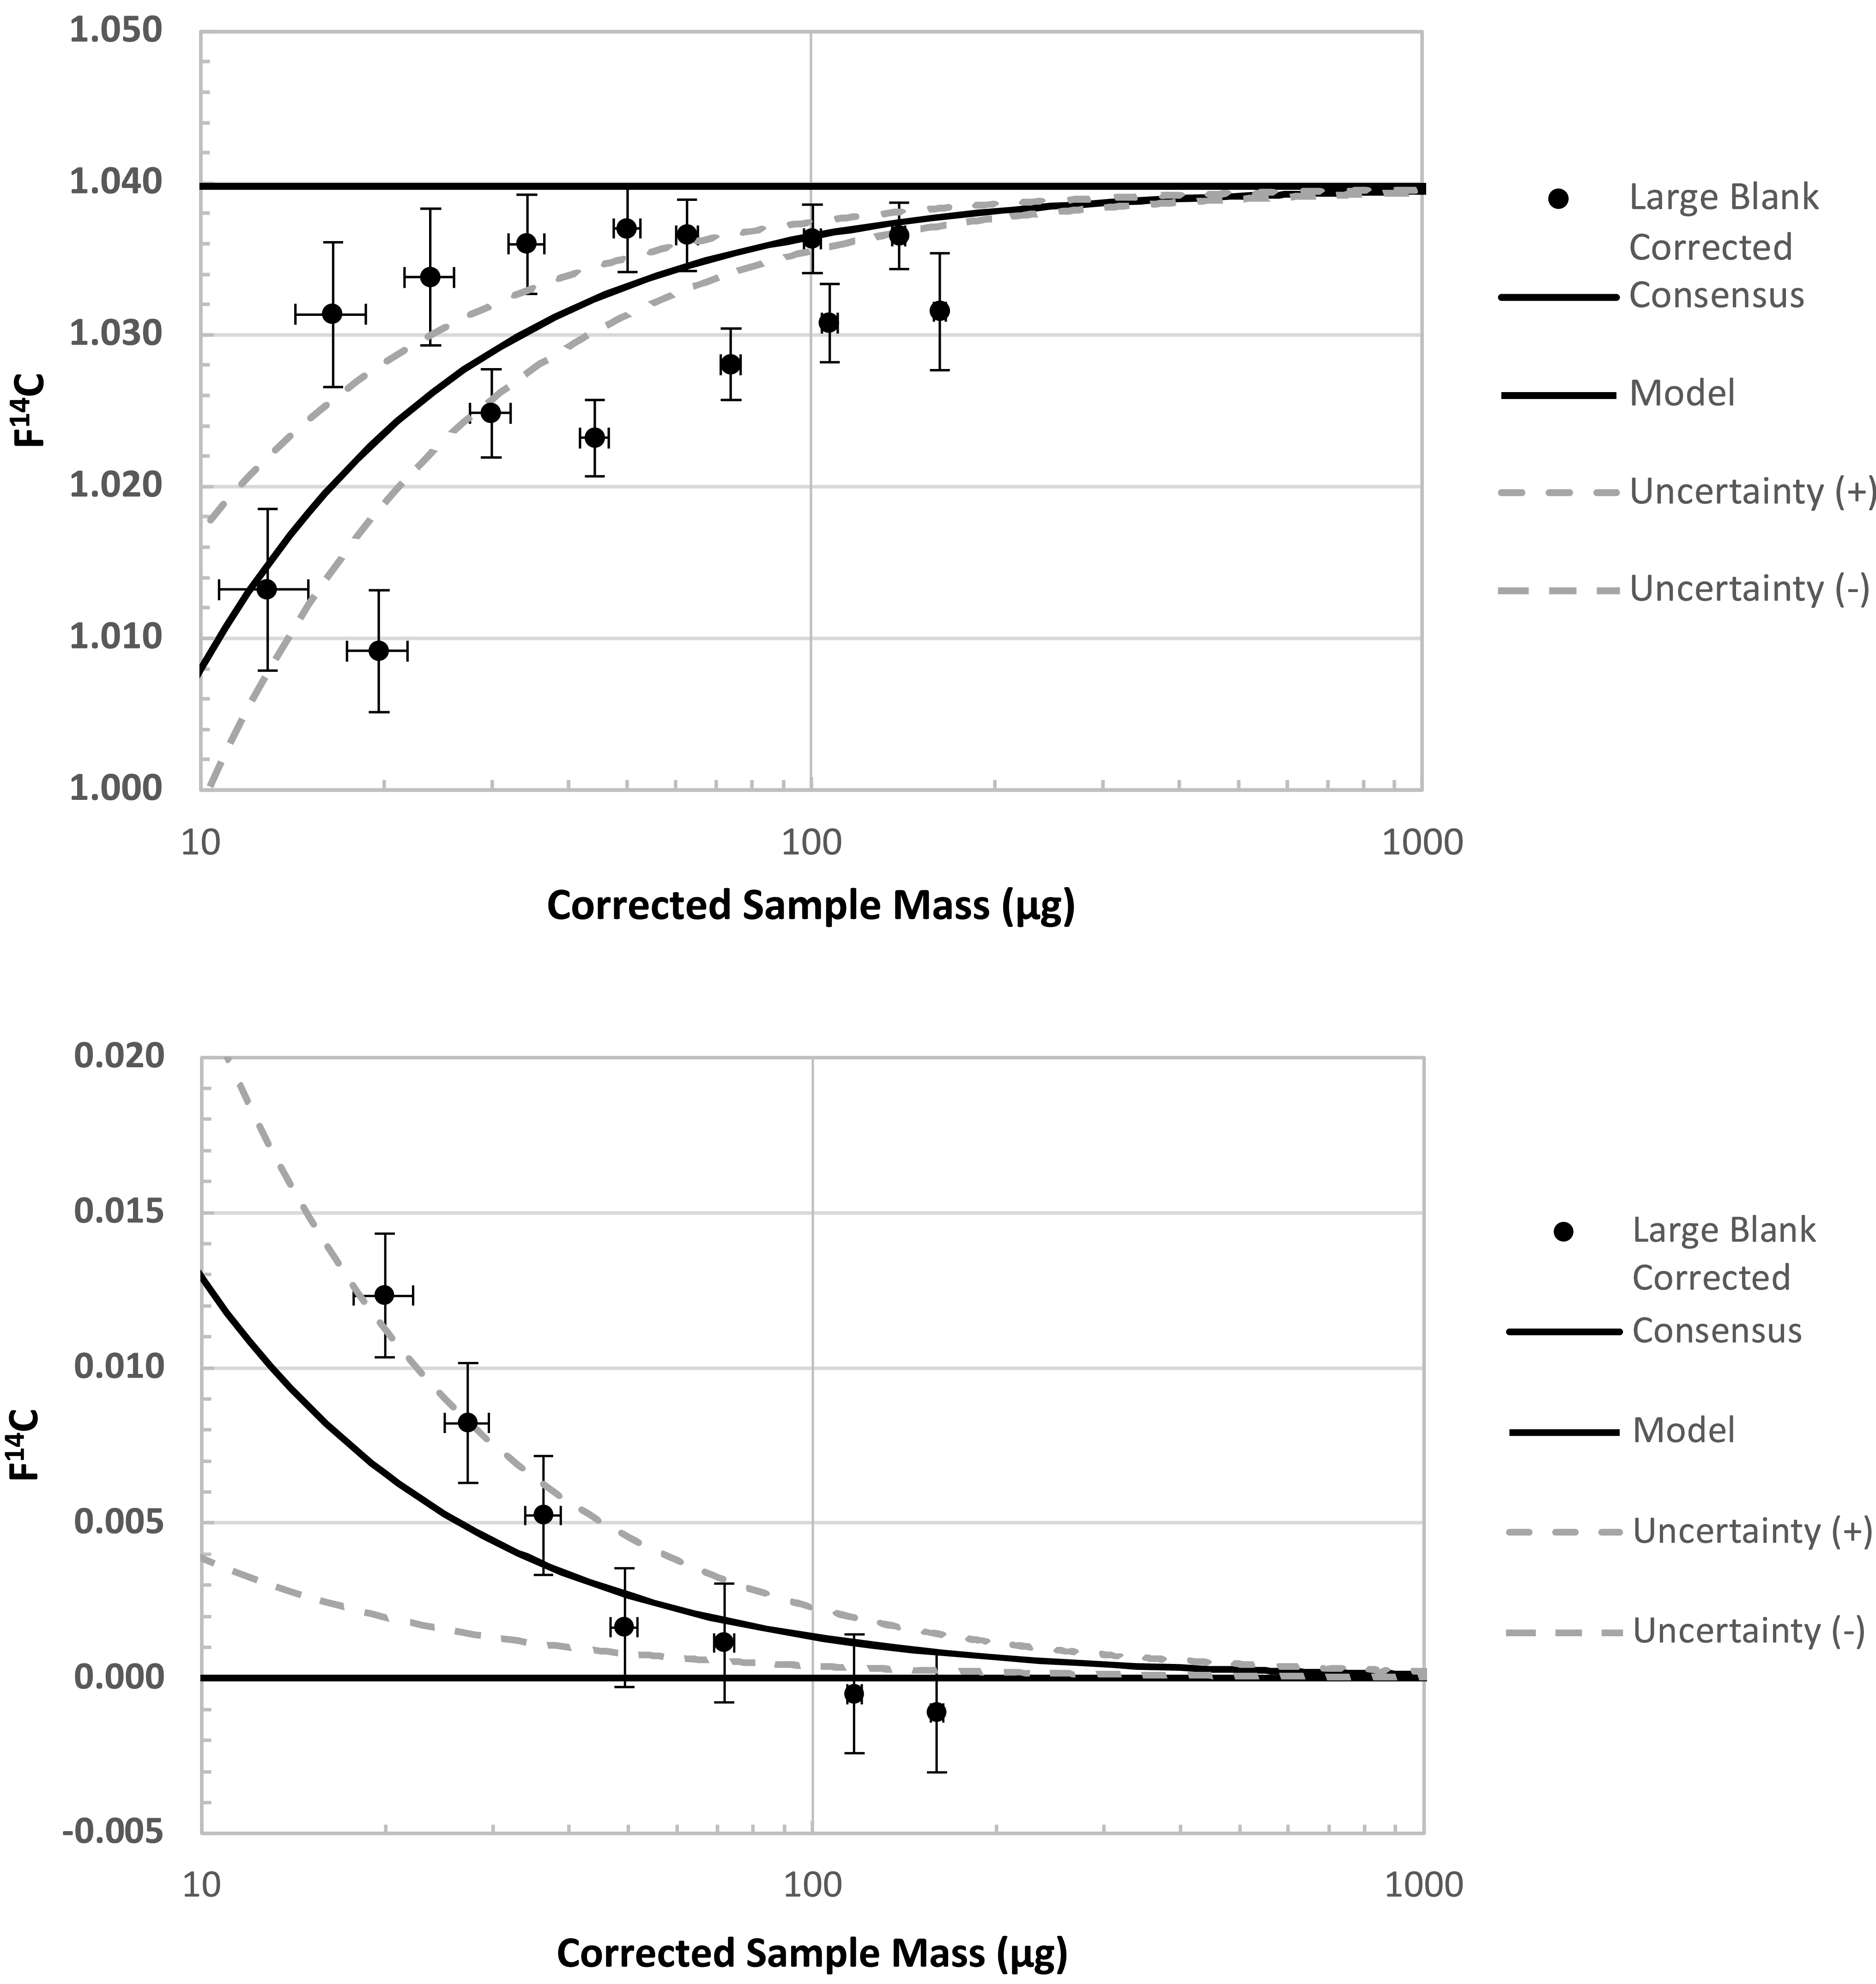
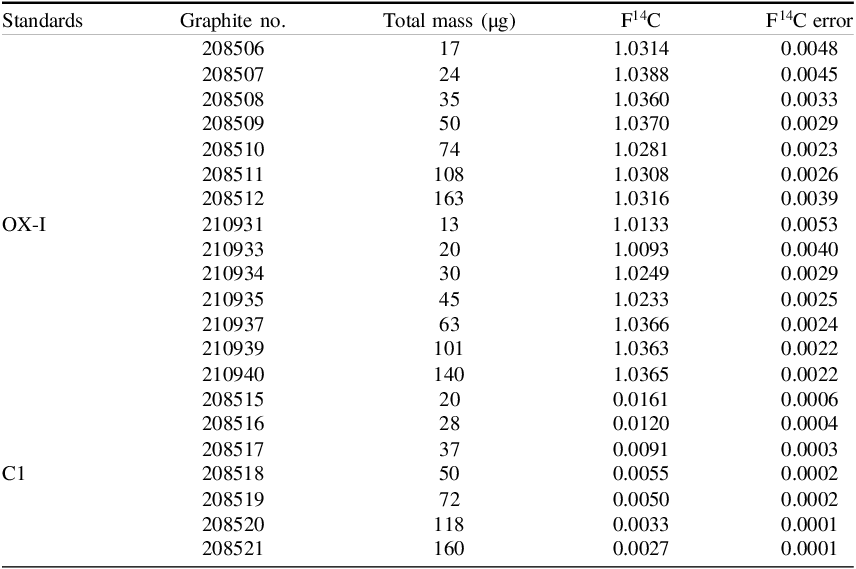
As expected, deviations of the CO2 generated from OX-I and IAEA-C1 are larger at smaller sample sizes, highlighting the influence of the blank (Figure 2; Table 1). Using the best-fit procedure as described in Hanke et al. (Reference Hanke, Wacker, Haghipour, Schmidt, Eglinton and McIntyre2017) and Roberts et al. (Reference Roberts, Elder, Jenkins, Gagnon, Xu, Hlavenka and Longworth2019), the modeled estimate for the procedural blank is 0.45 ± 0.10 µg C, with F14C of 0.30 ± 0.20. The values are very close to our current blank for gas samples (mass of 0.43 ± 0.10 µg C, F14C = 0.30 ± 0.10), indicating the addition of the H2S trap does not substantially alter the process blank. Modern and 14C-free materials were alternated through the trap (i.e., size series of OX-I, then C1, then OX-I) to confirm that the H2S removal trap exhibited no carryover effect between samples.
Aliquots of OX-1 (upper) and IAEA-C1 (lower) processed as gas via the H2S trap method described here. Individual samples are corrected for the blanks associated with graphitization and AMS analysis, but not for the processing blanks. Deviations from expected values at lower sample mass sizes highlight the influence of the blank.

Data of blank test with CO2 from OX-I and C1.

3.2. Stable isotope fractionation tests
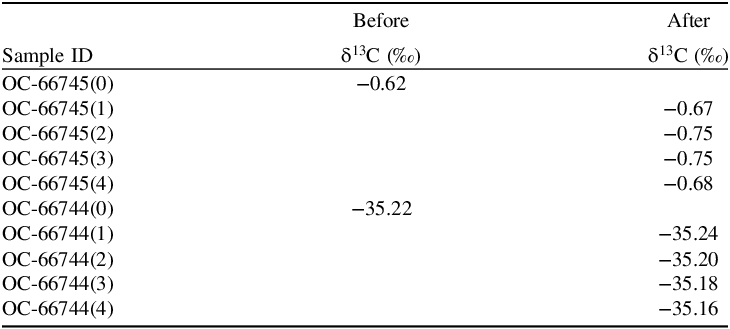
The two USGS isotope standards bracket the majority of the δ 13C values processed in our lab. Table 2 presents the δ 13C values determined from the unaltered splits, and after each split was processed through the method. The δ 13C values of the splits processed through the H2S stripping method were not significantly different from the δ 13C values determined without processing.
Certified δ13C reference materials USGS 61 (caffeine, OC-66745, –0.67‰) and USGS 66 (glycine, OC-66744, –35.05‰) were oxidized to CO2 and aliquoted to individual splits of 12 to 36 µg each. The δ13C of one split was analyzed without further processing. The δ13C of the 4 additional splits were analyzed after processing through the H2S stripping method.

3.3. Radiocarbon measurement results
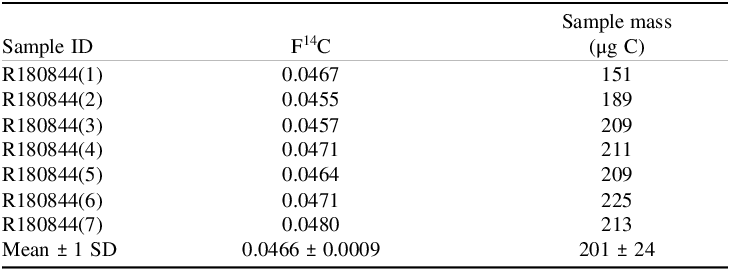
A homogenized hydrothermal sample with elevated H2S was split into 7 replicate aliquots to assess the reproducibility of the processing method, resulting in F14C of 0.0466 ± 0.0009 (Table 3). The scatter in the data is lower than the propagated error of the analysis that incorporates the uncertainty of the processing blank which, for samples of this size and age, would be slightly more than 1 per mil.
Multiple hydrothermal fluid samples from Ringvent (Guaymas Basin) were combined, homogenized, filtered, then aliquoted and analyzed as 7 separate samples.

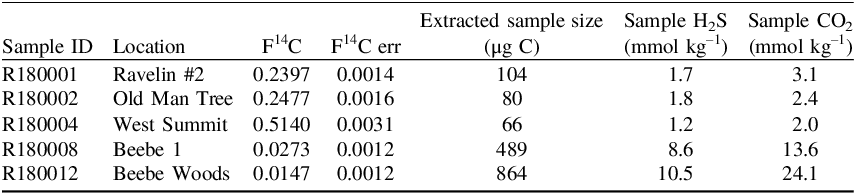
As a final test that the method could robustly remove H2S and produce graphite, 5 samples collected from different hydrothermal vent fluids on the mid-Cayman Rise were processed through the method (Table 4). The samples contained H2S concentrations ranging from 1.7 to 10.5 mmol kg–1. All samples processed by the method presented here were successfully reduced to graphite and analyzed by AMS.
Analyzed hydrothermal vent fluid samples from the mid-Cayman Rise.

3.4 Discussion of method application
As a facility, we frequently receive groundwater DIC samples for 14C and 13C analysis that have unknown concentrations of sulfide, but its presence is easily identified by smell. In the past, we would extract the DIC from these samples via water stripping (McNichol et al. Reference McNichol, Jones, Hutton, Gagnon and Key1994) then proactively combust the extracted CO2 with copper oxide and silver foil to help remove sulfide and clean the gas for graphitization. While this often led to successful H2 reduction of the sample CO2, at times graphitization reactions still did not proceed as expected. We would attempt a second combustion step that was usually then sufficient to reduce the sample, but this extra manipulation could fractionate the CO2 and affect the resulting δ13C analysis. At NOSAMS, however, the biggest issue was that the failed reductions to graphite affected not only the sample in question but often carried over and poisoned subsequent reduction reactions of routine samples that were carried out on the same automated graphitization systems. So it was critical for our operations to develop a proactive method for removing H2S from samples that did not alter the 14C and 13C composition of the sample. We tested the method for samples collected from hydrothermal vent systems that had significant known amounts of sulfide in them and had success in reducing cleaned sample CO2 in all cases, but we did not attempt to reduce these samples without cleaning to avoid the potential impact on our routine operations. We err on the side of caution and use this method for any samples in which the presence of sulfide is known (i.e., measured prior to sample submission), detected (by smell), or expected due to its collection environment. The additional sulfide removal step is manual and requires approximately one day to process 10 samples.
Silver nitrate is a strong oxidizer, so preparation of the acidified solution should observe all necessary safety precautions as indicated in the Material Safety Data Sheet. Silver sulfide that collects on the internal glass wall or at the frit in the trap during sample processing can be removed by soaking in nitric acid to regenerate the trap. Helium flow rate and pressure in the system should be monitored to determine when Ag2S buildup needs to be cleaned as the amount deposited will depend on sample sulfide concentrations.
4. Conclusion
We have presented a method utilizing acidified silver nitrate solution for the removal of H2S during the analysis of CO2 gas or aqueous DIC. With this H2S removal, CO2 is easily reduced to graphite with hydrogen and can be successfully analyzed by AMS. The blank associated with the additional H2S trap is small and thus the processing blank of the method of 0.45 ± 0.10 µg C, with F14C of 0.30 ± 0.20, does not differ substantially from the processing blank of a routine gas or DIC measurement.
Acknowledgments
This effort was supported by NSF NOSAMS cooperative agreement OCE 2244731. We thank other members in NOSAMS for their support in the process. The Ringvent hydrothermal fluid DIC samples were collected during Cruise RR2107 on the R/V Roger Revelle with AUV Sentry and ROV Jason, which was supported by NSF OCE OTIC 1842053. R.L. Harris was supported by NASA under PSTAR grant NNX17AB31G and the NASA Postdoctoral Management Program through the Astrobiology Program at NASA Headquarters, administered by Oak Ridge Associated Universities under contract with NASA. We thank the captain and crew of the R/V Atlantis and the ROV Jason II team. Funding for the cruise used to collect the mid-Cayman Rise hydrothermal samples provided by National Science Foundation grant OCE-1801036 to S.Q.L. and OCE-1801205 to J.S.S.