Implications
Balancing diets for transition dairy cows is a challenge because of limitations in our ability to delineate basic responses and interactions between energy and protein during the periparturient period. The present review reveals that the liver's use of amino acids (AA) in the post partum transition period in general does not respond to decreased glucose status of the cows. Therefore, no amino acid sparing effect can be obtained by feeding more glucogenic diets to post partum transition dairy cows. AA seem to be prioritised for anabolic purposes, and hence it is relevant to investigate effects of supplying additional protein to post partum dairy cows.
Introduction
The whole body demand for glucose and amino acids (AA) increases abruptly at parturition when mammary synthesis of lactose and protein increases from virtually zero to around 1 kg/day of each within a few days after parturition (Bertics et al., Reference Bertics, Grummer, Cadorniga-Valino and Stoddard1992; Reynolds et al., Reference Reynolds, Aikman, Lupoli, Humphries and Beever2003). The concomitant increase in feed intake is not sufficient to meet the increased demand for nutrients (Ingvartsen and Andersen, Reference Ingvartsen and Andersen2000; Drackley et al., Reference Drackley, Overton and Douglas2001). With respect to the rapidly increasing glucose demand in post partum transition cows, it has been hypothesised that the glucose supply is supported by increased utilisation of glucogenic AA for liver gluconeogenesis (Overton, Reference Overton1998; Drackley et al., Reference Drackley, Overton and Douglas2001). Moreover, investigations of liver uptake of glucogenic precursors have generally included few or no AAs, and combined with an inability to account for all liver glucose release by equivalent uptakes of glucogenic precursors, it is tempting to suggest that AAs contribute to the lacking glucogenic carbon (Danfær et al., Reference Danfær, Tetens and Agergaard1995). Nevertheless, this concept has been questioned in quantitative investigations using splanchnic-catheterised periparturient dairy cows (Reynolds et al., Reference Reynolds, Aikman, Lupoli, Humphries and Beever2003; Larsen and Kristensen, Reference Larsen and Kristensen2009a).
The objective of the present work was to review the recently available quantitative data on liver metabolism of glucose, AAs and other glucogenic precursors in the periparturient period, with the aim of unravelling the dynamics of precursor supply for liver glucose release during this distinct period of the lactation–reproduction cycle.
Methodological considerations
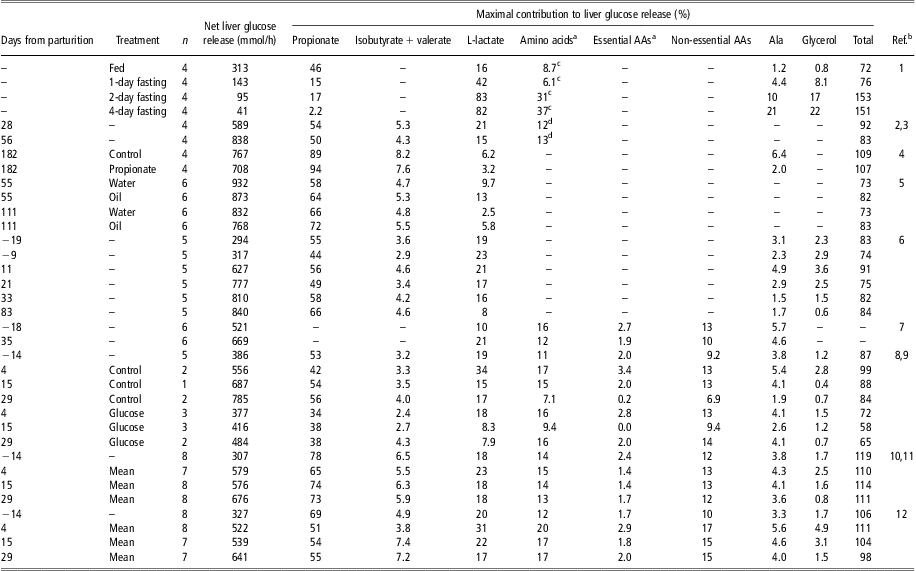
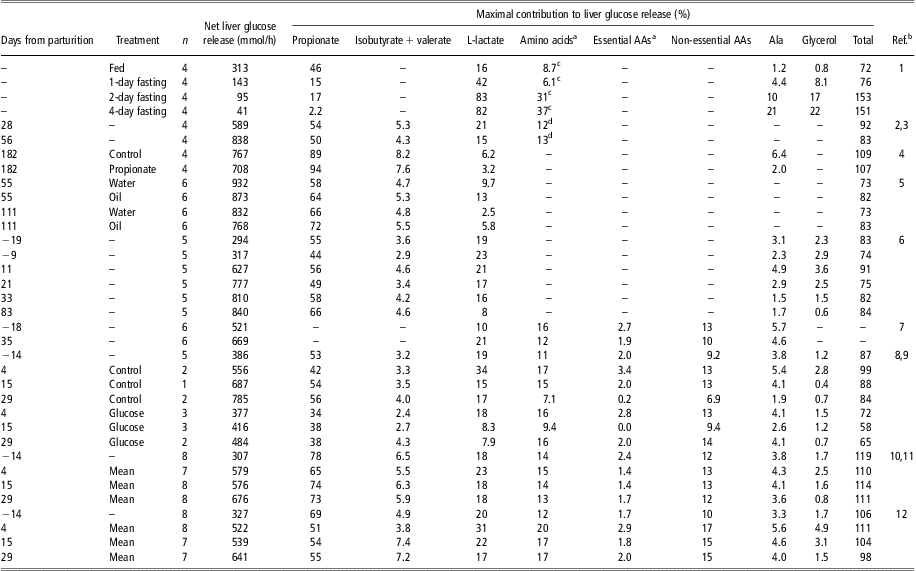
The data used in the review are presented in Table 1 and comprise studies using dairy cows catheterised in major splanchnic vessels, allowing measurement of net nutrient fluxes across the portal-drained viscera (PDV) and the liver (Katz and Bergman, Reference Katz and Bergman1969; Huntington et al., Reference Huntington, Reynolds and Stroud1989). Only studies where the major precursors for liver gluconeogenesis have been determined were included in the review. Even though Doepel et al. (Reference Doepel, Lobley, Bernier, Dubreuil and Lapierre2009) did not present data for volatile fatty acids (VFAs), the study was included as data for liver AA metabolism pre and post partum were presented. The major precursors for gluconeogenesis are the glucogenic VFA (propionate, isobutyrate and valerate), L-lactate, glycerol and glucogenic AA (Leu and Lys non-glucogenic); however, minor metabolites such as D-lactate, propanol and numerous other compounds can potentially also contribute to liver gluconeogenesis. The maximal contribution of precursors to liver glucose release presented in Table 1 was calculated as 0.5 × net liver precursor uptake × 100/net liver glucose release. This assumes that two molecules of precursor are needed for synthesis of one glucose molecule, and that all liver precursor uptakes are utilised for glucose synthesis. The latter imply that due consideration needs to be taken for other liver metabolic pathways utilising the precursor in question.
Estimates for maximal precursor contribution to net liver glucose release in dairy cows calculated from net liver uptake of precursors
aLeu and Lys are not considered glucogenic.
bReferences: 1Lomax and Baird (Reference Lomax and Baird1983); 2,3Reynolds et al. (Reference Reynolds, Huntington, Tyrrell and Reynolds1988a and Reference Reynolds, Huntington, Tyrrell and Reynolds1988b); 4Casse et al. (Reference Casse, Rulquin and Huntington1994); 5Benson et al. (Reference Benson, Reynolds, Aikman, Lupoli and Beever2002); 6Reynolds et al. (Reference Reynolds, Aikman, Lupoli, Humphries and Beever2003); 7Doepel et al. (Reference Doepel, Lobley, Bernier, Dubreuil and Lapierre2009); 8,9Larsen and Kristensen (Reference Larsen and Kristensen2009a and Reference Larsen and Kristensen2009b); 10,11Dalbach et al. (Reference Dalbach, Larsen, Raun and Kristensen2011), Raun and Kristensen (Reference Raun and Kristensen2011); 12Larsen and Kristensen (Reference Larsen and Kristensen2012).
cOnly Ala, Ser, Thr and Gln measured.
dEstimated from liver uptake of α-amino N, assuming a contribution of three carbons for each α-amino N.
Liver blood flow
It was interesting to note the inability to account for the liver glucose release by equivalent liver uptake of potential precursors in most studies (Table 1). Indeed, the sum of all potential precursor contributions should exceed 100% when all major precursors have been measured, as gluconeogenesis is not the only metabolic pathway utilising the precursors. The sheep liver has long been known to acetylate the blood flow marker para-amino hippuric acid (pAH; Katz and Bergman, Reference Katz and Bergman1969); hence, these authors concluded that deacetylation of pAH before analysis is crucial to obtain valid liver venous blood flow measurements. Such comparisons have not been published for cattle until recently, where the liver in lactating dairy cows was observed to acetylate pAH, as observed in sheep liver (Kristensen et al., Reference Kristensen, Røjen, Raun, Storm, Puggaard and Larsen2009). Liver acetylation of pAH will overestimate liver blood flow (Katz and Bergman, Reference Katz and Bergman1969; Kristensen et al., Reference Kristensen, Røjen, Raun, Storm, Puggaard and Larsen2009), and consequently liver release of nutrients will be overestimated and liver uptake of nutrients will be underestimated.
The consequence of overestimating liver glucose release and underestimating liver precursor uptake can be elucidated by comparison of total liver balance of glucogenic carbon, published by Larsen and Kristensen (Reference Larsen and Kristensen2009a and Reference Larsen and Kristensen2009b), with the data presented from that study in Table1. The data presented in Table 1 for Larsen and Kristensen (Reference Larsen and Kristensen2009b) are based on pAH analysis after deacetylation, whereas the published nutrient fluxes were not. Hence, total liver balances of glucogenic carbon for the control treatment were originally observed to be 80%, 90%, 73% and 75% at −14, +4, +15 and +29 days relative to parturition, respectively, as compared with 87%, 99%, 88% and 84% with nutrient fluxes based on deacetylated pAH (Table 1).
Data selection and analysis
As can be noted in Table 1, it is only in the studies by Larsen and Kristensen (Reference Larsen and Kristensen2009b), Raun and Kristensen (Reference Raun and Kristensen2011) and Larsen and Kristensen (Reference Larsen and Kristensen2012) that all major potential precursors, including AAs, for liver gluconeogenesis have been determined concomitantly. Hence, these data were compiled to investigate the dynamics of precursor supply for liver gluconeogenesis in the periparturient period. The three studies comprising 23 animals in total were conducted according to the same overall protocol: (1) Holstein cows entering their second lactation; (2) complete randomised design with repeated measurements; (3) treatments initiated at day of parturition and lasting 4 weeks; (4) blood sampling conducted 14 days before expected parturition and at 4 ± 0, 15 ± 1 and 29 ± 2 days after parturition. Three cows subjected to post partum abomasal glucose infusion (Larsen and Kristensen, Reference Larsen and Kristensen2009b) were excluded because of confounding effects on metabolic adaptation to lactation. Two cows were excluded because of dysfunctional hepatic or portal catheters. Thus, a total of 18 cows were included. In addition, two observations at 4 days post partum were excluded because of retained placenta, also inducing abnormal metabolic adaptations to lactation.
The compiled data were subjected to statistical analysis with a model including the fixed effects of experiment, day relative to parturition and the interaction. Cows within experimental treatment were considered as a random factor, and day relative to parturition within cows was considered as a repeated measure. Effects of linear and quadratic orthogonal polynomial contrasts (named P lin. and P quad. in Figures 1–4) of day relative to parturition were tested.
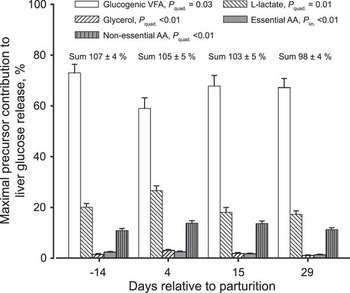
Maximal contribution of potential precursors to liver glucose release in 18 Holstein cows during the transition from pregnancy to lactation. Each data point is the mean of 18 observations ± s.e.m. obtained from studies by Dalbach et al. (Reference Dalbach, Larsen, Raun and Kristensen2011), Larsen and Kristensen (Reference Larsen and Kristensen2009a and Reference Larsen and Kristensen2009b), Larsen and Kristensen (Reference Larsen and Kristensen2012) and Raun and Kristensen (Reference Raun and Kristensen2011). Linear and quadratic orthogonal polynomial contrasts (P lin. and P quad.) of day relative to parturition were tested.

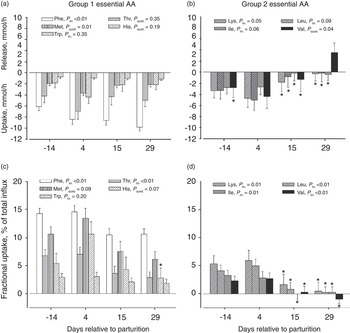
Liver net flux (a, b) and fractional uptake (c, d) of essential amino acids, subdivided into groups 1 and 2 (Lapierre et al., Reference Lapierre, Berthiaume, Raggio, Thivierge, Doepel, Pacheco, Dubreuil and Lobley2005). A positive flux indicates net liver release and negative flux indicates net liver uptake. Liver fractional uptake is calculated as the net liver flux as percent of total liver influx (sum of net portal-drained visceral and arterial influx). Each data point is the mean of 18 observations ± s.e.m. obtained from studies by Dalbach et al. (Reference Dalbach, Larsen, Raun and Kristensen2011), Larsen and Kristensen (Reference Larsen and Kristensen2009a and Reference Larsen and Kristensen2009b), Larsen and Kristensen (Reference Larsen and Kristensen2012), and Raun and Kristensen (Reference Raun and Kristensen2011). Linear and quadratic orthogonal polynomial contrasts (P lin. and P quad.) of day relative to parturition were tested. Asterisks indicate no difference from zero (P ⩾ 0.10).

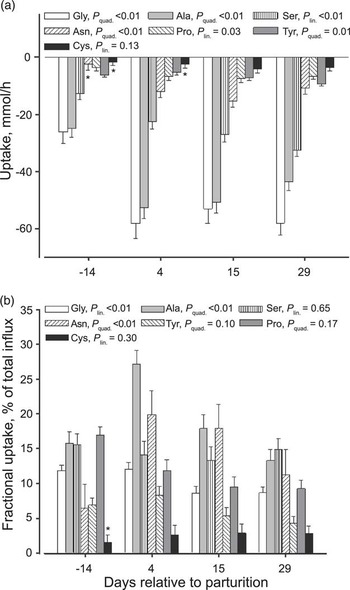
Liver net uptake (a) and fractional uptake (b) of non-essential amino acids. Liver fractional uptake is calculated as the net liver flux as percent of total liver influx (sum of net portal-drained visceral and arterial influx). Net liver releases of Asp, Gln and Glu were observed, and thus not presented. Each data point is the mean of 18 observations ± s.e.m. obtained from studies by Dalbach et al. (Reference Dalbach, Larsen, Raun and Kristensen2011), Larsen and Kristensen (Reference Larsen and Kristensen2009a and Reference Larsen and Kristensen2009b), Larsen and Kristensen (Reference Larsen and Kristensen2012), and Raun and Kristensen (Reference Raun and Kristensen2011). Linear and quadratic orthogonal polynomial contrasts (P lin. and P quad.) of day relative to parturition were tested. Asterisks indicate no difference from zero (P ⩾ 0.10).

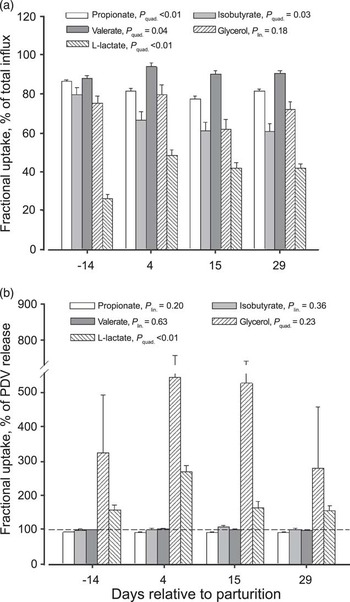
Liver fractional uptake of propionate, isobutyrate, valerate, glycerol and L-lactate as percent of total liver influx (a; sum of net portal-drained visceral (PDV) and arterial influx) and of net PDV release (b). Each data point is the mean of 18 observations ± s.e.m. obtained from studies by Larsen and Kristensen (Reference Larsen and Kristensen2009a and Reference Larsen and Kristensen2009b), Larsen and Kristensen (Reference Larsen and Kristensen2012), and Raun and Kristensen (Reference Raun and Kristensen2011). Linear and quadratic orthogonal polynomial contrasts (P lin. and P quad.) of day relative to parturition were tested.

Liver uptake of glucogenic AA
Quantitative measurements
The quantitative data on liver glucose release and propionate uptake in the compiled data set emphasise the immediate post partum lack of exogenous carbon from VFA to liver gluconeogenesis. The liver release of glucose increased rapidly from pre partum to 4 days post partum (+64%), followed by a less rapid increase to 29 days post partum (P quad. = 0.03; 348, 571, 609 and 701 ± 23 mmol/h at –14, +4, +15 and +29 days relative to parturition, respectively). The concomitant liver uptake of propionate did not follow a pattern similar (P quad. = 0.82) to that of liver glucose release and was just increased by 35% from pre partum to 4 days post partum. Thus, the liver propionate uptake increased in a linear manner from pre partum to 29 days post partum (P lin. < 0.01; 465, 628, 748 and 854 ± 55 mmol/h at –14, +4, +15 and +29 days relative to parturition, respectively). Reynolds et al. (Reference Reynolds, Aikman, Lupoli, Humphries and Beever2003) observed similar patterns of liver glucose release and propionate uptake in the first published study using the splanchnic flux model to address the liver balance of glucogenic carbon in periparturient dairy cows (Table 1). With respect to AAs, Reynolds et al. (Reference Reynolds, Aikman, Lupoli, Humphries and Beever2003) measured liver uptake of Ala, and in line with the role of Ala as an inter-organ transporter of α-amino groups from catabolised AAs, the study found evidence of an increased contribution of Ala to liver glucose synthesis at 11 days post partum compared with pre partum and later in lactation. As typically observed, Reynolds et al. (Reference Reynolds, Aikman, Lupoli, Humphries and Beever2003) were unable to account for total net liver release of glucose by uptake of glucogenic precursors (Table 1), and indeed AAs other than Ala could have provided the lacking glucogenic carbon, as Ala was the only AA measured.
Considering essential AAs (EAA) together definitely mask differences among individual AA in periparturient pattern of liver uptake (Figure 2a and b); however, less emphasis will be paid to the individual AA in consequence of the aim of the review.
The liver uptake of EAA taken together was indeed greatest at 4 days post partum (P quad. = 0.04), but when considering the magnitude of total liver EAA uptake in the periparturient period (27, 44, 22 and 18 ± 7 mmol/h at –14, +4 +15 and +29 days relative to parturition; Figure 2a and b) it becomes evident that the potential quantitative contribution with glucogenic carbon is of minor importance. Further, the liver uptake of non-glucogenic Leu and Lys (Figure 2b) has to be subtracted resulting in even less glucogenic carbon from EAA potentially available for liver glucose synthesis. Considering the maximal relative net contribution of glucogenic EAA to liver glucose release gives further evidence to the limited quantitative importance of EAAs as glucogenic precursors, as these could maximally account for 2.4%, 2.5%, 1.7% and 1.3% ± 0.3% of the net liver glucose release at −14, +4, +15 and +29 days relative to parturition, respectively (Table 1; Figure 1). As mentioned previously, Reynolds et al. (Reference Reynolds, Aikman, Lupoli, Humphries and Beever2003) did not measure AAs other than Ala; nevertheless, the authors concluded that the study did not provide evidence for a substantial contribution of unmeasured precursors, including AAs other than Ala, to liver glucose synthesis, as no lack of glucogenic carbon was observed when calculating on an incremental basis. Further, other liver pathways utilising EAAs need to be considered when evaluating the maximal contribution of EAAs to liver gluconeogenesis as mentioned in under methodological considerations. The extent to which the EAAs taken up by the liver were actually utilised for gluconeogenesis is in fact unknown and would require use of isotope tracer studies, as conducted for some non-EAAs by Bergman and Heitmann (Reference Bergman and Heitmann1978). Taking the numerous metabolic pathways utilising EAAs for anabolic purposes, for example, synthesis of export proteins (Bender, Reference Bender1985) and post partum liver growth (Gibb et al., Reference Gibb, Ivings, Dhanoa and Sutton1992; Reynolds et al., Reference Reynolds, Durst, Lupoli, Humphries and Beever2004), these would likely leave very little EAAs for gluconeogenesis on a net basis.
In contrast to the EAAs, the non-EAAs could potentially be of greater quantitative importance to the liver balance of glucogenic carbon as the liver uptake of total non-EAAs was substantially greater in the periparturient period (41, 107, 108 and 132 ± 16 mmol/h at –14, +4, +15 and +29 days relative to parturition). Thus, the non-EAAs could maximally account for 11%, 14%, 14% and 11% ± 0.9% of the net liver glucose release at −14, +4, +15, and +29 days relative to parturition, respectively (Table 1; Figure 1). Considering the individual non-EAAs (Figure 3a), the liver uptake of Gly, Ala and Ser was quantitatively most important. The summed liver uptake of Ala, Gly and Ser comprised 73% ± 3% of the liver uptake of glucogenic AA during the periparturient period (Larsen and Kristensen, Reference Larsen and Kristensen2009a and Reference Larsen and Kristensen2012; Dalbach et al., Reference Dalbach, Larsen, Raun and Kristensen2011), in reasonable agreement with the 60% to 70% observed with dairy cows in established lactation (Bach et al., Reference Bach, Huntington, Calsamiglia and Stern2000; Blouin et al., Reference Blouin, Bernier, Reynolds, Lobley, Dubreuil and Lapierre2002; Berthiaume et al., Reference Berthiaume, Thivierge, Patton, Dubreuil, Stevenson, McBride and Lapierre2006) and sheep (Bergman and Heitmann, Reference Bergman and Heitmann1978). In consequence of the greater liver uptake of Gly, Ala and Ser compared with other non-EAAs and EAAs, the contribution of Ala, Gly and Ser to liver gluconeogenesis could be of quantitative importance in the periparturient period. However, assessment of the true contribution requires tracer studies. Bergman and Heitmann (Reference Bergman and Heitmann1978) compiled a number of their own studies where the contribution of a number of non-EAAs to liver glucose release in sheep was measured both as maximal contributions on the basis of net liver fluxes and by [14C] enrichment of glucose, following infusion of [14C] labelled AA. Using the data on isotope transfer to glucose, Bergman and Heitmann (Reference Bergman and Heitmann1978) observed low rates of transfer of carbon from AAs other than Ala and Gln, as compared with transfer rates calculated as maximal contributions. In liver slices from euglycaemic or hypoglycaemic sheep, Ala conversion to glucose was observed to increase more, as compared with the conversion of propionate to glucose when sheep were hypoglycaemic (Overton et al., Reference Overton, Drackley, Ottemann-Abbamonte, Beaulieu, Emmert and Clark1999).
AAs in circulating peptides and the plasma-free AAs not analysed (Arg, Cit, and Orn) could potentially have contributed to liver gluconeogenesis. However, Larsen and Kristensen (Reference Larsen and Kristensen2009a and Reference Larsen and Kristensen2012) observed the liver uptake of nitrogen in ammonia and AAs to account for 99% to 124% of the liver release of urea nitrogen, indicating limited quantitative catabolism of other nitrogenous compounds.
Metabolic control
It has been discussed as to whether the liver is exerting a responder or a controller function with respect to AA levels in circulating blood, and it has been concluded that under steady-state and non-steady-state conditions the liver exerts a responder function with respect to AA concentrations (Reynolds, Reference Reynolds2002; Lobley and Lapierre, Reference Lobley and Lapierre2003). In other words, the fractional liver uptake of AAs has been observed to be fairly constant over a range of AA concentrations in arterial blood induced by both variation in dietary protein supply and acute infusions resembling postprandial patterns. Regarding the periparturient dairy cow, circulating levels of AAs are decreased, following initiation of mammary lactogenesis (Doepel et al., Reference Doepel, Lapierre and Kennelly2002; Dalbach et al., Reference Dalbach, Larsen, Raun and Kristensen2011). Nevertheless, fractional liver uptakes of EAAs were not constant during the periparturient period, but were changing from greater to lower levels as lactation established (Figure 2c and d). For example, it was interesting to note substantial liver uptake of Lys, Leu, Ile and Val both at −14 and +4 days relative to parturition (Figure 2b), as little to no liver uptake is normally observed for these AAs in established lactation (Lapierre et al., Reference Lapierre, Berthiaume, Raggio, Thivierge, Doepel, Pacheco, Dubreuil and Lobley2005). Actually, the liver EAA metabolism observed at +15 and +29 days post partum was similar to that normally observed (Lapierre et al., Reference Lapierre, Berthiaume, Raggio, Thivierge, Doepel, Pacheco, Dubreuil and Lobley2005), showing liver uptake of Phe, Thr, Met, His and Trp, and little to none liver uptake of Lys, Leu, Ile and Val.
On the basis of the previous view points of liver function in relation to AA supply (Reynolds, Reference Reynolds2002; Lobley and Lapierre, Reference Lobley and Lapierre2003), it may be surprising that the fractional liver uptake of EAAs was changing during the periparturient period. However, adaptation of metabolism to lactation involves a range of both anabolic and catabolic hormones (Ingvartsen and Andersen, Reference Ingvartsen and Andersen2000) that alter metabolism to a new equilibrium, allowing a greater amount of nutrients for milk synthesis (Bauman, Reference Bauman2000). Thus, the observations on fractional uptake of AAs in the periparturient period indicate that the signals involved in adaptation of AA metabolism to lactation influence liver metabolic pathways.
The periparturient changes in fractional liver uptake of Ala, Gly and Ser differed among these AAs (Figure 3b), as the fractional uptake was greatly increased at 4 days post partum for Ala (P quad. < 0.01), whereas it decreased from pre partum to 29 days post partum for Gly (P lin. < 0.01), but remained constant in the period for Ser (P lin. = 0.65). Early studies with intravenous glucagon infusion to sheep have provided evidence that glucagon: (1) does not increase liver uptake of EAA; (2) increase liver uptake of Ala, Gly and Gln, as well as of L-lactate (Brockman et al., Reference Brockman, Bergman, Joo and Manns1975); and (3) increase the utilisation of Ala for hepatic gluconeogenesis (Brockman and Bergman, Reference Brockman and Bergman1975). In dairy cows, She et al. (Reference She, Hippen, Young, Lindberg, Beitz, Richardson and Tucker1999) observed increased glucogenic status and indications of reduced AA availability for milk synthesis in response to glucagon injections 21 to 35 days post partum. However, glucagon treatment in the study by She et al. (Reference She, Hippen, Young, Lindberg, Beitz, Richardson and Tucker1999) was initiated when the post partum metabolic adaptations have essentially occurred (Drackley et al., Reference Drackley, Overton and Douglas2001). In post partum transition cows, glucagon injections have been observed to increase the glucogenic status of cows with high body condition scoring (Nafikov et al., Reference Nafikov, Ametaj, Bobe, Koehler, Young and Beitz2008; Osman et al., Reference Osman, Allen, Bobe, Coetzee, Abuzaid, Koehler and Beitz2010). Yet, to which extent glucagon is directly involved in changing liver AA metabolism is uncertain as the periparturient pattern of circulating concentrations of glucagon is not well described. However, available data indicate that circulating concentrations in essence do not change from late pregnancy to the first few days after parturition, followed by an increase as lactation is progressing (Herbein et al., Reference Herbein, Aiello, Eckler, Pearson and Akers1985; Holtenius et al., Reference Holtenius, Olsson and Björkman1993; Osman et al., Reference Osman, Allen, Bobe, Coetzee, Abuzaid, Koehler and Beitz2010; Park et al., Reference Park, Shirley, Titgemeyer, Cochran, DeFrain, Wickersham and Johnson2010). Thus, periparturient changes in glucagon levels do not appear to be directly involved in the rapid post partum increase in liver glucose release (Table 1), but may be linked to the reduced insulin : glucagon ratio caused by the decreased circulating insulin level associated with parturition (Aschenbach et al., Reference Aschenbach, Kristensen, Donkin, Hammon and Penner2010).
Liver uptake of glucogenic VFA
The glucogenic VFAs are propionate, isobutyrate and valerate (Bergman, Reference Bergman1990). The contribution of glucogenic VFA to liver glucose release is in the range of 44% to 78% for most studies (Table 1), and propionate typically represents 90% to 95% of the VFA contribution. In the study by Casse et al. (Reference Casse, Rulquin and Huntington1994), liver uptake of glucogenic VFA could account for about 100% of the liver glucose release; however, the net liver VFA fluxes were relatively higher compared with the other studies and there was no obvious explanation for the discrepancy. The estimates for the contribution of propionate to glucose calculated from net liver uptake of glucogenic VFA are similar to estimates obtained with the isotope technique in steers (Veenhuizen et al., Reference Veenhuizen, Russell and Young1988), lactating dairy cows (Amaral et al., Reference Amaral, Veenhuizen, Drackley, Cooley, McGilliard and Young1990) and goats (Danfær et al., Reference Danfær, Tetens and Agergaard1995). As outlined previously, the liver net uptake of propionate increases from pre partum to post partum and continues to increase as feed intake increases (Reynolds et al., Reference Reynolds, Aikman, Lupoli, Humphries and Beever2003; Larsen and Kristensen, Reference Larsen and Kristensen2009a and Reference Larsen and Kristensen2012; Raun and Kristensen, Reference Raun and Kristensen2011). Despite this, the immediate post partum increase in propionate supply is not sufficient to support the increased liver release of glucose, and hence the liver release of glucose seem to be relatively more dependent on lactate in the immediate post partum period (Table 1; Figure 1).
The liver uptake of propionate relative to the net release from the PDV, comprising the fore stomachs and intestines, has been observed to be high around 90% to 95% (Reynolds et al., Reference Reynolds, Aikman, Lupoli, Humphries and Beever2003; Figure 4b) as also observed in established lactations and other ruminants (Reynolds et al., Reference Reynolds, Huntington, Tyrrell and Reynolds1988a; Bergman, Reference Bergman1990; Benson et al., Reference Benson, Reynolds, Aikman, Lupoli and Beever2002). Further, the liver propionate uptake relative to net PDV release was relatively constant during the periparturient period (P lin. = 0.20; P quad. = 0.74; Figure 4b). This indicates that no major change in liver affinity for propionate uptake is participating in post partum adaptation of glucose metabolism. Though, the fractional liver uptake of total propionate influx (sum of net PDV and arterial influx) decreased 5% units from pre partum to 4 days post partum (P quad. < 0.01; Figure 4a). A similar decrease in fractional liver propionate uptake from pre partum to 11 days post partum was observed by Reynolds et al. (Reference Reynolds, Aikman, Lupoli, Humphries and Beever2003). However, the overall quantitative importance of the 5% unit decrease in fractional liver uptake of total propionate influx is limited as it equates to a reduction in liver propionate uptake of 39 mmol/h for the compiled data set. The biological mechanisms behind this are not known and several mechanisms can be involved. The relatively slow post partum increase of expression of mRNA for propionyl-CoA carboxylase and phosphoenolpyruvate carboxykinase (PEPCK) in liver tissue (Greenfield et al., Reference Greenfield, Cecava and Donkin2000; Aschenbach et al., Reference Aschenbach, Kristensen, Donkin, Hammon and Penner2010) may be limiting the liver uptake of propionate. It could also be speculated that the post partum increase in liver metabolism of non-esterified fatty acids has negative effects on liver uptake of propionate; however, Benson et al. (Reference Benson, Reynolds, Aikman, Lupoli and Beever2002) did not observe changes in liver uptake of propionate in response to increased liver uptake of non-esterified fatty acids from abomasally infused vegetable oils. Yet, this does not preclude increased non-glucogenic liver use of propionate.
Liver uptake of L-lactate
The maximal potential contribution of L-lactate to liver glucose release was in the range of 3% to 34% in fed dairy cows, with the highest values associated with late gestation and early lactation (Table 1). Lomax and Baird (Reference Lomax and Baird1983) observed lactate to maximally contribute as much as 82% to liver glucose release in cows fasted for 4 days (Table 1). The fasting situation has parallels to the immediate post partum situation where increments in feed intake lack behind increments in nutrient requirements for milk synthesis (Ingvartsen and Andersen, Reference Ingvartsen and Andersen2000). Here, the observations at 4 DIM are of particular interest, where the recycling of glucose carbon to the liver (sum of Ala, lactate and glycerol) represented approximately 40% of the liver glucose release, which emphasises the importance of this recycling in very early lactation, when feed intake has only increased slightly. Accordingly, liver glucose release seems relatively more dependent on lactate uptake in the immediate post partum period (Table 1; Figure 1), likely originating from the lactic acid (Cori) cycle as also proposed by Reynolds et al. (Reference Reynolds, Aikman, Lupoli, Humphries and Beever2003). Indeed, the extent to which lactate taken up by the liver was actually utilised for gluconeogenesis is unknown and would require use of isotope-tracer studies. However, combining data from other experimental techniques with net splanchnic flux data provides substantial support of the post partum dependence of Cori cycling of glucogenic carbon.
Regulation of liver lactate uptake
Pyruvate carboxylase (PC), pyruvate dehydrogenase and PEPCK are the key enzymes in regulating the diversion of pyruvate and oxaloacetate to either the citric acid (Krebs) cycle or gluconeogenesis in liver tissue (Aschenbach et al., Reference Aschenbach, Kristensen, Donkin, Hammon and Penner2010; Loor, Reference Loor2010). The mRNA expression and activity of PC in liver tissue have been found to increase rapidly during the very first few days of lactation, whereas PEPCK mRNA was found to increase slowly during the first 4 weeks of lactation (Greenfield et al., Reference Greenfield, Cecava and Donkin2000; Agca et al., Reference Agca, Greenfield, Hartwell and Donkin2002; Loor, Reference Loor2010). This suggests that the mRNA expression for PEPCK is correlated with the increasing supply of glucogenic precursors from ruminal fermentation of ingested feed. Oxidation of fatty acids provides acetyl CoA, which stimulates the activity of PC. Thus, in situations with low levels of circulating insulin, such as in the periparturient period and during fasting, a larger proportion of pyruvate would be diverted to oxaloacetate at the expense of acetyl CoA. Therefore, the immediate increase in PC mRNA and activity after calving will increase the supply of oxaloacetate, which is the initial precursor pool for both gluconeogenesis and the Krebs cycle. A greater pool of oxaloacetate will allow both increased gluconeogenensis and metabolism of acetyl CoA from mobilised fatty acids. The increased PC activity allows a greater entry of glucogenic precursors via pyruvate to the Krebs cycle, that is, lactate and a number of glucogenic AAs, including Ala. Quantitative observations on liver fractional uptake of lactate and Ala qualify the in vitro investigations of metabolic enzymes in liver biopsies, as the fractional liver uptake of lactate and Ala was found to increase immediately post partum from pre partum levels (Figure 4a; Reynolds et al., Reference Reynolds, Aikman, Lupoli, Humphries and Beever2003). Taken together, in vivo and in vitro investigations of liver uptake of glucogenic precursors via pyruvate show an increased affinity for lactate and Ala in the immediate post partum period.
Regulation of glucose metabolism in peripheral tissue
At the level of peripheral tissue, the glucose metabolism seems to be partly shifted from complete oxidation to Cori cycling, returning glucose carbon to the liver in the post partum dairy cow. This can be evidenced by combining results from three different experimental techniques. Using proteome analysis of metabolic enzymes in muscle biopsies from periparturient dairy cows, Kuhla et al. (Reference Kuhla, Nürnberg, Albrecht, Görs, Hammon and Metges2011) observed that metabolic enzymes favouring glycolysis and lactate formation were upregulated post partum and metabolic enzymes involved in the Krebs cycle and glycogenesis were concomitantly downregulated. The shift in muscle glucose metabolism towards lactate formation in the Cori cycle over complete oxidation in the Krebs cycle can also be evidenced using net splanchnic flux data, as a decreasing proportion of liver lactate uptake could be accounted for by PDV release of lactate. Such data with dairy cows in the periparturient period were first published by Reynolds et al. (Reference Reynolds, Aikman, Lupoli, Humphries and Beever2003), and these authors observed that at 11 days post partum, liver uptake of lactate was 199% of the amount released from the PDV, as compared with 153% at 9 days pre partum and 146% 21 days post partum. Comparable data (Figure 4b) with 18 periparturient cows show that at 4 days post partum, the liver uptake of lactate was 268% of the amount released from the PDV as compared with 158% 14 days pre partum and 157% 29 days post partum. This provides support to the concept that in the immediate post partum period there is an important inter-organ transfer of glucogenic carbon via lactate from peripheral tissues to the liver.
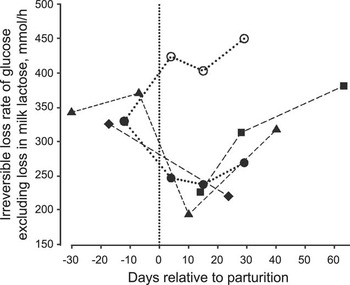
Finally, studies of irreversible loss rates of glucose during the periparturient period (Bennink et al., Reference Bennink, Mellenberger, Frobish and Bauman1972; Bruckental et al., Reference Bruckental, Oldham and Sutton1980; Baird et al., Reference Baird, Van Der Walt and Bergman1983; unpublished data from Larsen and Kristensen, Reference Larsen and Kristensen2009b) give indications of the periparturient change in prioritisation of glucose between tissue metabolism and milk lactose synthesis. Distinguishing the measured whole body irreversible loss rate of glucose into loss via milk lactose and loss via tissue metabolism, the last determined by difference, clearly show that the irreversible loss rate of glucose in tissue metabolism is decreased at initiation of lactation (Figure 5). Bennink et al. (Reference Bennink, Mellenberger, Frobish and Bauman1972) also observed the proportion of whole body irreversible loss rate of glucose completely oxidised to CO2 to decrease from 31.5% at 7 days pre partum to 8.3% at 10 days post partum, and hence the decreased irreversible loss rate of glucose in tissue metabolism may also indicate a shift towards Cori cycling of glucogenic carbon. In the study by Larsen and Kristensen (Reference Larsen and Kristensen2009b), one treatment was abomasal infusion of 1500 g/day of glucose initiated at the day of parturition. The normal drop in circulating levels of glucose was not observed with the glucose treatment and this seemed to prevent normal post partum adaptation of metabolism as discussed by Larsen and Kristensen (Reference Larsen and Kristensen2009b) and also evident in the distinctly different post partum pattern of irreversible loss rate of glucose via tissue metabolism (Figure 5).
Irreversible loss rate (ILR) of glucose in tissue metabolism during the period of transition from late pregnancy to established lactation calculated by difference between whole body ILR of glucose and glucose secreted in milk as lactose. Data are obtained from studies by Baird et al. (Reference Baird, Van Der Walt and Bergman1983; ⧫), Bennink et al. (Reference Bennink, Mellenberger, Frobish and Bauman1972; ▴), Bruckental et al. (Reference Bruckental, Oldham and Sutton1980; ▪) and unpublished data by Larsen and Kristensen (Reference Larsen and Kristensen2009b; control ●, glucose ○).

Liver uptake of glycerol
Glycerol enters the glucogenic pathway as dihydroxyacetone phosphate by action of glycerol kinase. The true contribution of glycerol to liver gluconeogenesis has not been determined; however, glycerol kinase has only been found in liver and mammary tissue, and thus other tissues are not expected to metabolise glycerol (Lin, Reference Lin1977).
The maximal potential contribution of glycerol to liver glucose was found to increase from minimal levels pre partum (<1%) to maximally 4.9% in post partum transition cows (Table 1; Figure 1), and is therefore an indicator of mobilisation of triglycerides from adipose tissue. In fact, Lomax and Baird (Reference Lomax and Baird1983) observed glycerol to maximally contribute as much as 22% to liver glucose in cows fasted for 4 days (Table 1), clearly indicating the change in metabolic fuels associated with undernutrition. However, the extent to which glycerol taken up by the liver was actually utilised for gluconeogenesis is unknown and would require use of isotope tracer studies.
The liver fractional uptake of glycerol was relatively constant during the periparturient period (P lin. = 0.18; Figure 4a) and averaged 72% ± 2%, which gives no indication of changes in liver affinity for glycerol in association with lipid mobilisation and hypoglycaemic conditions. Somewhat contrasting, Reynolds et al. (Reference Reynolds, Aikman, Lupoli, Humphries and Beever2003) observed the liver fractional uptake of glycerol to exhibit a quadratic pattern with the highest levels at 9 days pre partum and 11 days post partum. The observed liver fractional uptake of glycerol was somewhat lower (18% to 45% of total influx; Reynolds et al., Reference Reynolds, Aikman, Lupoli, Humphries and Beever2003) than the levels observed by Larsen and Kristensen (Reference Larsen and Kristensen2009a and Reference Larsen and Kristensen2012). This may be related to methodological differences between the studies, for example, deacetylation of the blood flow marker pAH.
Although not specifically related to contribution to liver gluconeogenesis, it was interesting to relate the net PDV release of glycerol to liver uptake of glycerol in an attempt to assess differences in lability of abdominal and subcutaneous adipose tissue as proposed by Larsen and Kristensen (Reference Larsen and Kristensen2008). The net PDV release of glycerol constituted 16%, 26%, 19% and 15% ± 4% of the net liver glycerol uptake at −14, +4, +15 and +29 days relative to parturition, respectively. At 4 days after parturition, net PDV glycerol release constitutes a relatively larger proportion of liver glycerol uptake (P quad. = 0.03), indicating that abdominal adipose tissue is more rapidly mobilised in periparturient dairy cows than subcutaneous adipose tissue. This conclusion assumes that all dietary glycerol is fermented within the reticulo-rumen.
Liver uptake of other glucogenic metabolites
As mentioned previously, a number of substances not discussed so far can potentially contribute carbon to liver gluconeogenesis, though these are essentially never measured. The microbial fermentation in the gastrointestinal tract produces a racemic mix of L- and D-lactate, besides VFA. Gluconeogenesis is one metabolic pathway removing D-lactate along with urinary excretion and tissue metabolism (Harmon et al., Reference Harmon, Britton and Prior1983; Ewaschuk et al., Reference Ewaschuk, Naylor and Zello2005). Small intestinal digestion of ruminal microbes will supply a number of substances that eventually could enter gluconeogenesis, for example, breakdown of microbial DNA/RNA provides deoxyribose/ribose from the nucleosides. Carbon from purines is primarily excreted in urine as allantoin and uric acid; however, pyrimidine bases are likely to be extensively degraded in the liver (Bender, Reference Bender1985) and will potentially be a source of carbon to the ruminant liver. The β-oxidation of odd-numbered fatty acids (C15 and C17) from the bacterial cell wall provides propionyl-CoA, but this is probably a minor source of glucogenic carbon. Further, pyruvate (Baird et al., Reference Baird, Lomax, Symonds and Shaw1980) and keto-acids from catabolism of certain branched-chain AAs in non-liver tissues could contribute to liver gluconeogenesis.
Although these glucogenic precursors individually would be of minor quantitative importance, taken together they may contribute a quantitatively important amount of glucogenic carbon. In support of this, the sum of maximal contributions of potential precursors (Figure 1) tended to decrease in a linear manner (P = 0.11) as lactation established, indicating an increased relative importance of glucogenic substances not measured in the studies. This could be the microbial substances mentioned in this section of which the supply will increase with post partum increased feed intake.
Conclusions
The quantitative data on liver uptake of AA do not support the hypothesis that the rapid post partum increase in net liver release of glucose and concomitant lack of exogenous glucogenic carbon from VFA is counterbalanced by increased utilisation of AA for gluconeogenesis. Consideration of available quantitative and qualitative data indicates that there is only increased contribution of Ala to liver release of glucose likely through the role of Ala in the inter-organ transfer of nitrogen from catabolised AAs. However, further investigations using tracer studies are needed to verify the actual contribution of Ala and other AAs to liver glucose release.
In consequence of the indications that AA is prioritised for anabolism, and considering data on L-lactate metabolism using quantitative and qualitative experimental techniques, the quantitatively most important adaptation of metabolism to support the increased glucose demand in the immediate post partum period is endogenous recycling of glucogenic carbon through lactate. This is mediated by a dual-site adaptation of glucose metabolism at the level of liver and at the level of peripheral tissues.
Acknowledgements
The authors wish to thank the numerous people who have been involved in the experiments with multi-catheterised transition dairy cows, none mentioned, none forgotten. Conducting this type of experiment is not trivial in general, and taking it to the periparturient period makes further challenges in particular. Funding to work with this review was provided by The Danish Council for Technology and Innovation (Copenhagen, Denmark; #10-080821), The Danish AgriFish Agency (Copenhagen, Denmark; #3412-10-02814), the Danish Cattle Federation (Aarhus Denmark), and the Ministry of Food, Agriculture and Fisheries (Copenhagen, Denmark).