

Introduction
Family firms (FFs) account for more than 60% of the world's business and are prominent in numerous innovative and entrepreneurial activities (Arregle, Chirico, Kano, Kundu, Majocchi, & Schulze, Reference Arregle, Chirico, Kano, Kundu, Majocchi and Schulze2021). Concentrating on a particular type of innovation, Esty and Winston (Reference Esty and Winston2009: 108) noted: ‘Green innovation can help you take the lead in the market while others are standing still’. This implies that the manner in which FFs influence eco-innovation can be an important question.
To address the impact of FFs on green innovation, this study is informed by agency (Yang, Shang, Li, & Lan, Reference Yang, Shang, Li and Lan2024), socioemotional wealth (SEW) (Chen, Pan, & Sinha, Reference Chen, Pan and Sinha2022), and stewardship theories (Huang, Ding, & Kao, Reference Huang, Ding and Kao2009) and is focused on the effect of the dynamics of ownership structure. This is because ownership structure influences FFs' strategy (Ducassy & Prevot, Reference Ducassy and Prevot2010; Lodh, Nandy, & Chen, Reference Lodh, Nandy and Chen2014). For ownership structure, a control deviation FFs (CDFFs) is a particular type of FF in which large shareholders use their controlling positions to influence important decisions within the company. This structure is commonly used in East Asian FFs (Claessens, Djankov, Fan, & Lang, Reference Claessens, Djankov, Fan and Lang2002; Young, Peng, Ahlstrom, Bruton, & Jiang, Reference Young, Peng, Ahlstrom, Bruton and Jiang2008). In this vein, it is worthwhile to explore the impact of CDFFs on FFs' green innovation strategy.
Recently, although researchers have already initiated discussion of the relationship between FFs and green innovation, several avenues remain underexplored. First, there is a paucity of relevant work regarding green innovation in Taiwanese firms, even though the ‘Critical Report of Chinese Family Business, 2016’ pointed out that Taiwan has the highest proportion of FFs among the three main Chinese societies in East Asia with approximately 80% of Taiwanese firms being family-controlled (Claessens, Djankov, & Lang, Reference Claessens, Djankov and Lang2000). Second, Bauweraerts, Rondi, Rovelli, De Massis, and Sciascia (Reference Bauweraerts, Rondi, Rovelli, De Massis and Sciascia2022) have made it clear that SEW actually has five dimensions – ‘family control and influence’, ‘emotional attachment of family members’, ‘identification of family members with the firm’, ‘renewal of family bonds to the firm through dynastic succession’, and ‘binding social ties’. Moreover, each dimension impacts firm policies differently. If family members use the dimensions of family identification and emotional attachment in SEW as their main reference points, they hope to ensure a positive family image. Since damage to the business reputation could jeopardize the family's image, they may emphasize green innovation to better fulfill their social responsibilities. Finally, despite the fact that prior research in the corporate governance literature gives attention to CSR committees' tendencies to offer advice and opportunities with respect to firms' sustainability actions (Gennari & Salvioni, Reference Gennari and Salvioni2019), FFs research seldom considers the moderating role played by CSR board committees on the relationship between FFs and green innovation activities.
As such, this research has two objectives. First, drawing on the multidimensional SEW as our theoretical base, we aim to determine how SEW shapes the green innovation of FFs and how specific SEW dimensions shape the green innovation of CDFFs. Second, we explore how a potential contingency – the CSR committee – affects these relationships and outcomes. To address the relationship between green innovation and FFs/CDFFs, 5,071 observations from among the listed firms in Taiwan over an eight-year period (2014–2021) were gathered and analyzed, with several hypotheses tested.
The subsequent results make several contributions. First, this study analyzes the relationship between FFs and green innovation along multiple dimensions of SEW. This study thus responds to Chen, Zhou, Zhou, Hofman, and Yang (Reference Chen, Zhou, Zhou, Hofman and Yang2022) by proposing that if the observations were one-dimensional, they might have been unduly aggregated and too homogeneous. This could turn an analysis into mixed gambles and hazardous inferences, which our study avoided. Second, while prior studies on green innovation have paid more attention to large, often multinational firms (de Azevedo Rezende, Bansi, Alves, & Galina, Reference de Azevedo Rezende, Bansi, Alves and Galina2019; Hao, Fan, Long, & Pan, Reference Hao, Fan, Long and Pan2019) there has been little work on FFs. This study thus increases diversity among studies on green innovation regarding organizational forms. Third, previous green innovation literature only considered board diversity or foreign experiences to be key factors (Asni & Agustia, Reference Asni and Agustia2022; Harjoto, Laksmana, & Lee, Reference Harjoto, Laksmana and Lee2015; Yousaf, Ullah, Jiang, & Wang, Reference Yousaf, Ullah, Jiang and Wang2022); as such, little is known about the role played by CSR committees on green innovation. We introduce a new perspective to green innovation studies by regarding the supervisory function of CSR committees in the board of directors.
Theoretical Background
Family Firms and SEW
The proportion and the contribution of family businesses in the world are quite significant. According to the ‘2023 EY and University of St. Gallen Family Business Index’, FFs grow twice as fast as advanced economies and about 1.5 times as fast as developing economies. Chen (Reference Chen2017) noted that many studies related to FFs have omitted providing a definition of ‘family’.Footnote 1 Before discussing FFs, a succinct understanding of the term ‘family’ should be established. Pearson, Carr, and Shaw (Reference Pearson, Carr and Shaw2008) have proposed three dimensions to familiness: structural, which is the construction and maintenance of networks; relational, which reflects relationships in terms of trust, obligations, and identification; and cognitive, which relates to shared vision.
Paternalism characterizes the main leadership behaviors of FFs, especially in Confucian East Asia (Hiller, Sin, Ponnapalli, & Ozgen, Reference Hiller, Sin, Ponnapalli and Ozgen2019; Mussolino & Calabrò, Reference Mussolino and Calabrò2014). In practical terms, the leader's task in an FF is to offer subordinates care, protection, and guidance in both work and nonwork fields, and in return, subordinates are expected to display their loyalty and obedience to the superior (Aycan, Reference Aycan2006). So, paternalistic leadership endows FFs' concern for SEW preservation, which is believed to be a ‘real point of reference for family decisions and behaviors’ (Sciascia, Mazzola, & Kellermanns, Reference Sciascia, Mazzola and Kellermanns2014: 132).
The concept of SEW stems from behavioral agency theory in behavioral economics. Behavioral agency theory combines elements of prospect and agency theories. It predicts that, given the accumulated value of stock options awarded to chief executive officers (CEOs) bestowed upon risk bearing (perceived wealth at risk), and given loss aversion (the preference for loss avoidance over the pursuit of gains), CEOs will be more reluctant to take risks (Tversky & Kahneman, Reference Tversky and Kahneman1978). In other words, behavioral agency theory highlights the notion that decisions are made by using relative gains and losses (instead of economic wealth) as reference points and that loss-preference behaviors are usually avoided (Liu, Qian, & Au, Reference Liu, Qian and Au2023). Paternalistic leadership is also quite important in FFs. After considering the family's affective endowments, the decision maker of FFs may prefer risk-aversion rather than profit-seeking behaviors. The fact that the decision makers of FFs assign priority to the affective endowment in familyism distinguishes the FFs' operating direction from that of a nonfamily firm. In brief, FFs are deeply affected by family-centered noneconomic goals and family affective endowments, and from this is derived the SEW dimension that noneconomic motives are greater than economic motives in FFs. The essence of family SEW is the affective endowment accumulated by the managers of FFs to protect the firm (Gomez-Mejia, Welbourne, & Wiseman, Reference Gomez-Mejia, Welbourne and Wiseman2000; Wiseman & Gomez-Mejia, Reference Wiseman and Gomez-Mejia1998).
Berrone, Cruz, and Gomez-Mejia (Reference Berrone, Cruz and Gomez-Mejia2012) further divided the noneconomic dimension into five components, including ‘family control and influence’ (F), ‘identification of family members with the firm (I)’, ‘binding social ties’ (B), ‘emotional attachment of family members’ (E), and ‘renewal of family bonds to the firm through dynastic succession’ (R), collectively known as FIBER. First, family control and influence refer to family members' control over the firm's decisions. Family members or a dominant family coalition can either become members of a management team to exert direct control or appoint the top management team to exert indirect control. It is necessary for family members to continue controlling the firm in order to preserve their SEW.
Second, family members' identification with the firm refers to the close connection between the family and the firm (i.e., noneconomic wealth) through their concern for image and reputation. Third, binding social ties address the close bonds and trust relationships between the family firm and nonfamily employees, even extending to external stakeholders (e.g., customers and suppliers). Nonfamily employees usually identify with the values of the firm and of the family. Additionally, FFs usually maintain long-term relationships with their customers and suppliers, viewing them as members of the extended family. Fourth, emotional attachment refers to the effects of emotions on the FFs. Family members' emotional attachment to the firm has a significant impact on the decision-making process. Fifth, dynastic succession means bequeathing the FFs to the descendants of the owners. Compared with non-FFs, FFs enjoy a longer life span because of the owners' intent to maintain the FFs for future generations. Furthermore, problems occur in connecting the cause and effect of SEW when each of these diverse and differentiating priorities for companies and their family members are grouped under ‘one SEW umbrella’ (Miller & Le Breton–Miller, Reference Miller and Le Breton–Miller2014: 714). Thus, when applying the concept of SEW, scholars must consider whether a given construct is uni- or multidimensional.
Green Innovation
The concept of green innovation is closely related to those of eco-innovation, sustainable innovation, and environmental innovation, all of which place emphasis on innovation that reduces the negative impact on the environment (Grazzi, Sasso, & Kemp, Reference Grazzi, Sasso and Kemp2019). As Grazzi et al. (Reference Grazzi, Sasso and Kemp2019: 3) defined it, green innovation means ‘new or significantly improved goods and services, processes, marketing methods, organizational structures, and institutional arrangements that – with or without intent – lead to environmental improvements compared to relevant alternatives’. Benefit to the natural environment may occur when the innovation introduced by a firm is able to effectively reduce the consumption of natural resources and the production of air, water, soil, or noise pollution, or when the firm substitutes substances that are less harmful to the environment in place of more harmful ones or uses alternatives that serve longer or can be better recycled. Grazzi et al. (Reference Grazzi, Sasso and Kemp2019) divided green innovation into green product innovation and green process innovation. The former being the innovation carried out to cope with environmental changes and meet customer expectations, it seeks to reduce the over-consumption of raw materials and energies lest consumers' health and safety be undermined (Chen, Cheng, & Dai, Reference Chen, Cheng and Dai2017). The latter, meanwhile, aims to improve environmental quality and mitigate environmental pollution and energy consumption (Guo et al., Reference Guo, Lv, Liao, Xi, Zhang, Zuo, Cao, Feng and Zhang2020) by reducing production costs, aligning products with relevant environmental laws, incorporating stakeholders' demands for a better environment into the production design (Hart & Dowell, Reference Hart and Dowell2011), repackaging the products, and guaranteeing customers environmentally friendly selling behavior and after-sale service.
Green innovation entails achieving the twin goals of being ‘innovative’ and ‘green’. Green innovation has some traits to general innovation including ‘complexity’, ‘long horizon decisions’, and ‘spillover effects’. For complexity, green innovation consists of advanced technology, patent grants, and consumer identification. If a green product's innovativeness cannot be accepted by consumers, it will end up as a failure (Kuokkanen & Sun, Reference Kuokkanen and Sun2020). For example, the Ford Motor Company acquired a Norwegian company in 1999, invested 100 billion US dollars to manufacture electric cars, and launched the Th!nk Electric campaign in 2002. Yet, owing to consumers' unwillingness to change their driving habits and limits to the charging and battery technology for the mainstream market at that time, the Th!nk Electric campaign was withdrawn from the North American market. Moreover, the coordination of internal and inter-firm activities is necessary to innovate green products (Afeltra, Alerasoul, & Strozzi, Reference Afeltra, Alerasoul and Strozzi2023; Przychodzen, Leyva-de la Hiz, & Przychodzen, Reference Przychodzen, Leyva-de la Hiz and Przychodzen2020). As for the length of time needed to see a significant return on investments, green innovation is likely to take much longer. Johnstone and Labonne (Reference Johnstone and Labonne2009) mentioned that a firm may apply for an environmental management system certificate to show the market their environmentally friendly practices, thereby creating a more positive image for itself. Yet these eco-environmental plans sent through external institutions to the European Union for verification and audit and the procuring of ISO 14001 environmental certification cannot be done overnight; it may take at least a year just to be granted a certificate.
Above all, as with traditional innovation, implementing green innovation is also thought to bring about a spillover effect, which eventually brings FFs more resources and wealth (Ahlstrom, Reference Ahlstrom2010; Zameer, Wang, & Yasmeen, Reference Zameer, Wang and Yasmeen2020). For example, carrying out green innovation can help a family to establish a corporate image in sustainability and further build its legitimacy with key stakeholders (Ahlstrom, Bruton, & Yeh, Reference Ahlstrom, Bruton and Yeh2008). As this is an era of green environmentalism, energized by online media (e.g., social media and online advertising). For example, O'right, a well-known ‘green’ shampoo brand in Taiwan is a good example. O'right's team invested two years in the development, design, and manufacturing of the innovative, eco-friendly ‘Tree in the Bottle’ shampoo, which was the winner of the Red Dot Design Award in 2014 and was also the iF Design Award winner in 2014. The bottle is made from the extraction of starch from vegetable and fruit waste, which can be recycled and broken down within one year. Moreover, a seed is planted in the bottle and can grow three trees to counter carbon dioxide emissions. As soon as this innovative green product attracts favorable media attention. Therefore, investing in the utilization of green innovation not only helps keep a firm from potentially violating environmental laws but also satisfies consumers' expectations of the firm's being environmentally sustainable and friendly. At the same time, FFs will have an opportunity to communicate a new image of itself which can enhance its reputation and then increase their market share (Ahlstrom et al., Reference Ahlstrom, Bruton and Yeh2008; Lin, Ho, Sambasivan, Yip, & Mohamed, Reference Lin, Ho, Sambasivan, Yip and Mohamed2021).
Hypotheses Development
Family Firms and Green Innovation
Different from the conditions in non-FFs, the boundaries between families and firms are blurred in FFs. Family members usually closely identify with their firms (Campopiano & Rondi, Reference Campopiano and Rondi2019) and regard the firms as the extension of their families. Hence, FFs not only pay attention to economic results but also to reputation, to the maintenance of inter-member loyalty and trust, to dynastic succession, to identification with the family, and to binding close social ties (Ahlstrom, Young, Chan, & Bruton, Reference Ahlstrom, Young, Chan and Bruton2004; Zhu & Kang, Reference Zhu and Kang2022). Seen from the two emotional wealth dimensions of ‘family members' identification with the firm’ and ‘dynastic succession’, family members often perceive the firm to be an extension of the family and attach great importance to the firm's reputation because the firm represents the family (Dyer & Whetten, Reference Dyer and Whetten2006). As noted above, green innovation can build legitimacy and trust with stakeholders. This behavior helps the firm reduce transaction costs due to trust, not only increasing the economic return of transaction flows but also the noneconomic return of accumulated reserves. Moreover, succession preserves the connections between the family and the firm – this emotional wealth dimension makes the family firm perspective transgenerational (Sharma & Irving, Reference Sharma and Irving2005). To maintain the firm's family dynasty and pass on family values to younger generations, the FFs' operational plan often is to establish a long-term relationship with its stakeholders for a win–win situation. Though green innovation involves higher start-up costs, it also may offer greater long-term social and economic benefits; consequently, many FFs are willing to initiate it, even though its payoff period may be longer. Family members' common intention to realize transgenerational continuity is not just a suction force; it ensures that the explicit knowledge and the tacit knowledge of a highly complicated green innovation are smoothly passed on to the next generation (Botero, Martínez, Sanguino, & Binhote, Reference Botero, Martínez, Sanguino and Binhote2021). As a result, unlike the situation in non-FFs, the high complexity of green innovation, instead of hampering implementation, becomes a means for FFs to obtain a differentiated competitive advantage. Thanks to family members' mutual trust, their willingness to impart knowledge and their strong succession intentions, FFs are more willing to be engaged in green innovation.
As for the dimension of ‘binding social ties’ in SEW, social ties are crucial connections. Mutually beneficial relationships that are strong and steady create a stable social network. Such relationships can extend from a couple to other core family members, to noncore family members, and to important external stakeholders of an FF. Such a social network is characterized by trust, cohesion, and stability, thereby creating social capital for the FFs, because it facilitates the long-term cooperation of one another (Berrone, Cruz, Gomez-Mejia, & Larraza-Kintana, Reference Berrone, Cruz, Gomez-Mejia and Larraza-Kintana2010). Rondi, Überbacher, von Schlenk-Barnsdorf, De Massis, and Hülsbeck (Reference Rondi, Überbacher, von Schlenk-Barnsdorf, De Massis and Hülsbeck2022) and Sanchez-Famoso, Pittino, Chirico, Maseda, and Iturralde (Reference Sanchez-Famoso, Pittino, Chirico, Maseda and Iturralde2019) pointed out that high levels of social capital is a fairly unique resource of FFs, which is an essential quality for innovation. Abundant social capital, accumulated via social networking on the basis of tacit understanding through continual interactions among multigenerational family members, long-term business partners, customers, employees, and stockholders, makes upstream and downstream cooperative partners more willing to share knowledge and resources, to strengthen green technology cooperation, and to develop green supply chains (Lee, Reference Lee2008), which in turn encourages FFs to set green innovation in motion.
Viewed from the two emotional wealth dimensions of ‘family members' identification with the firm’ and ‘dynastic succession’, FFs mindful of or committed to improving their reputation are more willing to be engaged in green innovation. On the other hand, viewed from the dimension of ‘binding social ties’, accumulated social capital helps FFs to construct a stable production value chain. Based on the above discussion, it is hypothesized:
Hypothesis 1 (H1): Family firms are more positively associated with green innovations than non-family firms.
Control Deviation Family Firms and Green Innovations
There is an interdependent relationship between emotional wealth and social wealth; the multidimensional SEW can affect the decision-making process in a complex way (Fang, Kellermanns, & Eddleston, Reference Fang, Kellermanns, Eddleston, Memili and Dibrell2019; Martin & Gómez-Mejía, Reference Martin and Gómez-Mejía2016). To this point, we have argued that differences in green innovation among FFs with control deviation and without control deviation can be largely explained by analyzing the implications for FFs. FFs with control deviation is concentrated with only a few shareholders owning a significant fraction of shares (Chirico & Kellermanns, Reference Chirico and Kellermanns2022). Thus, ‘Family control and influence’ is the one dimension of SEW that CDFFs value most (Swab, Sherlock, Markin, & Dibrell, Reference Swab, Sherlock, Markin and Dibrell2020).
With the aforementioned dual power, family shareholders may cause situations where rights and duties exist unequally (or equity diverges from the center) to occur through a pyramid structure and cross-shareholding (Claessens et al., Reference Claessens, Djankov, Fan and Lang2002). In order to consolidate its control over the firm and prevent flexibility in the use of funds from being hampered, the family tends to avoid diluting equity to acquire financial resources, thereby restricting the resources allocated to R&D activities (Fernández & Nieto, Reference Fernández and Nieto2006). Anderson, Jack, and Dodd (Reference Anderson, Jack and Dodd2005) once stated that FFs which are involved in control rights have fewer financial resources than non-FFs, so their performance in green innovation research and development is negatively affected by capital limits (Muñoz-Bullón & Sanchez-Bueno, Reference Muñoz-Bullón and Sanchez-Bueno2011; Thomsen & Pedersen, Reference Aycan2000). In contrast to more commonplace innovation, green innovation often requires more funding in the initial stage. For example, Delmas (Reference Delmas2002) asserted that it took about $100,000 to $200,000 to get an environmental certificate in developed countries (e.g., an ISO 14001 certificate). Naturally, CDFFs are not inclined to green innovation activities that require external funding (Heider, Hülsbeck, & von Schlenk-Barnsdorf, Reference Heider, Hülsbeck and von Schlenk-Barnsdorf2022).
Moreover, the concentration of power leads to the deprivation of minority shareholders’ wealth or principal–principal conflicts (PP conflicts) (Anderson & Reeb, Reference Anderson and Reeb2003; Li, Guo, Yi, & Liu, Reference Li, Guo, Yi and Liu2010; Young et al., Reference Young, Peng, Ahlstrom, Bruton and Jiang2008). Since CDFFs usually seek to enhance personal interests rapidly by participating in the management through pyramid structures, CDFFs, according to this argument, do not favor green innovations that are slow in getting returns. Furthermore, owing to their differences of opinion about investment preference and corporate development, controlling shareholders and minority shareholders (or other small shareholders in the family as well as external shareholders) have to communicate and coordinate with one another. From the complexity of green innovation stems the asymmetry of information (Kong, Sun, Sun, & Song, Reference Kong, Sun, Sun and Song2022; Xiang, Liu, & Yang, Reference Xiang, Liu and Yang2022), which leaves room for improper behaviors by controlling shareholders that are detrimental to overall corporate benefits and beneficial only to certain parties.
It can be said then that controlling shareholders possess more information about the rights of control over corporate decisions than do other investors (Villalonga & Amit, Reference Villalonga and Amit2006), and would probably take advantage of the asymmetry of information or the disclosure of misinformation to cover up their tunneling behaviors (La Porta, Lopez-de-Silanes, Shleifer, & Vishny, Reference La Porta, Lopez-de-Silanes, Shleifer and Vishny2002). The fact that the implementation of green innovation is complex and the situation that information is asymmetric are factors that are bound to increase the degree of distrust between minority shareholders and controlling shareholders, that are likely to result in conflicts, and that increase the difficulty in carrying out green innovation strategies. Combining these arguments, we deduce that the possibility of CDFFs and the anxiety involved in decision-making associated with undertaking green innovation are particularly salient to CDFFs. Our arguments suggest the following hypothesis:
Hypothesis 2 (H2): The control deviation level of family firms is negatively associated with green innovation.
Moderating Role of CSR Committees
The establishment of functional committees facilitates functional divisions of labor and effectuates the operation of the board of directors; hence, prior studies have discussed board effectiveness by inspecting the monitoring effects of a board of directors or a functional committee, such as a compensation committee's monitoring effects on a company's compensation policy toward the top management team (Sun & Cahan, Reference Sun and Cahan2009) and an audit committee's monitoring effects on a company's financial report (Kusnadi, Leong, Suwardy, & Wang, Reference Kusnadi, Leong, Suwardy and Wang2016). Of all the functional committees, the CSR committee is a task force specializing in sustainability. According to prior literature, CSR committees function as corporate subcommittees of boards of directors that make social and/or environmental recommendations to the boards and assist board members in their CSR-related functions (Orazalin, Reference Orazalin2020). Thus, the implementation of CSR committees in an assistant role for boards (Garcia-Blandon, Castillo-Merino, Argilés-Bosch, & Ravenda, Reference Garcia-Blandon, Castillo-Merino, Argilés-Bosch and Ravenda2020) should lead to increased CSR-related efficiency. Using a cross-country sample, Adnan, Hay, and van Staden (Reference Adnan, Hay and van Staden2018) found that CSR committees transform the negative culture (power distance)-CSR reporting link into a positive relationship. In consideration of differences in the implementation of CSR committees, there could be significant variation in the norms for firm CSR behavior for firms with a CSR committee versus firms without a CSR committee.
Mun and Jung (Reference Mun and Jung2018) also found that professional groups, such as CSR managers in the upper ranks of their organizations, helped to decrease resistance from human resources managers who had wanted to maintain the traditional employment system led by men. The CSR committee is a professional group responsible for the CSR development of FFs. Its duties include keeping the stakeholders informed of changes in the environment and in society, periodically conveying the firm's CSR items under development to the board of directors, proposing appropriate sustainable development policies, and managing the public disclosure of the firm's sustainable development. When disclosure of the firm's information becomes more transparent, the firm is better able to build trustworthy relationships with its up- and downstream vendors and its customers. FFs which prioritize family reputation and social capital could have greater motivation for going green, since green innovation represents a significant action to retain the loyalty of their clients and maintain long-term relationships with their stakeholders.
Apart from the aforementioned, prior studies have asserted that internal and external corporate social responsibility might influence employee identification (Farooq, Rupp, & Farooq, Reference Farooq, Rupp and Farooq2017). Similarly, FFs that have a CSR committee create a positive image, which makes employees proud of being members of the organization, willing to associate themselves with their firm, and agreeable to the firm's implementation of green innovation in pursuit of SEW. This effectuates the intention of members of FFs to create green products or processes. To be brief, for those green professionals who have not yet entered a family firm, the existence of a CSR committee in an FF would appeal to them, and due to the presence of more green professionals in their firm it follows that such an FF would have more faith in and would be more motivated to increasing its involvement with green innovation activities. As a result, when an FF sets up a CSR committee, we expect it to undertake more green innovation activities. Therefore, we hypothesize:
Hypothesis 3a (H3a): The positive relationship between family firms and green innovation, as stated in H1, becomes stronger for firms having a CSR committee.
For those CDFFs which would rather consolidate their power than go green, CSR committees moderate the link between CDFFs and CSR outputs (Velte & Stawinoga, Reference Velte and Stawinoga2020). Basically, CSR committee members could negotiate with their opponents without regarding them as a serious threat to their control rights and convince them to support green innovation by appealing to their professional knowledge. This type of negotiation is indispensable. Family members with majority equities often prioritize the various dimensions of SEW than do both family members with minority equities and nonfamily members. The owners of CDFFs tend to first consider family control and influence, which could hinder them from pursuing green innovation because it might threaten their power and control rights in their firms. By contrast, family members with minority equities and nonfamily members would first consider the reputation and social capital of the FFs and would thus be more likely to agree to green innovation. Under such circumstances, it is hard for all the members of the FFs to reach a consensus on green innovation activities, and the attempt to implement green innovation may give rise to tension. In moments like this, the organization needs a certain degree of assistance from professional groups. As Kellogg (Reference Kellogg2014) argued, radical reform may cause a tense situation and even incur strong resistance from supporters of the status quo, so a professional group can serve as a necessary lubricant in encouraging agreement and compromise (Dunbar & Ahlstrom, Reference Dunbar and Ahlstrom1995).
Furthermore, the primary duty of a CSR committee is to advise the board of directors on related policies and to inspect the implementation state of those policies (Homroy & Slechten, Reference Homroy and Slechten2019; Shaukat, Qiu, & Trojanowski, Reference Shaukat, Qiu and Trojanowski2016). Liao, Luo, and Tang (Reference Liao, Luo and Tang2015) found that environmental committees in the UK had positively influenced greenhouse gas (GHG) disclosures by meeting more frequently. ESG committees are groups of specialized members to whom CSR-related advisory tasks and responsibilities are delegated (Orazalin, Reference Orazalin2020). Accordingly, CSR committees may moderate the CDFFs – green innovation relationship through their timely grasp of CSR issues. Based on the above arguments, we inferred that the presence of a CSR committee could help resolve the time-consuming and fraught decisions over green innovation prevalent in CDFFs and act as an overseeing agent. Hence, we posit the following hypothesis:
Hypothesis 3b (H3b): The negative relationship between the control deviation level of family firms and green innovation, as stated in H2, becomes weaker for family firms with a CSR committee.
Our conceptual framework is illustrated in Figure 1.
Research model

Methods
Sample and Data Collection
Confucianism has exerted a strong impact on the management styles and decision-making in East Asian family firms, especially in China, Taiwan, Japan, and Korea (Smith & Kaminishi, Reference Smith and Kaminishi2020). In these countries, Confucian values have been woven into many aspects of Chinese society (i.e., China and Taiwan) such as its religions, education, and life experiences since Confucianism originated in Ancient China (i.e., the Zhou dynasty, 1046 B.C.E. to 256 B.C.E.). In contrast, Confucian philosophical thought was introduced rather than rooted in Japan and Korea. This implies that China and Taiwan are better settings for this research topic than are Japan and Korea. While Taiwan has gradually adopted a more democratic system, state-owned enterprises (SOEs) still play a leading role in China, and the central government exercises significant strategic and resource allocation control with respect to SOEs (and favors granted to them). Family firms have fewer rights to obtain resources though they can still experience government intervention in firm decisions. For this reason, the Taiwanese business community is a helpful research site to examine green innovation, which is a carefully watched, incentivized, and regulated activity. Furthermore, three additional reasons further demonstrate that firms in Taiwan constitute an ideal sample for testing the hypotheses in this study. First, the deviation of control rights is very common in Taiwanese FFs (Yeh & Woidtke, Reference Yeh and Woidtke2005). For example, some control rights of FFs exceed their cash flow rights by around 25% (Claessens et al., Reference Claessens, Djankov and Lang2000); more than 50% of CEO positions in Taiwanese FFs are held by the controlling families (Chen, Gray, & Nowland, Reference Chen, Gray and Nowland2013). Deviation of control rights can give rise to principal–principal conflicts since family owners have a unique opportunity to expropriate minority shareholders (Young et al., Reference Young, Peng, Ahlstrom, Bruton and Jiang2008).
Second, the extensive utilization of resources has triggered adverse effects on the environment, causing climate change, which poses an ongoing threat to Taiwan. A review of the natural disaster statistics of the National Fire Agency of Taiwan (NFA) reveals a significant increase in the frequency of weather-related disasters, including floods, wind disasters, heavy rain, and flash floods, during the 1970s. Moreover, such disasters still occur (Yang & Ge, Reference Yang and Ge2020). Thus, Taiwan has been striving to maintain its precious natural resources and resilience to overcome environmental problems related to air, water, waste, toxic substances, and ocean dumping through green innovation.
For example, following the global trend of Green Consumerism, Taiwan's Green Mark was launched in 1992 to encourage companies to produce – and for consumers to purchase – products that have less impact on the environment, reduce wastes, and promote recycling. In response to global sustainable development initiatives and national net-zero emission goals, the Taiwan Financial Supervisory Commission introduced the ‘Green Finance Action Plan’ in 2017 and released the ‘Sustainable Development Roadmap for Listed Companies’ in 2022 to build a robust ESG ecosystem. In 2022, Taiwan's per capita carbon emissions were approximately 13 metric tons per year, ranking 26th among over 200 economies worldwide. In recent years, the government and industries have been actively engaged in researching hydrogen-related solutions, including hydrogen production, energy generation using hydrogen, and applications, and infrastructure required for storage and transportation. Taiwan's government-owned China Steel Corporation launched its hydrogen-powered steel making initiative, featuring significant partnerships with Taiwan's Industrial Technical Research Institute and two other national universities to develop and implement continuous carbon-neutral production line technologies. Third, the constitution of CSR committees is voluntarily set. This may help examine CSR committee's moderating effect.
We tested our hypotheses using a sample of Taiwanese firms listed on the Taiwan Stock Exchange (TWSE) during the period from 2014 to 2021. We chose this time period since there was an obvious increase in consciousness of the CSR practices of Taiwanese firms beginning in 2014. The ‘2014 Taiwan CSR Report Survey’ reported that more than 50% of the CSR reports had passed a third-party inspection, strengthening the quality and credibility of the reports. The CSR report adopted the GRIG4 version and increased it by a factor of 25 in order to meet international requirements ahead of schedule.
We collected and merged data from three sources. First, we obtained family cash flow, voting rights, and financial information from the Taiwan Economic Journal (TEJ) database. Second, we obtained green innovation data from the MTrends database (https://metrends.co). This database is built on the foundations of patent information search and analysis by the integration of international patent information from the largest patent administrating offices worldwide, including the Taiwan Intellectual Property Office (TIPO), the Japan Patent Office (JPO), the European Patent Office (EPO), and the United States Patent and Trademark Office (USTPO), among others. The MTrends database allowed us to apply keywords and identify green patents, as well as apply other filters to further categorize green patents as green innovative patents. Third, information from CSR committees was hand-collected from each company's annual report.
Given the lag effects of the independent variables on green innovation, we set up a one-year lagged model to eliminate any spurious causality. Thus, we lagged our independent and control variables by one year so that they were used to predict the dependent variable in the following year. We initially gathered 861 samples; however, 34 firms in the insurance securities sectors were not included in our sample because they have a number of significant differences in terms of their industrial characteristics and accounting systems, leaving us with 827 firms. Then we removed all sets of observations with missing values and extreme values of firms for the key variables. Finally, we obtained an unbalanced panel of 773 firms and 5,071 firm-year observations from 2014 to 2021. We provide a summary of the number and percentage of all sample and family firms by the industrial categories based on the TWSE in Table 1. The largest industry was electronics, accounting for 50% of all samples and 41% of family samples. In the electronics industry, family firms account for 51%, the lowest proportion among all industries. In the cement, paper and pulp, and sports and leisure industries, 100% are family-owned firms. This characteristic suggests the importance of controlling for industry affiliation in the empirical analysis.
Sample distribution in different industries

Variables
Dependent variable
Green innovation includes green product innovation and green process innovation (Xie, Huo, & Zou, Reference Xie, Huo and Zou2019). For green product innovation, this study follows the research conducted by Quan, Ke, Qian, and Zhang (Reference Quan, Ke, Qian and Zhang2023) to measure green patent quantity. First, based on work from He and Jiang (Reference He and Jiang2019), we employed a textual analysis using the following 14 keywordsFootnote 2 and checked patents related to green innovation. If the patent's title or description contained any of the keywords, we classified it as a green patent. Second, in Taiwan, the IPO (Intellectual Property Office) classifies patents into three major categories: ‘Invention patent’, ‘Utility patent’, and ‘Design patent’. Design patents refer to product applications based on the shape of the product and the combination of colors. Such a patent is uncommon and usually has no commercial value. Invention patents only apply to unprecedented products, processes, or ways to improve them, whereas utility patents apply to new solutions for the shapes or structures of a particular product (Wang, Stuart, & Li, Reference Wang, Stuart and Li2021). In short, green product innovation is characterized by the patents that are classified as ‘green’ and ‘invention patents’ by the TIPO. Green product innovation is a dichotomous variable that takes a value of one if a firm has green invention patents, and zero otherwise.
For green process innovation, ISO 14001 or ISO 14064 certifications are used as the indicators of green process innovation in this study. ISO 14001 is a process-based standard which requires that a firm integrate its environmental management practices into its operations. Thus, the environmental concerns in a firm's activities are the core of ISO 14001 (Lin, Zeng, Ma, Qi, & Tam, Reference Lin, Zeng, Ma, Qi and Tam2014). Implementation of ISO 14064 certification can reduce a firm's GHG emissions. A dummy variable is used as a measurement of green process innovation to indicate whether a firm qualifies for at least one certification (‘1’ for yes and ‘0’ otherwise).
Prior studies mention that green innovations are innovations in products or processes leading to higher levels of environmental sustainability, which has become an important strategic choice for companies (i.e., Chang, Reference Chang2011; Lisi, Zhu, & Yuan, Reference Lisi, Zhu and Yuan2020). A dummy variable is used as a measurement of green innovation to indicate whether a firm had at least one green product innovation or one green process innovation (‘1’ for yes and ‘0’ otherwise).
Independent variables
Following Filatotchev, Lien, and Piesse (Reference Filatotchev, Lien and Piesse2005), we employed a dichotomous distinction between family vs. nonfamily firms. We termed a firm as a family firm (coded ‘1’) if the ultimate controller of the firm is a family; otherwise, it was coded ‘0’. Membership in the controlling family is identified by linking corporate insiders, including the CEO, the board members, the board chairman, the honorary chairman, and the vice chairman, that first share a common family name and second share the same first name of the largest shareholder from the male side of the family name with the largest owner. Family-related information was collected from the TEJ database that has been widely used in prior studies on family businesses focusing on Taiwan, such as Yang (Reference Yang2010) and Zhang, Wei, and Wu (Reference Zhang, Wei and Wu2017). Of the 773 sampled firms, 527 were family firms.
Family firms with deviation among control rights is measured as the difference between the family board rights (family directors’ ratio) and the voting rights held by the family members (Lin & Hsu, Reference Lin and Hsu2008). Following La Porta et al. (Reference La Porta, Lopez-de-Silanes, Shleifer and Vishny2002), the voting rights combine family members’ direct and indirect voting rights in the family firms. Dechow, Sloan, and Sweeney (Reference Dechow, Sloan and Sweeney1996) used board rights to measure whether the ultimate controller is able to influence the firms’ major decisions. Voting rights come from the ultimate controller's ownerships, including direct ownership and indirect ownership. The ultimate controller's influence on decision-making and resource allocation through seat control may be more cost-effective than that of controlling companies through shareholding. If directors pledge their shares, they lose their voting rights. Lin and Hsu (Reference Lin and Hsu2008) indicate that using board seat control is more in line with Taiwan's practice. When the gap between board rights and voting rights is significant, controlling shareholders have incentives to deprive minority shareholders of their voting rights. Considering the practice of listed companies in Taiwan, we compute the gap between the family board rights and the voting rights held by the family members to measure the control deviation level of family firms. We obtained detailed information on board rights and voting rights from the TEJ database.
Moderating variable
We used a dummy variable to identify the presence of a CSR committee. A CSR committee is assigned a value of 1 (one) when a company has established a CSR committee and 0 (zero) otherwise (Radu & Smaili, Reference Radu and Smaili2022). Following Burke, Hoitash, and Hoitash (Reference Burke, Hoitash and Hoitash2019), we used different names for different types of committees. A typical committee supervising all CSR matters is named ‘Sustainability’, ‘Corporate Responsibility & Sustainability’, ‘Sustainable Development’, ‘Corporate Responsibility and Ethics’, or ‘Corporate Social Responsibility’. Some sustainability committees with a focus on the environment were named ‘Environment’, ‘Environmental Health and Safety’, or ‘Renewables Conservation and Recycling’.
Control variables
We controlled for the influence of other variables that may impact green innovation. For firm-level variables, we controlled firm size (SIZE) by taking the natural logarithm of the book value of a firm's total assets because the size of a firm may influence the amount of its financial resources that are invested in green innovation (Flammer, Hong, & Minor, Reference Flammer, Hong and Minor2019). We controlled for the level of profitability, measured as the ratio of net income to net sales (ROS). We also controlled for firms’ growth, estimated as the percentage of change in sales (GROWTH) because firms’ growth makes managers more willing to spend on R&D (Bravo & Reguera-Alvarado, Reference Bravo and Reguera-Alvarado2017). Previous research has shown that R&D expenses affect the market's evaluation of a firm, as well as its environmental strategy (Luo & Bhattacharya, Reference Luo and Bhattacharya2009). We controlled for R&D expenses, measured as the ratio of research and development expenses to net sales (R&D) (Filatotchev & Piesse, Reference Filatotchev and Piesse2009). We also controlled for leverage (LEV), which is measured by the ratio of total debt to total assets because financial conditions may be an obstacle to spending on green innovation. We also controlled for product diversification and internationalization because both of these actions affect a firm's ability to implement environmentally friendly activities to signal commitment and to reduce risks when operating in diversified markets (Attig, Boubakri, El Ghoul, & Guedhami, Reference Attig, Boubakri, El Ghoul and Guedhami2016). We measured product diversity (DIV) by using the widely used Herfindal-Hirschman index and internationalization by the ratio of foreign assets to total assets (FSTS) (Lu & Beamish, Reference Lu and Beamish2004). Moreover, firms may participate in green activities to increase their competitiveness once the environment is characterized by a high level of industry dynamism (Windrum & Birchenhall, Reference Windrum and Birchenhall2005). We controlled for the level of dynamism (DYN), which was measured by regressing industry sales on time, and dividing the resulting standard error of the regressions by the average industry sales (Boyd, Reference Boyd1990; Keats & Hitt, Reference Keats and Hitt1988).
Next, corporate governance characteristics are associated with the effectiveness of monitoring functions, and consequently have an impact on a firm's concern for social and environmental issues (Al-Mamun & Seamer, Reference Al-Mamun and Seamer2021). Thus, we controlled for various corporate governance variables, including ownership percentage of directors (DIR_OWN), ownership percentage of blockholders (BLOCK_OWN), ownership percentage of managers (MANAG_OWN), ownership percentage of institutional investors (INST_OWN), board size (BOARD_SIZE), the percentage of independent directors (IND_BOARD), and the percentage of directors serving as managers (DUALITY). Finally, we introduced Year and Industry dummies to reduce the heterogeneous influences of year and industry, respectively.
Empirical Models
We mainly aimed to identify whether firms which conduct green innovation are influenced by the FFs and CDFFs deviation level of family firms. We estimate logistic regressions using the dummy variable green innovation as the dependent variable. In addition, we utilized robust standard errors to avoid serial correlation and heteroskedasticity, and we controlled for the variability of the intercept over time by using year dummies. We used industry dummies to classify industries by the two-digit SIC Code used in the TWSE. Because the company is our unit of analysis, we employed robust standard errors clustered at the company level, as this specification offers higher reliability than nonclustered robust standard errors.
Results
Descriptive Statistics
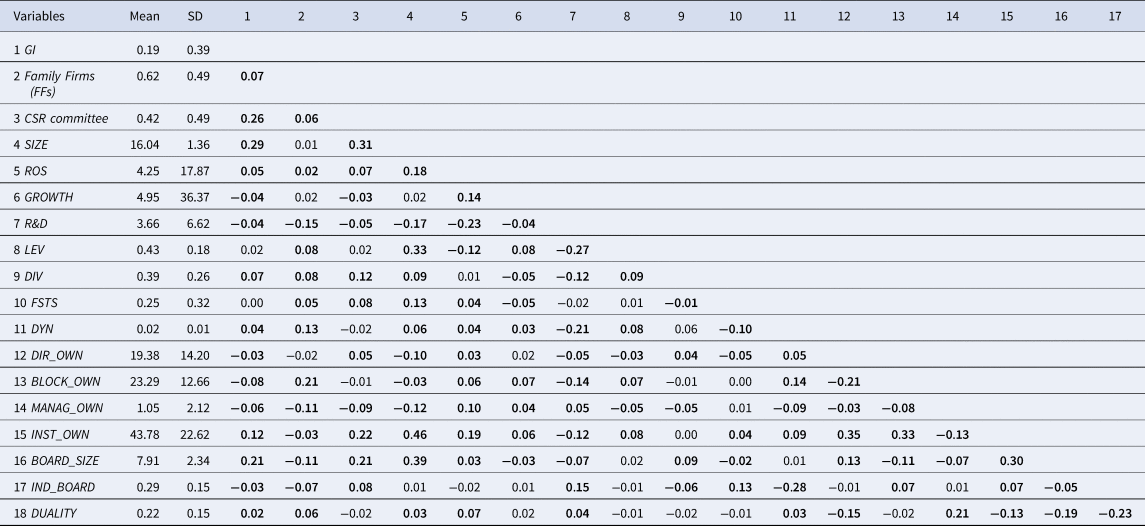
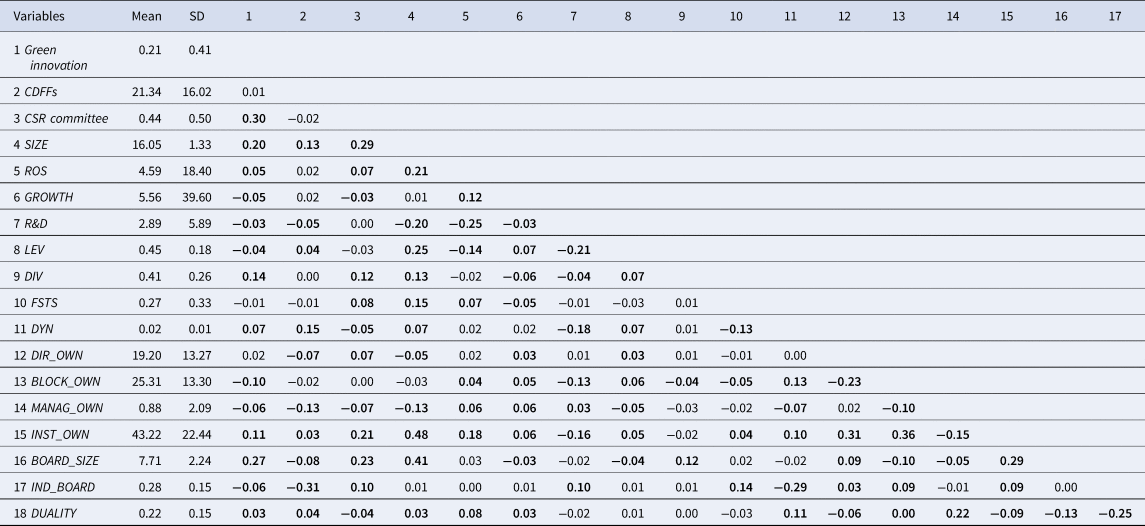
The hypotheses were tested initially by distinguishing two groups of samples: the full sample (including FFs and non-FFs) and the sample of only FFs. The descriptive statistics and correlations of the full sample and the FFs sample are shown in Tables 2 and 3, respectively. Table 2 indicates that 62% of the firms in our full sample (N = 5,071) are FFs (N = 3,152 in Table 3). 21% of FFs achieve green innovation slightly higher than the full sample (19%). Table 3 indicates that the mean level of CDFFs is at 21.34 for difference between the cash flow rights and the voting rights. While FFs (p < 0.10) are positively correlated with green innovation, we observe a negative correlation between CDFFs (p < 0.10) and green innovation. These results are preliminarily in line with our H1 and H2. Moreover, 44% of FFs establish CSR committees, which is slightly higher than the full sample (42%). We further calculated the variance inflation factor (VIF) statistics, and the largest VIF is 3.72, which is significantly lower than the rule-of-thumb value of 10 (Hair, Anderson, Tatham, & Black, Reference Hair, Anderson, Tatham and Black1998), indicating that the data are safe from the problem of multicollinearity.
Descriptive statistics and correlation matrix for the full sample (N = 5,071)

Note: Bold values indicate statistical significance at p < 0.1 level.
Descriptive statistics and correlation matrix for the family firm sample (N = 3,152)

Note: Bold values indicate statistical significance at p < 0.1 level.
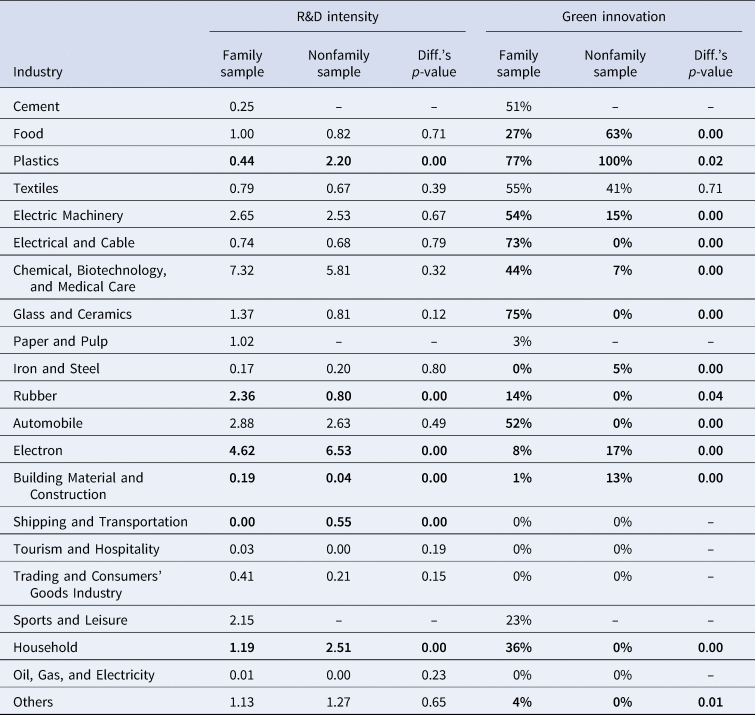
Table 4 shows the test results from comparing the R&D intensity and green innovation of the family and nonfamily firms in different industries. Regardless of whether a firm is family or nonfamily, there is higher R&D intensity in chemical, biotechnology and medical care and electronics industries. In plastics, rubber, electronics, building material and construction, shipping and transportation, and household industries, there are significant differences in R&D intensity between family and nonfamily firms. However, in terms of green innovation behaviors, except for the textiles industry, family and nonfamily samples show significant differences in all industries. This implies exploring the importance of family characteristics in green innovation decision-making and behavior.
R&D intensity and green innovation of family and nonfamily firms in different industries

Note: Bold values indicate statistical significance at p < 0.1 level.
Logistic Regression Results
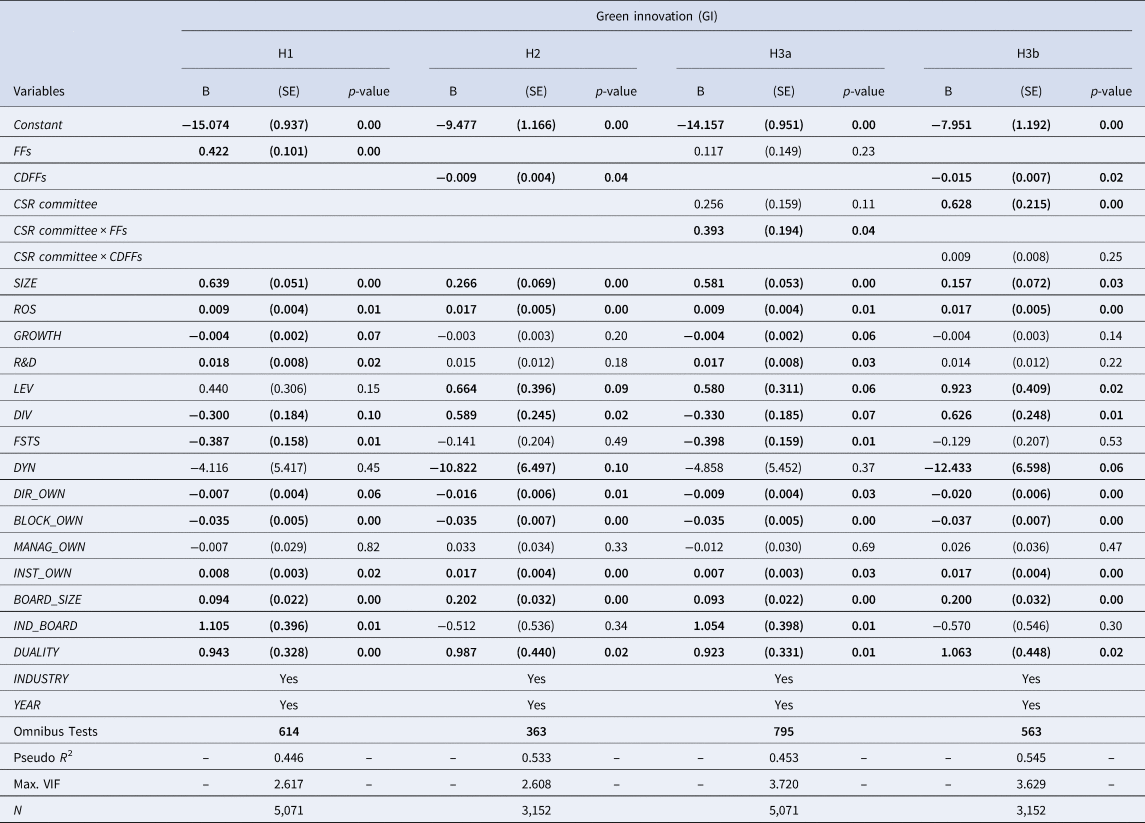
Model 1 in Table 5 is used to test H1, which predicted a positive relationship between FFs and green innovation. The result shows that the coefficient estimate of FFs is significant and positive on green innovation (β = 0.442, p < 0.01). It indicates that the sample of family firms has a significantly positive effect on green innovation. FFs compared with non-FFs are more likely to engage in green innovation.
Logistic regression results

Note: Bold values indicate statistical significance at p < 0.1 level.
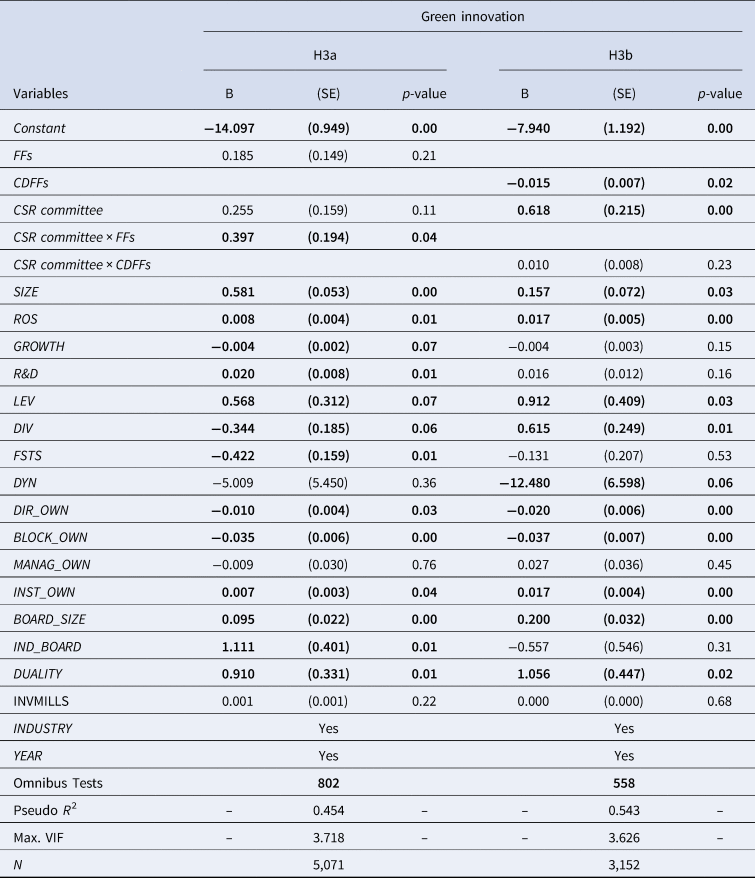
Using family firms as a sample to test H2, Model 2 indicates that the coefficient of CDFFs is negatively significant for green innovation (β = −0.009, p < 0.05). The family firms with a higher control deviation between board rights and voting rights would have lower levels of engagement in green innovation. This result supports our H2. To test H3a and H3b, we further conducted CSR committee moderated regression analyses in Model 3 and Model 4. We added the interaction between CSR committee and family firms (CSR committee × FFs) and the interaction between CSR committee and control deviation family firms (CSR committee × CDFFs) in Models 3 and 4, respectively. Following Aiken and West (Reference Aiken and West1991), the variables were mean-centered prior to the creation of the interaction term in order to reduce potential multicollinearity problems. Results for Model 3 show that a CSR committee did positively moderate the FFs and green innovation relationship (β = 0.393, p < 0.05). This supports H3a. The results suggest that a CSR committee may encourage FFs to actively engage in green innovation action. In Model 4, the coefficient for the interaction between CSR committee and CDFFs is not significant, thus H3b is not supported. It implies that a CSR committee is not helpful in motivating FFs to engage in green innovation when FFs have greater control deviation from board rights and voting rights.
Supplementary and Robustness Checks
The issue of self-selection
The issue of self-selection could affect our results. The establishment of a CSR committee is not done randomly, so factors influencing an FF's underlying decision to establish a CSR committee could ultimately explain the subsequent level of green innovation, as opposed to the actions directly associated with its CSR committee. To further mitigate the potential self-selection problem in our setting, we incorporated the Heckman (Reference Heckman1979) two-stage procedure to enhance our inferences. Our first step utilized a probit model to determine the likelihood of establishing a CSR committee. Using the estimates of the first-stage model, we constructed the inverse Mills ratio and included it in the second-stage green innovation model as an additional control variable. The first-stage probit model was based upon the following specification:

We followed Peters, Romi, and Sanchez's (Reference Peters, Romi and Sanchez2019) risk management perspective to predict the establishment of a CSR committee. Based on the risk management perspective, CSR efforts can be viewed as a response to sustainable risk, such as compliance and operational risks, as well as external constituency pressures facing the firm. Therefore, we included the lagged variables to proxy for resources available to the firm and the scope of strategic and compliance risks facing the firm. We first included two dummy variables of prior negative environmental, social, and governance news (ESGConcern) and illegalities (Illegal) to estimate that the firms focused on CSR strategies and incentives for establishing a CSR committee. ESGConcern and Illegal come from TEJ's data module of social responsibility news. ESGConcern was coded as 1; if a firm had negative ESG news in the previous year, it was assigned 1 and 0 otherwise. If a firm disclosed involvement in an illegal event in the prior year, Illegal was assigned 1, otherwise it was 0.
We also considered whether a firm's operations within an environmentally sensitive industry (SensitiveIND) might increase risk, whereby a firm might establish a CSR committee to decrease their exposure to such risks. Similarly, we included the ratio of total debt to total assets (LEV) to represent the level of financial risk facing a firm. In addition to the expectation that firms with greater financial performance (ROA) have greater resources with which to invest in CSR, we also asserted that firms operating globally (GLOBAL) are more likely to face pressures to invest in CSR initiatives, including the establishment of a CSR committee. We included the age of the property, plant, and equipment (PPEAGE) as a measure of the firm's fixed exposure to sustainability risks and as an indicator variable to capture the age of the firm (Age). PPEAGE is the ratio of accumulated depreciation of PPE to PPE original cost. We also included a firm's institutional ownership (INST_OWN) to control the influence of institutional investors on establishing a CSR committee. Institutional investors are the largest group of socially responsible investors (Uysal, Reference Uysal2014). They are more likely to have incentives to monitor sustainable management. Finally, we included year fixed effects to control for rising trends in the establishment of a CSR committee.
Table 6 presents the results of our first-stage Heckman model predicting the establishment of a CSR committee. The establishment of an ESG committee is positively associated with negative ESG news (ESGConcern, β = 0.536, p < 0.01), illegalities (Illegal, β = 0.614, p-value ≤ 0.01), financial performance (ROA, coefficient = 0.036, p < 0.01), operating globally (GLOBAL, β = 0.375, p < 0.01), property, plant, and equipment age (PPEAGE, β = 0.915, p < 0.01), the age of the firm (AGE, β = 0.019, p < 0.01), and institutional ownership (INST_OWN, β = 0.015, p < 0.01). Using the parameter estimates from the first-stage probit model, we calculated the inverse Mills ratio following Heckman (Reference Heckman1979). We then included the inverse Mills ratio (INVMILLS) as an additional control variable in the second-stage green innovation models. The findings shown in Table 7 are robust for using selection bias design. In sum, we find the evidence as providing support for H1, H2, and H3a.
Two-stage least square model: First-stage Heckman model of CSR committee

Note: Bold values indicate statistical significance at p < 0.1 level.
Two-stage least square model: Second-stage green innovation model of controlling the inverse Mills ratio

Note: Bold values indicate statistical significance at p < 0.1 level.
The number of green patents a firm has helps to assess its level of engagement with green innovation. We are further interested in how FFs and CDFFs affect innovation behaviors in green patents. To mitigate scale effects and account for industry-specific characteristics, we calculate the level of green innovation (GIN) by dividing the individual firm's number of green patents by the maximum number of green patents observed in the same industry and year. We substituted the green innovation dummy variable with the GIN to re-examine all hypotheses, the findings of which are presented in Table 8. H1 and H3a are still supported. However, H2 is not supported statistically, which shows that the control deviation level of family firms (CDFFs) is helpful to explain that a company reduced its green innovation activities, but CDFFs cannot distinguish the degree to which a company is committed to green patents.
OLS Regression results using the number of green patents

Note: Bold values indicate statistical significance at p < 0.1 level.
Different family shareholding percentage
Previous literature has provided multiple definitions of FFs. Burch (Reference Burch1972) claimed that the definition of an FF should not only consider family members serving as directors or managers, but it should also consider the level of the family's shareholding. Therefore, we additionally considered family ownership to redefine our FF. We followed Ng, Dayan, and Di Benedetto (Reference Ng, Dayan and Di Benedetto2019) considering one family as owning more than 10% and 50% of shares, respectively. In addition, average family ownership is approximately 30% in our sample. We consider one family as owning more than 30% of shares. As shown in Tables 9–11, these results obtained with the different levels of the family's shareholding have qualitatively similar results.
The effects of family firms with family ownership ≥10%

Note: Bold values indicate statistical significance at p < 0.1 level.
The effects of family firms with family ownership ≥30%

Note: Bold values indicate statistical significance at p < 0.1 level.
The effects of family firms with family ownership ≥50%

Note: Bold values indicate statistical significance at p < 0.1 level.
Alternative measurement of control deviation family firms
We followed Lin and Hsu (Reference Lin and Hsu2008) to employ an alternative measurement of control deviation family firms as the difference between family director rights and cash flow rights. Cash flow rights are the fraction of family members’ ultimate cash flow rights (La Porta et al., Reference La Porta, Lopez-de-Silanes, Shleifer and Vishny2002). As shown in Table 12, the results obtained with the alternative control deviation family firms corroborate those observed in our initial analyses.
The effect of control deviation between director rights and the cash flow rights (CDFFs_DC)

Note: Bold values indicate statistical significance at p < 0.1 level.
The moderating role of CSR report assurance
Prior studies support that third-party assurance of CSR reports can enhance sustainability information credibility and reliability (Casey & Grenier, Reference Casey and Grenier2015; Simnett, Vanstraelen, & Chua, Reference Simnett, Vanstraelen and Chua2009). Considering the possible impact of a third-party audit on corporate sustainability activities, we further examined the moderating role of CSR report assurance on the relationship between the control deviation level of family firms and green innovations. The results are shown as Model 1 of Table 13. However, the coefficient for the interaction between CSR report assurance and CDFFs is not significant. Considering the possible complementary or substitutive role of CSR report assurance and CSR committee, we included both the moderating effects of CSR report assurance and CSR committee in Model 2. The results still do not find that CSR report assurance or CSR committee has an impact on the green innovation of control deviation family firms.
Logistic regression results of the moderating role of CSR report assurance

Note: Bold values indicate statistical significance at p < 0.1 level.
Discussion
Companies today feel increasingly driven by capital markets and other stakeholders to accelerate the pace of green innovation. Much past research, however, focused on the relationship between nonfamily firms and green innovation. Only a limited amount of research investigated the relationship between green innovation and FFs. Therefore, this study attempted to examine the impact of FFs on green innovation, and considered whether a CSR committee relies on specific expertise to perform relevant green innovation activities for the firm and to oversee the implementation. Accordingly, this study further considered the moderating effect of the CSR committee.
Contributions
This study provides several contributions. First, we based the multidimensionality of SEW theoretical logic on integrating the influence of FFs on green innovation. Despite Gu, Lu, and Chung (Reference Gu, Lu and Chung2019) who distinguish two aspects of SEW, focused SEW and broad SEW, and linked their effects to the new industry entry decision, our research has made use of new findings. They attempted to understand the controlling owners’ new industry entry choices, but controlling owners of family businesses have distinct priorities in terms of SEW. Controlling owners prioritize emotional wealth (i.e., the renewal of family bonds to the firm through dynastic succession) making them more committed to move into new industries in order to reduce family tension and conflicts in the succession process. Conversely, controlling owners are less likely to invest in green innovation. In this instance, they prioritize social wealth (i.e., family control) rather than emotional wealth. Our work thus contributes empirically in finding that even if family controlling owners (i.e., CDFFs) are not a monolithic group, they vary significantly with respect to SEW.
Second, FFs play a vital role in Taiwan and the structure of FFs in Taiwan is very different from those of other economies. Most FFs with ultimate owners in Taiwan are characterized as family-controlled and have highly concentrated ownership structures characterized by various control arrangements, such as differential voting rights, cross-holdings, pyramids, and so forth, so that many Taiwanese firms have ultimate owners with significant controlling rights (Claessens et al., Reference Claessens, Djankov, Fan and Lang2002; Yeh, Lee, & Woidtke, Reference Yeh, Lee and Woidtke2001). This study enhances our understanding of the relationship between FFs and green innovation in the major east Asian economy of Taiwan.
Third, previous green innovation research has generally paid little attention to the supervisory role of the CSR committee. We contribute to theory in this area in highlighting that the CSR committee moderates (reinforces) the positive relationship between FFs and green innovation, though weakens the negative relationship between CDFFs and green innovation. However, the empirical results did not support the moderating effect of the CSR committee on CDFFs and green innovation. This finding may indicate that the importance of CSR has received increasing attention recently, as corporate stakeholders increasingly recognize the importance of implementing CSR in the company (Guan, Ahlstrom, & Liu, Reference Guan, Ahlstrom and Liu2024). Firms often publicize their endeavors to establish a CSR committee to win stakeholders’ favor and gain the trust of external investors (Derchi, Zoni, & Dossi, Reference Derchi, Zoni and Dossi2021; Drempetic, Klein, & Zwergel, Reference Drempetic, Klein and Zwergel2020). CDFFs often consider family control to be the most crucial aspect of SEW, but still want to enhance the family business's reputation. In light of these considerations, CDFFs are likely to establish CSR committees composed mainly of family members. In such a setting, the committee lacks the expertise to help promote green innovation and even loses the function of regularly monitoring CSR policies. The establishment of CSR committees by CDFFs has become an act of greenwashing (Zhang, Reference Zhang2022).
This article also carries several practical implications. First, family firms play a key role and represent the cornerstones of development in Taiwan, as well as in many Asian economies, as many large enterprises are family firms (The Economist, 2018). Currently, green innovation is seen as playing a key role in driving economies toward a more ecologically sound and prosperous future (Shu, Zhao, Yao, & Zhou, Reference Shu, Zhao, Yao and Zhou2024). The government could provide incentives such as tax breaks and R&D funding support to CDFFs or establish platforms that offer CDFFs with the technology and information necessary to facilitate green innovation. Doing so would increase the willingness of CDFFs to undertake the innovation of green products or processes.
Second, according to the IDC (International Data Corporation) study ‘Trends in Sustainability Regulations in Asia Pacific’, economies can be categorized into three groups according to their sustainability maturity: pioneers, emerging leaders, and observers. Taiwan was recognized as a pioneer in ESG development in 2023. However, the current study shows that some companies have engaged in green behaviors, such as setting up CSR committees, with little oversight mechanism. The government should evaluate the composition and operation of CSR committees through an independent third-party organization to minimize superficial compliance.
Third, green innovation may be emerging as a useful tool for developing competitive advantage and also for the long-term sustainability of family businesses (Bauweraerts, Arzubiaga, & Diaz-Moriana, Reference Bauweraerts, Arzubiaga and Diaz-Moriana2022). Therefore, this study suggests that FFs should proactively implement green innovation by providing knowledge and guidance through professional organizations or consultants. After all, they are more likely to be involved in CSR than their nonfamily numbers (Haddoud, Onjewu, & Nowiński, Reference Haddoud, Onjewu and Nowiński2021). As such, FFs would be expected to produce more green products, often by embedding circular economy technologies through innovation.
Limitations and Future Research
As in any other research, our study has certain limitations that offer avenues for future research. First, although the use of green products or green processes is very well established in green innovation studies, our results leave out discussion about the green marketing of green service innovations (Melander & Arvidsson, Reference Melander and Arvidsson2022). Future research could include the full scope of green innovation, resulting in a complete picture of the overall impact of green innovation.
Second, our findings are based on listed Taiwan FFs, which may only apply to publicly listed FFs, rather than to nonpublicly listed private FFs. However, some peculiarities of nonpublicly listed private FFs may be significant for green innovations. In the future, the sample may be enlarged by considering nonpublicly listed private FFs. Third, although we highlighted the contingent effects (i.e., CSR committees) in our study, other factors from a strategic perspective can further unveil how improved internal governance as well as effective external collaborations can aid innovation, particularly green innovation (Wang, Ahlstrom, Nair, & Hang, Reference Wang, Ahlstrom, Nair and Hang2008).
Conclusion
Based on a multidimensional perspective of SEW (i.e., FIBER), this article has not only theorized and subsequently demonstrated how SEW dimensions affect the green innovation of family firms versus nonfamily firms, but also how special types of family firms (i.e., the control deviation level of family firms) alter the important perception of FIBER dimensions and thus the frame of reference for firms to adopt green innovation. In Taiwan, such CDFFs seem to pursue family-centric and/or self-serving SEW priorities – in the form of lower CSR engagement such as green innovation to ensure continued family control – which might run counter to the interests of nonfamily stakeholders (Young et al., Reference Young, Peng, Ahlstrom, Bruton and Jiang2008). Moreover, CSR committees in CDFFs can act as more of a symbolic department that does not promote firms’ innovation of environmental and social policies. CDFFs may thus create a false impression for the public about their actual green behavior, which has also been referred to as greenwashing (Yu, Van Luu, & Chen, Reference Yu, Van Luu and Chen2020). Indeed, if this study were to provide one main message, it would be that some SEW dimensions can emerge as sponsors, and others as obstructions, with respect to firm decisions because of the different types of family firms. This suggests that future research devoted to family firms should avoid viewing SEW as an overall ‘umbrella perspective’ that is always applicable to family firms. Family firms are more nuanced than perhaps previously considered (Ahlstrom & Ding, Reference Ahlstrom and Ding2014; Chrisman, Fang, Vismara, & Wu, Reference Chrisman, Fang, Vismara and Wu2024), and will likely remain at the forefront of economies, important innovations, and needed research in the coming years (Heider et al., Reference Heider, Hülsbeck and von Schlenk-Barnsdorf2022), especially in major Asian economies.
Chia-Ling Lee (leecl@nccu.edu.tw) is a professor in the College of Commerce at National Chengchi University. She received a PhD from the National Sun Yat-sen University. She has also served as independent directors in Ditmanson Medical Foundation Chia-Yi Christian Hospital and a public listed firm in IC design industry for several years. Her primary research areas of interest include strategic performance management, management control systems, and environment, social, and governance. She involves herself with the integrated issues of such managerial research. Her research has been published in a number of journals including R&D Management, International Business Review, Management Accounting Research, Journal of International Accounting Research, Asia-Pacific Journal of Accounting & Economics, Advances in Accounting, Advances in Management Accounting, Advances in Quantitative Analysis of Finance and Accounting, China Accounting and Finance Review, Electronic Commerce Research and Applications, Industrial Management and Data Systems, and International Journal of Technology Management. She was an Editor-in Chief of Taiwan Accounting Review from 2014 to 2016, before serving as the Editor-in Chief of Journal of Accounting Review (TSSCI, CSSCI, Scopus listed Journal) from 2017 to now.
Wen-Ting Lin (wentinglin@mail.ncku.edu.tw) is a professor at the Institute of International Business in the College of Management at National Cheng Kung University, Taiwan. She received her PhD in international business management from the National Taiwan University. Her research interests include international business management, innovation, firm growth, family business, and business groups. Her research has been published in a number of journals including Journal of World Business, International Marketing Review, Management Decision, Asia Pacific Journal of Management, European Management Journal, International Business Review, Journal of Management and Organization, Management and Organization Review, Journal of International Management, European Journal of International Management, and International Journal of Human Resource Management, as well as several Chinese journals including Sun Yat-sen Management Review, Journal of Management & Systems, Journal of Management, Management Review, Organization and Management, and NTU Management Review.
Ya-Nan Shih (159708@mail.tku.edu.tw) is an associate professor in the Department of Accounting at TamKang University, Taiwan. She received her PhD from the National Chung Cheng University. Her primary research interests lie in the fields of management control systems and auditing. Her works have appeared in journals including Advances in Management Accounting, Journal of the Chinese Institute of Industrial Engineers, as well as several Chinese journals including Review of Securities and Futures Markets, Sun Yat-Sen Management Review, NTU Management Review, and Taiwan Accounting Review.