


Introduction
The radar imagery from the ERS-1 Synthetic Aperture Radar (SAR) provides an alternate view of the sea-ice cover in addition to the relatively long record provided by the SSM/I multichannel radiometer. The NASA sea-ice algorithm, or “Team” algorithm (Reference Cavalieri, Gloersen and CampbellCavalieri and others, 1984). routinely estimates ice type and ice concentrations from passive-microwave observations. However, the procedures used to estimate these same parameters from active-microwave observations (Reference Kwok, Rignot, Holt and OnstottKwok and others, 1992; Reference Comiso and KwokComiso and Kwok, 1996) are still relatively new. Large-scale (temporal and spatial) comparative studies between the estimates from the active and passive datasets are limited by the coverage, and hampered by the volume of high-resolution ERS-I SAR data. Here, we present a regional scale comparative study of the ice-cover parameters inferred from the active- and passive-microwave datasets. The objectives of this Study are: to compare the retrieval results obtained using the active and passive procedures, and to understand the physical meaning of these differences and what they imply about the state of the ice cover.
If records of the Team algorithm results are examined, one finds that the estimates of multi-year (MY) ice concentration in the winter are much lower (by up to 30%) than those of the summer total-ice concentration. From a mass-balance perspective, such large discrepancies need to be resolved. If ice that survives the summer is classified as MY ice, then the MY-ice concentration during the winter should be nearly equivalent to the ice concentration during the previous summer’s minima, differing by an amount due to melt, ridging, new/young ice formation and export ofice from the Arctic. This mismatch was noted by a number of investigators in terms of the variability of the multichannel microwave signatures of sea ice on regional studies (Reference ThomasThomas, 1993), from comparison with surface measurements (Reference Grenfell and LohanickGrenfell and Lohanick, 1985; Reference GrenfellGrenfell, 1992), and from a mass-balance perspective (Reference ComisoComiso, 1990; Reference Rothrock and ThomasRothrock and Thomas, 1990; Reference Gloersen, Campbell, Cavalieri, Comiso, Parkinson and ZwallyGloersen and others, 1992; Reference Thomas and RothrockThomas and Rothrock, 1993).
Data Description
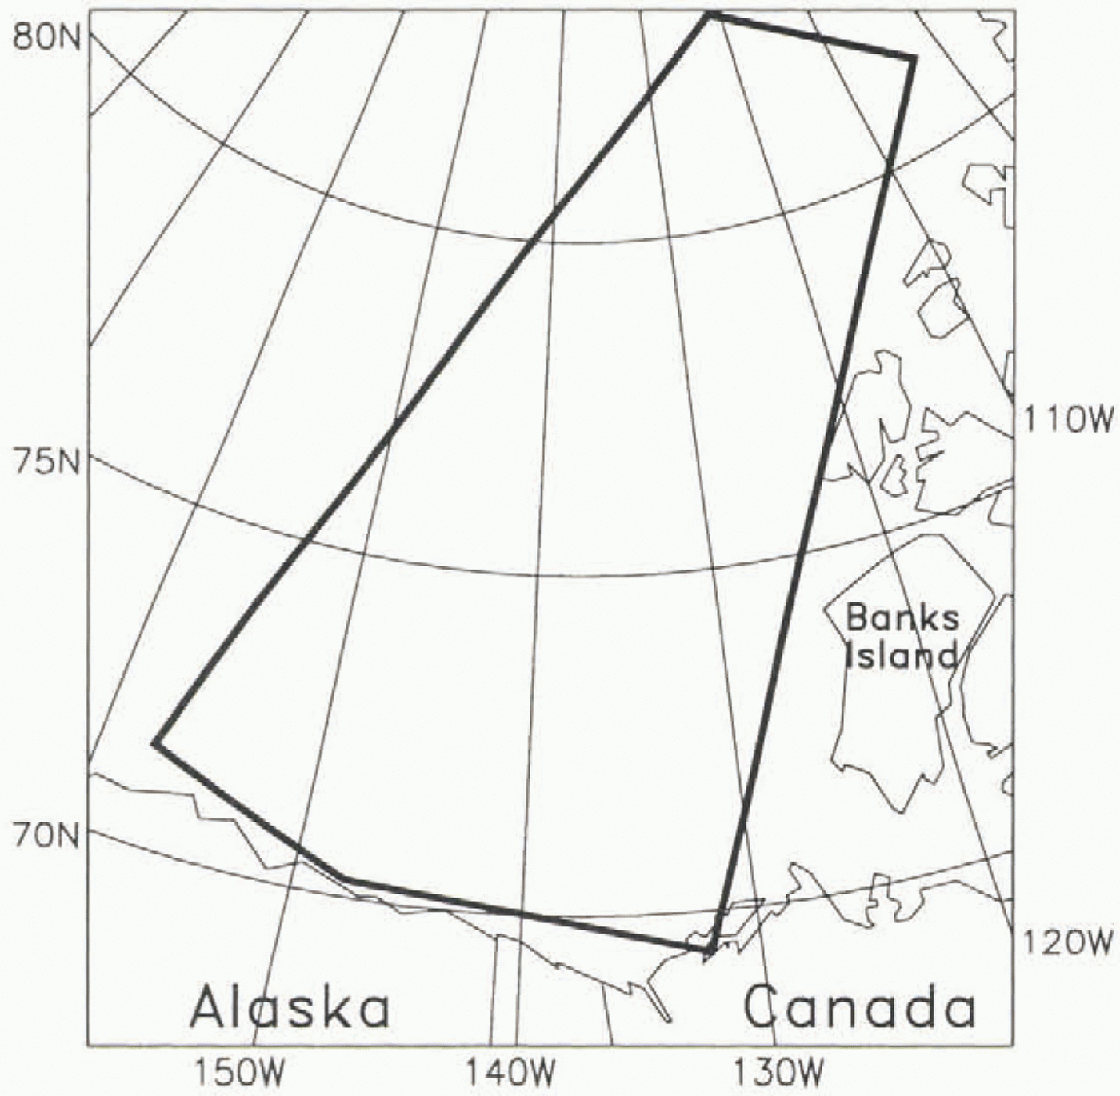
The comparative analysis of the active and passive ice type and concentration estimates was conducted in the region shown in Figure 1. This covers an area of approximately 1.35 × 10⁶km2. The selection of this region was based on the dataset available to us at the time of the study, through the Alaska SAR Facility. All data used were acquired between January 1992 and January 1993.
The comparative analysis uses ERS-1 SAR and SSM/1 data from the region defined by these boundaries.
Gridded SSM/I brightness temperatures From all SSM/I channels were used in the ice type and open-water retrievals. Daily averages were mapped to a 304 × 448 matrix with a grid size of 25 km × 25 km. The 19 and 37 GHz channels were used in the retrieval of total and MY-ice concentrations, and the 22 GHz channel was used in conjunction with the other channels to provide an ocean mask.
A total of 571 ERS-1 SAR images (approximately 44 images per month were used in this study. The ERS-1 SAR is a C-band (5.3 GHz) radar operated with vertical transmit-and-receive polarizations at a look angle close to 20°. the antenna’s elevation beam illuminates an across-track swath of approximately 100 km in width. The image data used in this study were received and processed at the Alaska SAR Facility ASF in Fairbanks. Alaska. The image pixel dimensions are 100 m – 100 m, and ancillary data provided with each image product are used to convert the data into normalized backscatter cross-sections.
Data Analysis
The NASA Team algorithm (Reference Cavalieri, Gloersen and CampbellCavalieri and others, 1984; Reference Gloersen and CavalieriGloersen and Cavalieri, 1986) is used to compute the concentration of open water, first-year (FY) ice and MY ice at each 25 km cell. The learn algorithm is based on a mixing formulation to resolve the MY ice, FY ice and open water within each grid element. The ice and water signatures are assumed to have temporally and spatially stable gradient and polarization ratios. The precision of the open-water estimates, in the Beaufort and Chukchi Seas, ranges between 2.1 (3.1) % and 0.6 (7.4) % (Reference Cavalieri and CarseyCavalieri, 1992). The variance in the MY-ice estimates, when compared with estimates from other sensors, are higher and trends are not evident. The reader is referred to Cavalieri (1992) for a summary of the differences between the Team algorithm ice concentrations and those derived by other sensors.
A backscatter-based classification algorithm (described in Reference Kwok, Rignot, Holt and OnstottKwok and others, 1992) is used to identify ice types in the SAR data. Each pixel is classified into one of the three categories: MY, FY and smooth ice/open water. No attempt is made to resolve the mixture of ice types within a pixel. The persistent backscatter contrast between MY ice and FY ice (Reference Kwok and CunninghamKwok and Cunningham, 1994a) was used to discriminate between the two ice types. The winter algorithm sometimes fails correctly to classify open water and new ice due to overlap in their backscatter distributions. Reference Fetterer, Gineris and KwokFetterer and others (1994) assessed the performance of this algorithm and reported that the precision of MY-ice-concentration estimates are better than 6%. In their comparative study with Landsat data, Reference Steffen and HeinrichsSteffen and Heinrichs (1994) pointed out that FY ice and old ice could be clearly separated based on their scattering coefficients; their study showed an error of 5–8% for compact ice conditions. Our evaluation of the MY-ice-retrieval procedure, using ten pairs of SAR-image data of the geographic location from the 3-day ERS-I repeat cycle, show differences of less than 1%. The results suggest that the signatures are stable at least over the short term and that the higher uncertainty observed by Reference Fetterer, Gineris and KwokFetterer and others (1994) could be due to a combination of spatial or temporal variability in the ice signature over the longer term. The higher-than-normal backscatter of frost-flower-covered sea ice could also be problematic due to its time-dependent signature (Reference Kwok, Cunningham and SteinKwok and Cunningham, 1994b), but it is expected that the area fraction of this ice category will be less than a few percent in the winter Arctic away from the coast. A limitation with this backscatter-based classification is the potential confusion between deformed FY ice and MY ice, especially in the region of transition between the seasonal and perennial ice zones (Reference Rignot and DrinkwaterRignot and Drinkwater, 1994). Both ice types have similar backscatter, and, based on analysis of aircraft SAR data, the MY-ice concentration could be overestimated by as much as 15%.
After the ouset of melt in the spring, the contrast between FY and MY ice at C-band is lost, and there is at present no effective means for ice-type classification in the summer. The summer sea-ice cover at C-band has an average range of backscatter that is between 17 dB and –12 dB. For C-VV. open-water backscatter is dependent on wind speed, and is typically higher than that of the ice cover if the wind speed is above 4–5 m s−1. The azimuthal-look direction introduces 1–2dB of backscatter modulation at ERS-1 look angles. Open water in leads is estimated by using an algorithm (Reference Comiso and KwokComiso and Kwok, 1996) that takes advantage of the higher backscatter of wind-roughened open water relative to the ice cover. Using wind speed from the National Meteorological Center (NOAA) as an initial guess, the thresholds are visually adjusted to discriminate between water and ice. The precision of our ice-concentration estimates are approximately 2–3% during windy conditions (above 4–5m s−1). During calm conditions ice concentrations can also be derived, but the uncertainties are higher because of the decrease in contrast. The prcision in under these conditions, based on repeated visual classification of the images, is approximately 10%. Since melt ponds are blended in with the backscatter of ice and snow on ice floes, the ponds are classified as sea ice in our algorithm. However, sub-resolution leads are not accounted for, and contribute to overestimates (approximately 2%) of the ice concentration. More extensive observations, preferably air-borne surveys, are necessary to quantify this error belter.
Results and Discussion
Co-registered ice type and concentration data derived from both SAR and SSM/I data are plotted in Figure 2. The region of study is divided into five latitude bands with intervals of 2.5° starling at 70°N.
Comparisons of the total ice and multi-year ice concentrations at five latitude bands. (a) >80.0°, (b) 77.5°-80.0°. (c) 75.0°-77.5°. (d) 72.5°-75.0°. (e) 70.0°-72.5°.
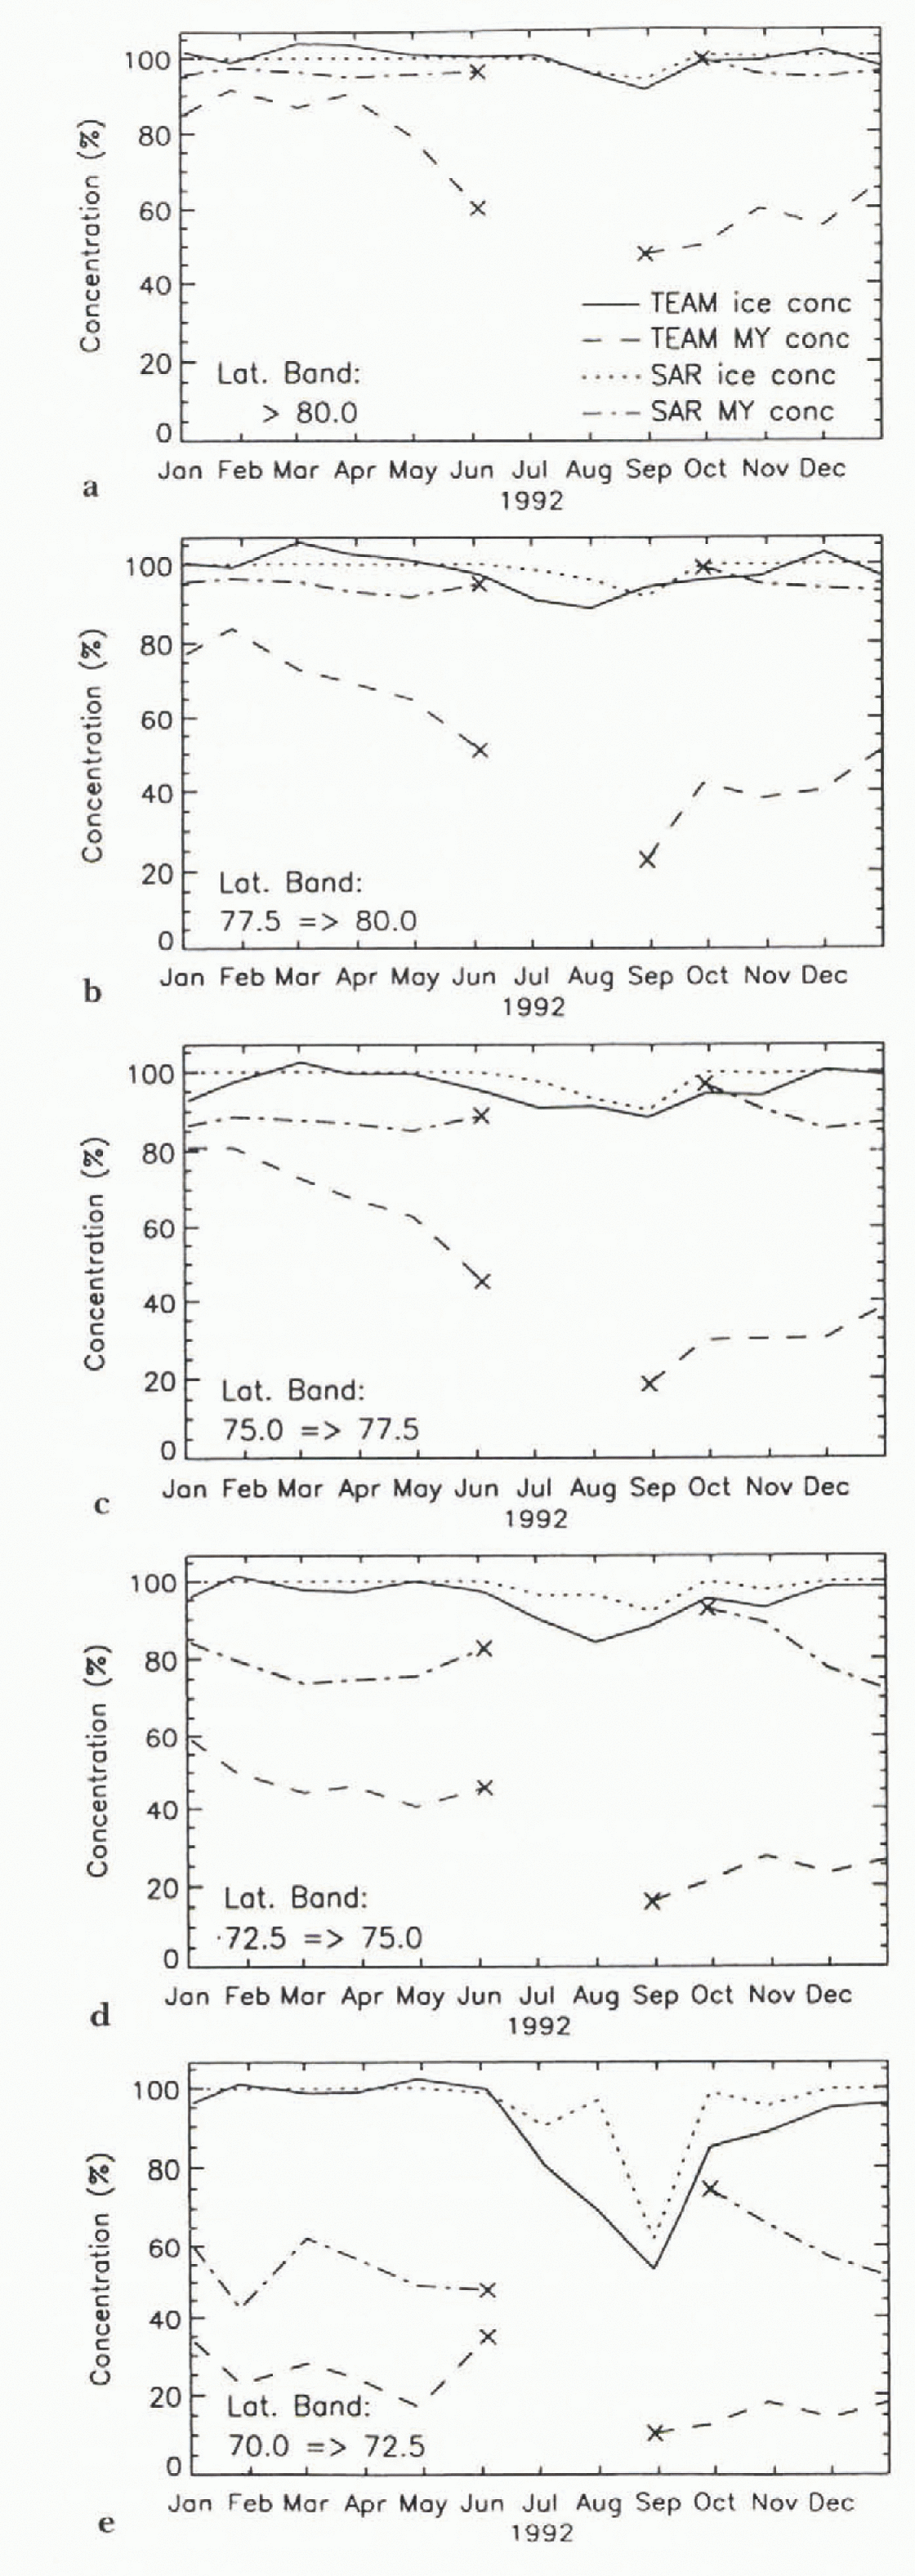
In general, the total ice concentrations in the winter from (January to May) from both the active and passive estimates are similar. The Beaufort Sea is almost 100% icc-covered. When data points lie outside the region of validity in gradient and polarization space, the Team algorithm occasionally provides anomalous estimates of ice concentrations that are greater than 100% during the winter, but the final values are constrained to less than or equal to 100%.
The MY-ice concentrations, as inferred from the two datasets, are quite different. The SAR-derived MY-ice concentrations are quite stable at higher latitudes, and there is no significant increase or decrease in the amount of MY ice except near the transition between the perennial pack and the seasonal-ice zone. These MY concentrations are consistent with ice kinematics during this period, and the expectation is that this parameter remains fairly constant, especially in this part of the Beaufort Sea and the central Arctic (Reference Kwok and CunninghamKwok and Cunningham, 1994a). Within the two lowest latitude bands, we attribute the variability to the advection of MY and FY ice into and out of the region of study, and possibly to the ridging of FY ice.
The Team algorithm results, as shown in Figure 2, indicate a trend of decreasing MY-ice concentration in the higher latitude bands. Between 75° and 77.5° N, there is a greater than 30% decrease in the MY-ice concentration between January and May. Qualitative checks were conducted to see whether this decrease was consistent with ice kinematics that were derived from buoy measurements. During this period (between 1 September 1991 and 1 April 1992) the ice cover is actually slightly convergent (0-10%), which should yield an increase rather than a decrease in the MY-ice concentration. With a mean velocity of 2 cm s−1. the total displacement of the ice is less than 240 km, which is small compared to the study region, which encompasses an area of approximately 1.35 × 10⁶ km2. This trend is thus unlikely to be caused by ice-cover divergence or net advection of MY ice outside the study region. Over a region, the MY concentration between two observations is dependent only on the net divergence or convergence during the interval, with the reasonable assumption that there is very little ridging of MY ice.
Could the decreasing trend be explained by factors other than ice advection and divergence? Figure 3 shows the daily polarizations and gradient ratios of three 100 km × 100 km regions centered at the following geographic locations: A(80° N, 130° W), B(77.5° N, 135° W) and C(7.5° N, 140° W). At high ice concentrations in the winter, the gradient ratio is the principal parameter that allows the separation of MY ice from FY ice. In addition to the small amplitude variations, there is a slowly increasing trend in this parameter in all three regions, and this is especially obvious after day 100. The gradient ratio varies between 0 for 0% MY ice and −0.09 for 100% MY ice. Any increase in this ratio would cause a decrease in the estimated MY-ice concentration. At 100%-ice concentration, an increase of 0.01 in the gradient ratio would decrease the estimated MY-ice concentration by approximately 11%. The increasing gradient ratio in the spring (before melt onset) would therefore cause a decrease in the amount of MY ice in the region. The reasons for the increasing gradient ratio are not speculated on here, except to note that the probable causes are surface or atmospheric effects, since the SAR data showed a constant ice cover. The possible causes of the trends in the gradient ratio are discussed in Reference Gloersen, Campbell, Cavalieri, Comiso, Parkinson and ZwallyGloersen and others (1992) and recently Reference Kwok, Comiso and CunninghamKwok and others (1996).
Plots of the gradient and polarization ratios centered at three different 100km × 100 km regions. (a) A(80° N, 130° W). (b) B (77.5° N, 135° W). (c) (75° N, 140° W).

In the summer, only a comparative analysis of total ice concentrations is made since neither the active or passive algorithms can estimate ice-type concentration. Reference Comiso and KwokComiso and Kwok (1996) provide a more comprehensive analysis of the differences between active and passive observations for this summer period. After the onset of melt in spring, there is a gradual increase in the areal fraction of open water. The SAR-derived ice concentrations are typically higher than those of the Team-algorithm estimates, and the differences are more pronounced at lower latitudes. A possible cause of this (discussed in Reference Comiso and KwokComiso and Kwok, 1996) is the contribution of melt ponds to the open-water estimates. Water in melt ponds has the same passive-microwave signature as that of water in open leads, causing an underestimation of ice concentration by the passive-microwave algorithms. melt ponds should be considered as sea ice covered by a layer of water, and contain ice areas that have very different characteristics than open water from a radiative and mass-balance point of view. The larger difference in the lower-latitude bands may he indicative of the latitude dependence of melt-pond fraction. However, note again that the SAR estimates are biased toward over-estimation of ice concentration, because sub-resolution open leads are most likely classified as ice in the summer time. The relative area contribution of sub-resolution leads and melt ponds in the summer is not known. If the contribution is small, as discussed earlier, for melt-pond concentrations of 20–30%, the melt ponds would seem to be the dominant factor that affects the microwave signatures. In other words, the underestimation of the Team algorithm is more significant than th0e bias introduced by small leads. These biases can only be resolved with high-resolution aerial survey.
At the end of the summer, the surviving ice from the previous spring becomes MY ice. The SAR results show that the MY-ice concentration in early October is roughly equivalent to the SAR-derived ice concentration at the summer’s end (see Fig. 2). Based on the SAR analysis, the ice cover seems to be fairly compact with high concentrations of MY ice at all latitude bands. In the following months, the concentration decreases especially at the lower latitudes), and returns to a level comparable to that of the previous winter. We attribute this decrease in the MY-ice concentration especially in the lower latitudes; to a convergence in the ice cover in the summer, followed by a divergence of the ice cover in November and December. This results in a slightly higher MY concentration than that of the minimum ice concentration in the summer. Indeed, the velocity fields (between 1 April and 1 September 1992) also indicate a convergence of the ice cover in this region, of approximately 10–20% in the summer in the lower latitudes and divergence of a smaller magnitude in the fall. This highly compact ice cover high ice concentration) can be seen in the SAR image data. At this time, the ice cover seems to be composed of primarily MY ice with low FY-ice Concentration. In October, the ice cover has low FY-ice-concentrations whereas in December, the characteristic FY-ice signature flower backscatter) is more evident due to the thickening of the ice in the leads created in the previous months. At this time, the ice cover attains a backscatter character, in terms of MY-ice and FY-ice concentrations, that is similar to that of the previous winter.
The ice concentration at the end of the summer and the MY-ice concentration during the subsequent winter, as inferred by the Team algorithm, are substantially different (about 50%). Such mismatch could occur only if a large percentage of MY ice melts or advects out of the area of study during the autumn. Our analysis of the time sequence of SAR images (Fig. 2) indicates that advection of melt of such magnitude did not occur. The SAR images reveal that the MY-ice cover was fairly constant, especially at high latitudes, during this period. Reference Gloersen, Campbell, Cavalieri, Comiso, Parkinson and ZwallyGloersen and others (1992) provided an explanation for this discrepancy, but it is not felt that the local temporal minimum of Summer-ice concentration at each pixel is an accurate indicator of the fall MY-ice concentration because ice motion and melt ponding are not properly accounted for.
There is also a large difference between MY ice-concentration estimates from the SAR and the Team algorithms. The differences are likely to be due to the spatial variations in the emissivity of sea ice in the Arctic region (Reference CarseyCarsey, 1982; Reference ComisoComiso, 1983). One factor that causes such spatial changes in the emissivity (as high as that of FY ice) is melt ponding, since frozen melt ponds are known to have emissivities of first-year ice (Reference GrenfellGrenfell, 1992). This can be a substantial effect, since 20–30% of the summer ice has been observed to be ponded i personal communication from, W.B. Tucker, 1994). Another factor could be unusually thick snow cover in some areas that can cause flooding (and subsequent refreezing) at the snow-ice interface. Such effects cause the snow ice interface to be saline and the emissivity of the ice floe to be similar to that of FY ice. We also note that the depth of the snow cover tends to decrease the gradient ratio that would lead to a positive bias in the MY concentration.
Do the SAR algorithms overestimate MY-ice concentration? It has been reported (Reference Rignot and DrinkwaterRignot and Drinkwater, 1994) that deformed FY ice has backscatter characteristics similar to that of MY ice in single polarization C-band datasets like ERS-1. This would cause the SAR winter algorithm to overestimate the MY-ice concentration. Due to deformation of the ice cover, the amount of deformed ice should increase as the winter wears on, resulting in a gradual increase in the estimated MY-ice concentration. Such a trend was not observed in the data, at least not within the level of uncertainty of the estimates. The effect of the ridging process is discussed, with an example: if there is a 15% convergence of the ice cover, and this FY-ice area is converted into deformed ice, what is the expected bias in the MY-ice concentration if the signature of deformed ice is identical to that of FY ice? When FY ice ridges, and here it is assumed that we only ridge the very thin ice from closing of leads, the area is not conserved. the mechanical thickness redistribution takes the volume of ice participating in a ridging event, and creates an approximately equivalent volume of ice occupying a smaller area. As a crude estimate, if the assumption is made that all ridged ice is five times its original thickness before ridging (a parameter used by Reference Thorndike, Rothrock, Maykut and ColonyThorn-dike and others, 1975) then the contribution of the FY ice area after convergence is much smaller. The 15% undeformed-ice area now occupies an area of 3%.
This leads to a very significant question. If large volumes of FY ice are piled onto MY ice, is this area labelled as MY ice or FY ice? The SAR algorithms described here would label the area as MY. The passive algorithms might label that area differently, depending on the emissivity of that ice. It does not seem to be important from the heat-flux point-of-view, because thick ice makes a relatively small contribution to the total flux, but it is certainly important from the mass-balance point-of-view. It is possible that deformed FY ice is piled onto the MY ice, and therefore does not increase the concentration of MY ice. even though the polarimetric radar senses a surface type (Reference Rignot and DrinkwaterRignot and Drinkwater, 1994) which seems to be different than that of MY ice. The areal contribution of this deformed FY/MY ice type is not known. If the areal fraction of this surface type is significant, it would affect the passive-microwave retrieval algorithms as well.
Summary/Discussion
Over the annual cycle, the total-ice concentration remained fairly high in the region of study. From the Team-algorithm estimates, a significant decrease was observed in the amount of MY ice (almost 40%) between January and prior to spring melt, and a slow increase in the amount of MY ice between September and December. The MY-ice concentration at freeze up (October) is much lower than the ice concentration at the end of summer (August), an inconsistency in the analysis that suggests an underestimation of MY ice in the winter time.
The SAR analyses suggest an ice cover in the Beaufort Sea that is stable away from the seasonal ice zone, throughout a season, in terms of MY-ice concentration. The amount of MY ice remained approximately constant, within the level of uncertainty of the analysis. The average MY-ice concentration in this part of the Arctic Ocean is approximately 80%. The MY-ice concentration is approximately equivalent to the ice concentration at the end of the summer. These analyses seem to provide a consistent view of the annual cycle from an ice-balance perspective. The C-band radar, to first-order, is not affected by snow cover when the temperature is below freezing, and is much less sensitive to weather effects than the higher frequency radiometer channels. The equivalence between summer ice minima and winter MY-ice concentration, and the small fluctuations in the SAR estimates in the winter, suggest that these estimates are at least consistent. At this point, the analysis of the SAR data offers another estimate of the MY ice, which seems to be consistent with the summer ice concentration.
Because melt ponds have signatures of open water and the Team algorithm does not discriminate between the two surface types, the Team algorithm underestimates the ice concentrations in the summer. If the melt-pond concentration is 30%, then the ice concentration would be underestimated by a similar amount. This is consistent with the differences between the SAR analysis and the learn algorithm analysis: the SAR estimates of total-ice concentration is always higher than that of the Team algorithm estimates in the summer. If the Team algorithm underestimates the total-ice concentration due to melt ponds, especially in the ice margin in the summer, then computed total-ice area would also be underestimated.
The estimates from the SAR and Team algorithms provided two fairly different views of the Beaufort Sea ice cover. the limitations of both algorithms were discussed. The differences explain some of the possible biases of these algorithms due to variability in signature as functions of wavelength and environmental conditions. Future investigations using these datasets should exercise caution in terms of the possible biases introduced by these analysis algorithms.
Acknowledgements
R. Kwok conducted this research at the Jet Propulsion Laboratory, California Institute of Technology, under contract with the National Aeronautics and Space Administration; J. C. Comiso performed this work at the Laboratory for Hydrospheric Processes at NASA Goddard Space Flight Center. This project was supported by the NASA Cryospheric Processes Program under R. H. Thomas.



