Cranberry is a low-growing trailing perennial that is horticulturally managed to form and sustain a continuous canopy across the production area (Mason Reference Mason1926). Growers perform a variety of horticultural and pest management tasks, such as pruning, nutrient application, and weed removal (Davenport Reference Davenport1996; Sandler Reference Sandler2009; Strik and Poole Reference Strik and Poole1991) to maintain a continuous cover of cranberry vines that produce sustainable yields. Historically, vines have been planted into a prepared area and growers have expected a crop lifespan of 30 or more yr (Roper and Vorsa Reference Roper and Vorsa1997). However, the development of new varieties and the need for economic sustainability and efficiency have generated incentives to pursue alternative business models, which can include the establishment of new beds and more frequent replanting of existing beds (i.e., adoption of a 20-year replanting plan). Replanting can be very costly (Cape Cod Cranberry Growers’ Association 2008) and includes activities such as removing existing vegetation and replanting with new cranberry vines. When cranberry vine colonization occurs quickly (i.e., 1 to 2 yr), grower efforts can then be shifted towards fruit production and maximizing farm profitability.
Weeds limit the commercial viability of crop plants by competing for water, air, nutrients, and space (Zimdahl Reference Zimdahl2013). Cranberry vines can be planted as uprooted cuttings that are scattered onto the ground and pushed in with a disk, or as rooted cuttings planted by hand or machine (Sandler Reference Sandler2008). During the initial years of establishment, weeds may establish in the areas between planted vines or transplanted rooted cuttings. Previous research has verified grower experience and demonstrated that weeds negatively impact the establishment, growth, fecundity, and future profitability of young cranberry plantings (Hicks et al. Reference Hicks, Hall and Forsyth1968; Majek Reference Majek2007; Sandler Reference Sandler2009; Welker Reference Welker1967). Competition with weeds can reduce cranberry fruit quality and yield (Else et al. Reference Else, Sandler and Schluter1995; Yas and Eaton Reference Yas and Eaton1982).
Management choices made during the establishment of cranberry vines, including the use of preemergence (PRE) and postemergence (POST) herbicides, may affect the time to first cropping and the long-term productivity of the planting. A single application of a granular napropamide (Nap) formulation at the maximum label rate of 3.72 kg ai ha−1 was the traditional recommended PRE herbicide for new plantings owing to its crop safety and efficacy when applied to weed-free surfaces (DeMoranville et al. Reference DeMoranville, Sandler and Caruso2001; Devlin and Demoranville Reference Devlin and Demoranville1973). A dry flowable Nap product became available in 2009 for use on cranberries, but the efficacy of single or multiple low- or high-rate applications of the dry flowable formulation on weed control in new cranberry plantings was unknown. Labeled in 2008, mesotrione (Mes) was a new alternative for weed control that was safe for use on newly planted cranberry vines (Majek Reference Majek2007). POST efficacy of Mes was demonstrated against several weed species in cranberry (Majek and Ayeni Reference Majek and Ayeni2004) and against goldenrods (Solidago spp.) in another low-growing Vaccinium species, wild lowbush blueberry (Vaccinium angustifolium Aiton) (Boyd and White Reference Boyd and White2010).
The objective of this study was to evaluate the weed control provided by repeated annual applications of Nap PRE and Mes POST as single, multiple, or sequential combinations over a 2-yr period on newly planted vines or cranberry plantings in their second year of growth.
Materials and Methods
Site and Treatment Descriptions
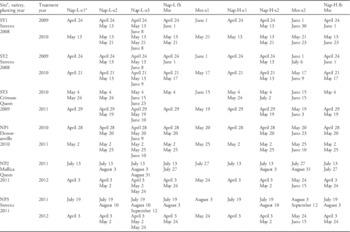
Sites were identified based on planting date and grower willingness to allow access to their farms for the 2-yr duration of the study (Table 1). The sites were prepared and cranberry vines were planted according to recommended practices and grower advice (DeMoranville et al. Reference DeMoranville, Sandler and Caruso2001). Unrooted cranberry cuttings were planted at a density of 4.48 Mg ha−1 and rooted cranberry cuttings (plugs) were planted at a density of 107,593 plugs ha−1. Neither method provides continuous cover at the onset and additional vegetative growth is needed to occupy the remaining open ground space. The study locations, which were a small portion of the renovated area, were managed under the same regime as the rest of the renovated acreage, receiving frost protection, irrigation, fertilizer, etc., as required for optimizing establishment and colonization of newly planted vines.
Summary of site, variety, and planting and application dates for herbicide treatment experiments on cranberry in Massachusetts.

a Abbreviations: SY, second-year plantings (initial treatment in the second year of growth); NP, new planting (initial treatment in the first year of growth); Nap-L, napropamide applied once, twice or thrice at 3.36 kg ai ha–1; Nap-H, napropamide applied once or twice at 5.04 kg ai ha–1; Mes, mesotrione applied once or twice at 210 g ai ha–1; and fb, followed by.
Sites were categorized by bog age. Those initially treated in the year of planting plus the subsequent year were identified as “new plantings” (NP), and sites initially treated in their second year of growth plus the subsequent year were identified as “second-year plantings” (SY). There were three sites in each group (NP1, NP2, NP3; SY1, SY2, SY3). SY1, SY2, and NP3 were planted with the cultivar ‘Stevens’, a variety released to the industry in 1950 and currently planted on approximately 25% of Massachusetts cranberry acreage (Cannon and Sandler Reference Cannon and Sandler2016). These vines were planted as unrooted cuttings that were disked into the ground. SY3, NP1, and NP2 were planted as plugs (rooted cuttings) with newly released large-fruited hybrid varieties ‘Crimson Queen’, ‘Demoranville’, and ‘Mullica Queen’, respectively (Clark and Finn Reference Clark and Finn2010). SY1 and NP2 were located in Carver, Massachusetts (41°55′N, 70°46′W and 41°54′N, 70°45′W, respectively); SY2 and NP3 were located in Plymouth, Massachusetts (41°53′N, 70°43′W and 41°55′N, 70°40′W, respectively); SY3 was located in Wareham, Massachusetts (41°47′N, 70°43′W); and NP1 was located in Marion, Massachusetts (41°54′N, 70°44′W).
In the year prior to the study, a single midsummer POST application of Mes (210 g ai ha−1) was applied at SY1 and a single PRE application of dry flowable Nap (5.04 kg ai ha−1) was applied at SY3. SY2 received spot POST treatments with sethoxydim at 184 g ai ha−1. All second-year plantings were hand-weeded to remove plants that escaped herbicide control. All tasks were conducted over the entire site. These management practices provided locations that were virtually weed-free at the start of the study.
Plots were 2 by 4 m, except those at SY1 and SY2, which were 2 by 7 m. All plots were separated by at least 0.5 m. Newly planted plots were established as soon as possible after the vines were planted. Second-year sites were established in late spring the year after the vines were planted. Plots received one of ten treatments, which were administered each year for a 2-yr period (Table 1). Treatments were replicated five times and arranged in a randomized complete block design. Applications simulated chemigation (delivered in 3,735 liters of water per hectare) and were applied via an 11.4 L CO2-powered backpack sprayer with flat-fan nozzle (TeeJet 1004vs). A nonionic surfactant (Induce®, Helena Chemical Co, Collierville, TN) was added to Mes applications at 0.25% (v/v).
Vegetation Surveys
Surveys of the vegetation in the treated and nontreated plots were conducted on an annual basis after the treatment regime had concluded for the year. Weeds were not present at the beginning of the study. Percent coverage of each plant species was estimated visually using five estimate groupings (see below). Two observers recorded their estimations independently. Discrepancies in which the observers’ estimates differed by more than one grouping were resolved by averaging the two estimates. Discrepancies in which the observervers’ estimates were adjacent groupings were resolved by re-evaluation. Most species were identified in the field or identified through use of common flora (Gleason and Cronquist Reference Gleason and Cronquist1991; Uva et al. Reference Uva, Neal and DiTomaso1997). Unknown species were sent to the University of Massachusetts Amherst Herbarium for identification.
Percentage cover ranges (groupings) for cranberry and weed species were as follows: 0% coverage=0, 1% to 10% coverage=1, 11% to 30% coverage=2, 31% to 60% coverage=3, 61% to 90% coverage=4, and >90% coverage=5. To estimate percentage ground cover based on these integer values (Kent and Coker Reference Kent and Coker1992; Sandler Reference Sandler2004), the midpoint of each cover class percentage range, y, was plotted against the cover class (integer) value, x. The best-fit relationship was the second-order polynomial equation:
 $$y\,{\equals}\,1.071x^{2} {\plus}17.02x{\minus}15{\rm }\left( {R^{2} {\equals}{\rm }0.99} \right).$$
The integer value for each weed species was inserted into the equation and percentage cover was calculated. Total weed cover was calculated by summing the percentage cover estimations generated from Equation 1 for all weed species in a plot. In some instances, total weed cover could exceed 100% (Kent and Coker Reference Kent and Coker1992).
Visual assessments of total weed cover, as well as the number of weed species present, were conducted each year at all second-year plantings and NP1 during mid- to late August. Cranberry vines are typically planted by mid- to late May to allow time for maximal vine colonization in the planting year. Since NP2 and NP3 were planted in mid-summer, surveys of those sites were delayed until early October (but conducted prior to any frost event) to allow for maximal growth of weed and cranberry biomass in the planting year.
Biomass
For each plot, aboveground cranberry and weed biomass within a randomly placed 930-cm2 quadrat was collected each year in September, prior to any frost event, for all second-year plantings and NP1, or in October for NP2 (2011) and NP3. Owing to an unplanned herbicide application by the grower in June 2012, and anticipating rapid loss of weed biomass, biomass in plots at NP2 was harvested in early July 2012 before the unplanned treatment had any obvious visual effect. Hand clippers were used to cut around the perimeter of the quadrat to permit collection of cranberry tissue or weeds within the quadrat. The plants were clipped as close as possible to the bog surface, and samples were then separated into cranberry vines and weeds. Weeds were identified (Gleason and Cronquist Reference Gleason and Cronquist1991; Uva et al. Reference Uva, Neal and DiTomaso1997) and all individuals of a similar species were placed in a paper bag for transport to the laboratory.
Individual weed species dry biomass data were grouped by basic plant type (monocot or dicot). The total amount of weed biomass was calculated by summing monocot and dicot biomass from each plot and averaged across replicates. Cranberry vines were evaluated for various yield components (Eaton Reference Eaton1978) including number and weight of reproductive and vegetative (nonflowering) vertical stems (uprights), runners (stolons), and total plant dry weight. Total cranberry biomass was calculated as the sum of vegetative and reproductive upright biomass combined with runner biomass. After sorting, all samples were oven-dried for at least 36 h at 60 C prior to quantifying cranberry and weed dry biomass. Biomass was used to rank weed species into predominant and minor species. Fruit yields were not part of the data collection as vegetative growth is promoted over fruit production to accelerate vine colonization in the first years of establishment (DeMoranville et al. Reference DeMoranville, Sandler and Caruso2001).
Statistical Analysis
Data were analyzed with Statistical Analysis Software (SAS version 9.4, SAS Institute Inc., Cary, NC). Model assumptions were tested through residual analysis (Shapiro-Wilk statistic) and no transformations were needed. Bog age (new or second-year plantings), herbicide treatment, and their interactions were tested for significance. When indicated, site by treatment interactions within bog age were also evaluated for significance. Treatment effect did not vary by bog age for dicot weeds or cranberry biomass. Treatment effect did vary by bog age for total weed biomass, so data were analyzed with bog age (2 levels) and treatments (10 levels) as the fixed variables and replicate as the random variable. Treatment effects varied by site within bog age for total weed cover, so data were subsequently analyzed by site (3 levels) and herbicide treatment (10 levels) as above. Data were analyzed using Proc Mixed; Tukey’s Honestly Significant Difference test was used to compare differences between individual means (P ≤ 0.05) for all significant treatment levels. Using Proc GLM, planned (a priori) single degree of freedom contrasts were constructed to compare the following groupings of the herbicide treatments (P ≤ 0.05): Mes-only and Nap-only, herbicide treatment and no treatment, and single application and multiple applications. Correlations using the biomass data were assessed with the use of Pearson correlation coefficients (P=0.05).
Results and Discussion
Weed Species
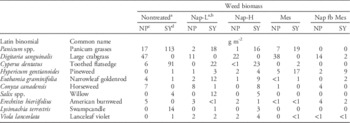
When weed species identified in vegetation surveys were ranked according to biomass production, the predominant monocots were found to be large crabgrass [Digitaria sanguinalis (L.) Scop.], toothed flatsedge (Cyperus dentatus Torr.), Panicum spp., and various panicgrasses including western panicgrass [Dichanthelium acuminatum (Sw.) Gould & C.A. Clark var. fasciculatum (Torr.) Freckmann] (Table 2). Predominant dicot species were found to be pineweed [Hypericum gentianoides (L). B.S.P.], narrowleaf goldenrod [Euthamia graminifolia (L.) Nutt.], horseweed [Conyza canadensis (L.) Cronq.], willow (Salix spp.), American burnweed [Erechtites hieraciifolius (L.) Raf. ex DC.], swampcandle [Lysimachia terrestris (L.) B.S.P.], and lanceleaf violet (Viola lanceolata L.) (Table 2). Evaluation of the rankings by bog age indicated that large crabgrass was successful in colonizing new plantings but was rarely detected in second-year plantings, and that toothed flatsedge was rarely noted in new plantings but was predominant in second-year plantings. Panicum spp. regularly established in both planting types but produced more biomass in second-year plantings.
Predominant weed species, determined based on biomass collected from cranberry plantings treated annually with various herbicide applications for a 2-yr period (data pooled over years and sites; n=30 for nontreated; n=60 for Nap-H, Mes, and Nap fb Mes; n=90 for Nap-L.

a Abbreviations: Nap-L, napropamide applied once, twice, or thrice at 3.36 kg ai ha–1; Nap-H, napropamide applied once or twice at 5.04 kg ai ha–1; Mes, mesotrione applied once or twice at 210 g ai ha–1; fb, followed by; NP, new planting (initial treatment made in first year of growth); SY, second-year (initial treatment made in second year of growth).
b Treatments made during each growing season.
c Data collected from three sites: NP1, cv. Demoranville, Marion, MA; NP2, cv. Mullica Queen, Carver, MA; NP3, cv. Stevens, Plymouth, MA.
d Data collected from three sites: SY1, cv. Stevens, Carver, MA; SY2, cv. Stevens, Plymouth, MA; SY3, cv. Crimson Queen, Wareham, MA.
Nap can control over 20 different species of grasses as well as some dicot weeds and is used as a PRE herbicide (Anonymous 2009). Mes can be used both PRE and POST and can control more than 50 species of dicot weeds, many of which overlap with the Nap dicot weed range (Anonymous 2015). Although both PRE applications of Nap and POST applications of Mes are labeled to control large crabgrass, this weed was still able to colonize new planting sites. However, once cranberry vines colonized more of the area (second-year planting sites), crabgrass was well controlled by either herbicide (Table 2). Nap is labeled for PRE control of Panicum spp., and plots receiving this herbicide had less Panicum biomass than did nontreated plots. Mes is labeled for control of Cyperus spp., and toothed flatsedge was well controlled with Mes in both bog types. Both Nap and Mes suppressed swampcandle biomass production, although the plant is not specifically mentioned on the herbicide labels.
Several factors should be considered when selecting the appropriate herbicide or combination of herbicides for use in a new cranberry planting. Resources utilized in the renovation and establishment process, such as vines and sand, may affect the composition of the weed community that enters as early colonizers (Sandler Reference Sandler2008). Changes in weed community composition can affect weed management decisions, and growers should account for noteworthy shifts in weed populations over time (Derksen et al. Reference Derksen, Thomas, Lafond, Loeppky and Swanton1995). In addition, weed species found on or near the production surface can also be influenced by surrounding land resources and upland habitat (Mason et al. Reference Mason, Sandler and Hunsberger2006; Skroch and Dana Reference Skroch and Dana1965). Knowledge of the plant community composition prior to renovation should inform the decision-making process regarding the selection of an appropriate weed management program.
Weed Biomass
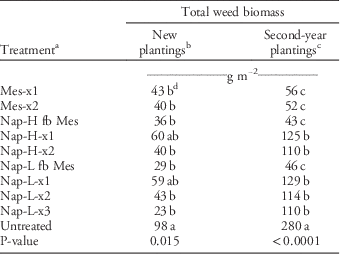
The effect of herbicide treatment on total weed biomass varied by bog age, and year data were pooled over sites for analysis (Table 2). At new-planting sites, plots receiving treatments other than a single Nap application had less total weed biomass than did the nontreated plots (Table 3). At second-year plantings, plots receiving any herbicide treatment had less total weed biomass that did the nontreated plots; in addition, plots receiving Mes during the treatment regime had the lowest total weed biomass among the Nap-treated and nontreated plots. Correlation analysis indicated that monocot biomass production at new-planting and second-year sites was the primary positive predictor for total weed biomass (P < 0.0001), as opposed to the contribution associated with dicot biomass (data not shown). The coefficients of determination showed that monocot biomass accounted for the largest portion of variance associated with total weed biomass for new and second-year plantings (77% and 84%, respectively).
Average total weed biomass (collected annually) from cranberry plantings treated annually with various herbicide applications for a 2-yr period (data pooled over years, N=30).

a Abbreviations: Nap-L, napropamide applied once, twice, or thrice at 3.36 kg ai ha−1; Nap-H, napropamide applied once or twice at 5.04 kg ai ha−1; Mes, mesotrione applied once or twice at 210 g ai ha−1; and fb, followed by. Treatments made during each growing season.
b New plantings (initial treatment made in first year of growth). Data collected from three sites: NP1, cv. Demoranville, Marion, MA; NP2, cv. Mullica Queen, Carver, MA; NP3, cv. Stevens, Plymouth, MA.
c Second-year plantings (initial treatment made in second year of growth). Data collected from three sites: SY1, cv. Stevens, Carver, MA; SY2, cv. Stevens, Plymouth, MA; SY3, cv. Crimson Queen, Wareham, MA.
d Means within each column followed by similar letters are not significantly different according to Tukey's Honestly Significant Difference test, P=0.05.
Plots receiving treatment with multiple Nap applications, or any treatment including a Mes application, controlled weed growth equally well on new plantings, whereas plots receiving Mes treatments produced the least weed biomass (compared to Nap treatments and nontreated) on second-year plantings (Table 3). Label language indicates that Nap works best when applied to a weed-free surface (Anonymous 2009), and the results herein support that recommendation. In strawberry (Fragaria L.), Nap alone was insufficient to prevent weed competition (Pritts and Kelly Reference Pritts and Kelly2001), and the authors acknowledged that results from herbicide applications can vary depending on the spectrum of weed species present. Annual grasses were the predominant weeds at new-planting sites (Table 2) and were effectively controlled by Nap. These results indicate that treatments combining Nap with another herbicide provide good weed control for newly planted cranberry vines. Similar conclusions have been drawn from studies of mulched strawberry (Gilreath and Santos Reference Gilreath and Santos2005). Research in other low-growing Vaccinium species indicated that multiple applications of a single herbicide improved grass control (Yarborough and Bhowmik Reference Yarborough and Bhowmik1989).
Total Weed Cover
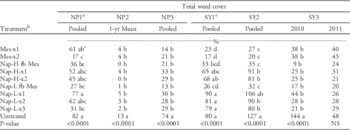
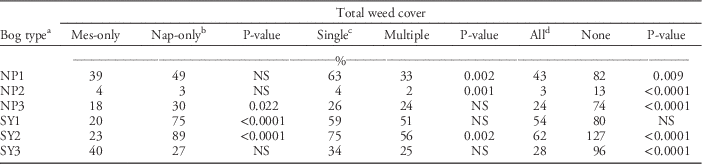
Treatment effects on total weed cover varied by site and bog age, and year data were pooled for all sites except SY3 (NP2 only had one year of survey data). Effects of herbicide treatment on the visual assessments of total weed cover aligned well with the collected quantitative data on weed biomass (Tables 3 and 4). Total weed cover was lower for herbicide-treated plots compared to nontreated plots for NP2 and NP3 (Table 4). At NP3, contrast analysis indicated that plots receiving Mes-only treatments had lower total weed cover than those receiving Nap-only treatments (Table 5). Although weed cover data for five treatments at NP1 were statistically similar to the total weed cover measured in the nontreated plots (Table 4), linear contrasts indicated that the application of any herbicide treatment resulted in lower total weed cover when compared to nontreated (43% vs. 82%; Table 5). Any Mes-containing treatment had lower total weed cover than both Nap-only and nontreated plots at SY1 and SY2 and than the nontreated plots at SY3 in 2010 (Table 4). Linear contrast analysis showed improved performance of the Mes-only treatments at SY1 and SY2 (Table 5). In addition, for three of the six locations multiple herbicide applications reduced total weed cover compared to a single application.
Percentage total weed cover in cranberry plantings treated annually with various herbicide applications for a 2-yr period. Data pooled or presented by year depending on interaction significance. Pooled data, N=10; single year data, n=5.

a Abbreviations: NP, new planting (initial treatment made during first year of growth); NP1, cv. Demoranville, Marion, MA; NP2, cv. Mullica Queen, Carver, MA; NP3, cv. Stevens, Plymouth, MA; SY, second-year planting (initial treatment made in second year of growth); SY1, cv. Stevens, Carver, MA. SY2, cv. Stevens, Plymouth, MA; SY3, cv. Crimson Queen, Wareham, MA. NP2 had only one year of data due to unplanned herbicide application.
b Nap-L, napropamide applied once, twice or thrice at 3.36 kg ai ha–1; Nap-H, napropamide applied once or twice at 5.04 kg ai ha–1; Mes, mesotrione applied once or twice at 210 g ai ha–1; fb, followed by. Treatments made during each growing season.
c Means, within each column, followed by similar letters are not significantly different according to Kramer-adjusted Tukey’s Honestly Significant Difference test, P=0.05.
Summary of single degree-of-freedom contrasts for percentage total weed cover assessed at cranberry plantings treated annually with various herbicide treatments for a 2-yr period.

a Abbreviations: NP, new planting (initial treatment made in first year of growth). NP1, cv. Demoranville, Marion, MA; NP2, cv. Mullica Queen, Carver, MA; NP3, cv. Stevens, Plymouth, MA; SY, second-year (initial treatment made in second year of growth); SY1, cv. Stevens, Carver, MA; SY2, cv. Stevens, Plymouth, MA; SY3, cv. Crimson Queen, Wareham, MA; Mes-only, plots receiving annual treatments of one or two applications of mesotrione at 210 g ai ha–1; Nap-only, plots receiving annual treatments of one, two, or three applications of napropamide at 3.36 kg ai ha–1 or one or two applications at 5.04 kg ai ha–1.
b Comparison of plots receiving mesotrione only to plots receiving napropamide only.
c Comparison of plots receiving a single herbicide application to plots receiving multiple herbicide applications.
d Comparison of all plots receiving herbicides to nontreated plots.
General Cranberry Growth
No treatment effects were noted for number or biomass of cranberry vegetative uprights, reproductive uprights, or runner biomass (data not shown). The effect of treatment on mean total cranberry biomass varied by bog age and year. All new-planting sites had poor colonization by cranberry vines, with biomass ranging from 24 to 127 g m−2 by the end of year 1 and from 67 to 245 g m−2 by the end of year 2. With unrooted vines that are disked in, adequate vine growth in year 1 should approach 200 to 300 g m−2, and continuous vine canopy is reasonably assured when cranberry biomass values are in the range of 590 to 725 g m−2 (Sandler Reference Sandler2009). SY3 had reasonable coverage (109 to 245 g m−2) in its second year but vines failed to substantially cover the production surface by the third year (218 to 307 g m−2). SY1 and SY2 had good vine coverage, with 243 to 498 g m−2 and 254 to 354 g m−2 in their second year of growth, respectively, and 650 to 1035 g m−2 and 572 to 802 g m−2 in their third season, respectively.
The poorest cranberry biomass production came from sites planted in the new hybrid varieties: Demoranville (NP1), Mullica Queen (NP2), and Crimson Queen (SY3) (data not shown). At the time of the study, growers had limited or no experience with the growth habit and requirements of the new hybrids, and this inexperience likely led to management decisions that influenced vine colonization at the study sites. Factors such as site characteristics, cultivar selection, fertilizer, and pest management can influence the establishment of low-growing Vaccinum species (Yarborough Reference Yarborough2012). These and other factors, including vine quality, planting density, use of rooted plugs vs. unrooted cuttings, and water management, may play a larger role in cranberry vine colonization than the suppression of weed biomass in some situations. This relationship warrants further investigation.
Effective weed control during the establishment of perennial fruit species (Foy et al. Reference Foy, Drake and Pirkey1996; Soczek et al. Reference Soczek, Mackiewicz, Lucak and Kowalski1977; Zabadal and Dittmer Reference Zabadal and Dittmer2001) is often linked to long-term productivity and should be part of any cranberry bed renovation program. The lack of improved weed control translating into increased cranberry biomass production may be related to the duration of the study, which may not have been of sufficient length to adequately measure the impacts of early weed control on the vegetative growth of perennial cranberry vines. Other work has shown that weed competition can reduce fruit yield and quality of cranberry (Patten and Wang Reference Patten and Wang1994) and strawberry (Pritts and Kelly Reference Pritts and Kelly2001), but weed biomass may not be the best predictor of vegetative growth for perennial plants. Longer studies that follow weed control from initial colonization of the crop through fruit production may clarify the relationship.
Although no obvious cranberry vine injury (from herbicides) was noted, cranberry vine colonization at the sites planted in the new hybrid varieties was poor (data not shown). Lack of vegetative growth (i.e., colonization) would be expected to translate into significant economic ramifications due to delays in the transition to fruit production. Growers have reported that planting methods and fertilizer and irrigation regimes that efficiently promote colonization with the traditional varieties (e.g., ‘Early Black’ and ‘Howes’) and hybrids (e.g., ‘Stevens’) may not be most efficacious approach for the new hybrid varieties. Lack of certainty about the optimal management practices has slowed the adoption of these new hybrids; eight years after their introduction, growers surveyed in 2014 reported that these new hybrid varieties accounted for less than 5% of all Massachusetts cranberry acreage (Cannon and Sandler Reference Cannon and Sandler2016). Verification of grower experiences regarding establishment of vigorous cranberry hybrids should be validated through future field studies.
Acknowledgements
The author acknowledges the excellent technical support of K DeMoranville and N Demoranville over the course of the entire project. The author is grateful for the use of farm parcels owned by the AD Makepeace Cranberry Company, Mr Peter Beaton, and Mr Doug Beaton. Additional technical support by K Ghantous, J O’Connell, T Revell, and summer assistants is also recognized. The author is grateful for the plant identification services provided by Dr K Searcy, University of Massachusetts Herbarium. This research was partially funded by United Phosphorus, Inc, and the support of Mr Tony Estes is gratefully acknowledged.