1. Introduction
1.1 In this paper we survey the recent and expected development of annuity business in the UK, focusing on changes during the last decade approximately, and on the current or emerging issues affecting this business.
1.2 The pace of development in insurance is often said to be accelerating. In the case of annuities there has perhaps been more change in the last decade than in the previous half century. Insurers and actuaries operating in this business are still coming fully to terms with the consequences of so much change, albeit much of it has been generated by insurers themselves.
1.3 It appears certain that the next few years will bring even more change than the last few. Trends already started in pricing, underwriting, investment strategy and risk management will continue; regulatory change will be a powerful influence, including but not limited to the implementation of Solvency II; and further consequences are likely from the 2008 banking crisis and its macro-economic consequences.
1.4 In this paper we do not seek to develop or promulgate new techniques for the management of annuity business. Rather, it is our intention to undertake a review of current best practice, as this has developed substantially in several areas over recent years. We also attempt to identify where developments are likely to occur in the future, and what new issues may emerge, including (but not only) in the regulatory environment. We explore in successive chapters:
(1) The market for annuities: The size of the new business market has increased substantially and is expected to continue doing so. The demand for a variety of product features has grown, as has the range of ‘alternative’ products other than the traditional non-profit annuity. Whilst this paper as a whole focuses on non-profit annuities in the UK, we also discuss the features of alternative products, and the characteristics of some overseas annuity markets.
(2) Longevity risk: Whilst the challenge of forecasting future longevity trends has been addressed by much research and debate, a high degree of uncertainty remains. We also discuss the underwriting and pricing of longevity for individuals, which has become, if not yet the norm, at least widespread; and the emergence of a market for ‘stand-alone’ longevity risk transfer.
(3) Financial management: The rules within which capital requirements are set, and performance is reported, are fundamental influences on management. New capital and performance measures have been introduced, and then in some cases superseded, making the management of long-duration business (especially investment strategy) very challenging. We discuss the impacts of past and likely future changes in these metrics.
(4) Investment management: The complexity of investment strategies and operations has increased greatly, from a starting point that was typically passive and low-risk. We discuss the challenges involved in managing performance and risks under a more complex investment strategy, and the likelihood of further change.
(5) Enterprise risk management: The emergence of ERM presents both an opportunity and a challenge to annuity insurers, given the almost unique complexity of the business's risk profile. We discuss the importance of choosing an appropriate ERM framework for the business, and the specific issues that arise for annuities.
(6) Solvency II: Although the full rule set has not yet been defined, it is clear that Solvency II will not only present a considerable technical challenge in its implementation, but will also profoundly affect annuity insurers and customers. We discuss the current proposals tabled by the Committee of European Insurance and Occupational Pensions Supervisors (CEIOPS) and how these will affect annuities, in some technical detail. However, we emphasise that the most important aspect of Solvency II for annuities will likely be the financial and practical consequences of changed capital requirements. We draw attention to the potential systemic effects on retirement provision.
1.5 Our focus is on non-profit non-linked lifetime annuities issued in the UK. We mention other product types where a comparison or contrast is helpful, but we do not explore them in detail.
1.6 Bulk purchase annuities (BPAs) have recently been the subject of a separate Working Party report by Hawes et al. (Reference Hawes, Collinge, Erasmus, Fulcher, Houlihan, Patel, Rahman, Sinclair, Siu, Teggin and Yang2009), and we do not repeat the specifics of BPA business in this paper, except where we consider it worthwhile in the context to do so.
1.7 We hope that this paper will help to stimulate discussion of how actuaries and the insurers they advise can better understand, communicate and manage the risks undertaken by writing annuity business. This will serve the best interests not only of the insurers themselves but also of current and future customers that the industry and profession are seeking to serve.
2. The Market for Annuities
2.1 UK Annuity Market Background
2.1.1 The annuity market in the UK has a long and varied history as described in overview by Cannon & Tonks (Reference Cannon and Tonks2008) and in more detail by Lewin (Reference Lewin2003) and others. The evolution of the market into the shape and structure that currently prevails has its main origin in the Finance Act 1956 which introduced, in exchange for a new tax relief (for the self-employed) on pension contributions, the requirement to purchase an annuity with these accumulated funds, now known as compulsory annuitisation. This was given further impetus by the introduction in 1988 of personal pensions, which allowed employed individuals to make tax-deductible pension contributions independently of their employer's pension arrangements.
2.1.2 Savings into such arrangements have enjoyed substantial tax advantages, with contributions typically attracting relief from income tax at the individual's marginal rate, funds free from taxation in the accumulation phase and a lump sum available at retirement that has been free from tax. However, these have been the subject of increasing attention from H.M. Treasury, which started with the abolition of Advance Corporation Tax in 1997 which adversely affected the dividends payable to pension funds. Further limitations on total contributions and eligible fund size were then introduced in the ‘pensions simplification’ rules in 2006, together with a limitation of the lump sum (now known as the Pension Commencement Lump Sum) to a maximum of 25% of the accumulated funds. More recently, restrictions were introduced in April 2009 on the availability of higher rate tax relief on contributions for high earners. Further details of regulatory and legislative developments are discussed in paragraph 2.5 below.
2.1.3 The UK has an ageing population, and currently requires that most accumulated defined contribution pension funds must be used to purchase an annuity by the age of 75, although there has been a growing debate both within the industry and in the political arena relating to this requirement. The Investment Management Association (2008a, 2008b) produced two reports which challenged the current regulations and gave an overview of a number of possible income drawdown approaches for retirement income by analysing a number of strategies. Most recently, this topic has been aired in the political arena, with the announcement by the Shadow Chancellor that, if elected, an incoming Conservative Government would scrap the requirement to buy an annuity by age 75.
2.1.4 However, it is not our intention to debate the merits or otherwise of the current social security, taxation or regulatory environments that impact upon the annuity market in the UK. Instead, our aim is to report upon the impact of the current environment on this market, and to reflect on how the risks introduced to an insurance company by writing annuity business are being managed in an effective manner by actuaries and the companies they advise.
2.2 Overview
2.2.1 This paper has a particular focus on the UK non-linked annuity market, and will mention other closely-related product areas such as investment-linked and with profit annuities offered in the UK. We will draw on Mintel (2009) and other sources. However, this paper will not focus in any particular depth on the BPA market, as this has recently been covered in a separate Working Party by Hawes et al. (Reference Hawes, Collinge, Erasmus, Fulcher, Houlihan, Patel, Rahman, Sinclair, Siu, Teggin and Yang2009). BPA ‘buy-out’ contracts will often result in the provider issuing individual annuity contracts to former scheme members which (other than any initial sales consideration and some features of annual escalation) will then typically be managed alongside other individual annuity contracts that the provider has issued. In addition, in this section of the paper we will briefly review some of the other international annuity markets, and will also briefly look at the developments in the UK variable annuity market, but will not consider in detail any of the particular management issues such as product design, pricing and hedging.
2.2.2 The UK has a substantial individual annuity market, with payments to annuitants from insurance companies of around £10bn made annually, and new premiums of around £12bn made each year to insurance companies for new (mostly pension) annuities according to ABI data. The current requirement to purchase an annuity by age 75 means that it is very likely that the UK annuity market will continue to grow, and the scheduled introduction of the National Employment Savings Trust (formerly known as ‘Personal Accounts’) from 2013 is likely to give the UK annuity market further impetus in the future. There are also factors that may reduce the growth of the annuity market, for instance the reduced attractiveness since 2009 to higher income earners of making pension contributions. However, current forecasts suggest that the amount of new premiums available will more than double over the next decade.
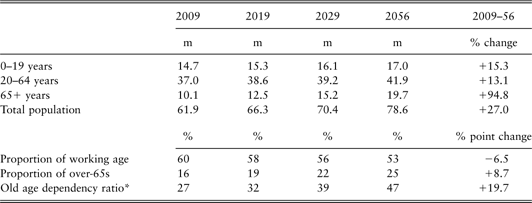
2.2.3 Projections from the Government Actuary's Department (GAD) (see Table 1) show that the UK's ageing population will increase the potential number of annuitants, as more people are required to make independent provision for their retirement. The increased longevity expected will continue to shape the UK population and will potentially continue pressing annuity rates lower. Over the next few decades, the number of people aged over 65 will increase sharply, so that by 2056 a quarter of the population is expected to fall into this age group, while the proportion of people of working age will fall by more than 6 percentage points to little over half the entire population.
Projection of UK adult population and dependency ratios.

*the over-65s as a proportion of the working population (i.e. adults aged 20–64).
Source: National Statistics/GAD.
2.2.4 In terms of current annuity purchases, the economic turbulence of the 2008 ‘credit crunch’ has reduced the value of accumulated pension funds and may be causing some customers to delay their retirement, especially while reduced interest rates have made the level of annuity rates seem less attractive. In addition, there is evidence that UK pensioners are changing their attitudes towards retirement, and that their sources of income during retirement are becoming more diversified, including for example more part-time work.
2.2.5 Historically annuity purchases had been relatively simple transactions, with few options available to customers who usually bought their annuity from the same provider with whom the customer had accumulated their pension funds, and premium rating factors typically limited to age, gender and purchase price. In recent years there has been considerable innovation in the annuity market as providers have developed more flexible products, and have been implementing more sophisticated underwriting and pricing strategies, including setting prices according to occupation, lifestyle, medical condition, smoking habits, postcode and other factors. This has meant that even providers that only offer ‘standard’ conventional annuities need to be aware of the likely change in the profile of its customers, as more ‘select’ lives (typically those that are likely to experience worse mortality) are offered better terms by other (enhanced annuity) providers. One of the important options generally available within the accumulation pension products has been the open market option (OMO) which allows the individual to transfer the accumulated fund at vesting date to an alternative annuity provider. There has recently been an increased awareness of, and regulatory focus on, the availability of the OMO which has seen many providers implementing an improved transfer system which is leading to an improved customer experience.
2.2.6 However, with these developments has come increased complexity, including the expansion in availability and take-up of enhanced/impaired annuities and the introduction of variable annuities. While this is likely to have positive implications for consumers, the increased complexity may result in less consumer understanding and inertia in the face of such uncertainties. Despite this increasing complexity, over recent years there has been a noticeable move in sales of pension annuities away from advised (IFA) sales towards non-intermediated (direct) sales, largely driven by the use of the internet by consumers. An increasing familiarity with the technology and the ready availability of detailed online information (including, for instance, Financial Services Authority (FSA) comparative tables) has provided potential customers with more ability and confidence to make their own informed decisions.
2.2.7 Over the last 20 years conventional annuity rates have generally been on a downward trend, driven by the two main influences of generally decreasing long-term interest rates (as reflected in gilt yields) and improving longevity, although rates have improved to some extent in recent years as long-term interest rates stabilised. The introduction of quantitative easing in March 2009 has had a negative impact on both annuity and gilt rates and recent economic turbulence has created instability in the market.
2.2.8 There is a concern that annuity rates are likely to continue on a downward trend due to increased longevity and the potential impact of further regulatory changes such as Solvency II, but there are still considerable uncertainties in these areas. For some of those already dependent on annuity income, the drop in inflation has provided some respite, after experiencing a sharp rise in prices during 2007 and 2008, although low/negative Retail Prices Index (RPI) increases potentially have adverse consequences for the small proportion of customers that choose to purchase RPI-linked annuities.
2.3 Product Types and Features
2.3.1 There are several types of conventional and other individual annuity products available on the market, with the main types outlined below. Due partly to the structure of UK taxation and regulations, the variety of product types and the features that are available within the UK that are aimed at providing income in retirement is greater than in most other countries. In April 2007 the Actuarial Profession produced an ‘Annuities’ briefing note (subsequently updated) that describes many features of annuities.
2.3.2 Conventional (pension) annuities (often called ‘compulsory purchase annuities’, or CPAs) and purchased life annuities (or PLAs) generally pay an income (usually monthly) on a pre-determined basis for the lifetime of the customer(s). Different tax treatments apply to PLAs than to CPAs, which is covered in paragraph 2.4.1.2 below.
2.3.2.1 Level annuity: This pays a fixed amount of income for the rest of an individual's life, thus declining in real value due to inflation.
2.3.2.2 Escalating (or increasing) annuity: This provides a regular income that increases either by a constant proportion each year (e.g. 3% per annum) or in line with inflation (as measured by the RPI). For a given purchase price, the starting income is lower with an escalating annuity than with a level annuity.
2.3.2.3 Some annuity products offer the option of a guarantee period, that means the annuity will pay out for a specific number of years (usually the first five or ten years) even if the annuitant dies within this period. On death, the annuity may either be paid for the rest of the guarantee period or it may be paid to the estate as a lump sum, and thus inheritance tax may be due on it.
2.3.2.4 Value-protected (also known as capital-protected) annuities are designed to pay out a lump sum, equal to the amount used to buy an annuity less any income received, to the individual's estate or beneficiaries on death (before age 75). There will be a tax charge on any lump sum, and depending on the amount of money within the estate after the payment is made, there could also be an inheritance tax charge. This relative tax inefficiency and the higher cost than for a conventional annuity appears to have held back the wider development and take-up of value-protected annuities, despite the perceived advantages for the customer.
2.3.2.5 Single life annuities will only pay out for the life of the annuitant, and will not pay out for a spouse, partner or dependant after the annuitant's death, unless there is a guarantee period.
2.3.2.6 Joint life annuities will continue to pay an income to a surviving spouse, civil partner or financial dependant, for the rest of their lives. This will typically be a proportion of the income the annuitant was getting before their death. This proportion is decided at the time of purchasing the annuity, and can be, for example, 50% or even 100%. If the financial dependants are children, the annuity will usually pay out until they reach a certain age, which can vary.
2.3.2.7 Under UK pension regulations, individuals are allowed to take up to 25% of their pension fund as a Pension Commencement Lump Sum (currently a tax-free cash sum) when they start to take their retirement benefits, and the rest of the fund must be used to purchase an annuity. However, this can be deferred until the age of 75 (the compulsory age limit for annuitisation). In addition, there are Trivial Commutation rules in place, which allow individuals with a modest pension fund to take the whole amount as a lump sum (with all but the first 25% being taxable as income), at the option of the individual. This applies to those individuals with a total pension fund value that is equivalent to 1% or less of the lifetime allowance (i.e. £17,500 in 2009/10).
2.3.3 Enhanced annuities: Similar in nature to conventional (pension) annuities, these will typically pay a higher amount of income than a conventional annuity to someone who exhibits lifestyle factors or health impairments which could reduce his/her lifespan. There can be several types, including:
2.3.3.1 Impaired life annuities that are underwritten at point of issue, for instance to take account of significant health problems such as cancer or chronic asthma. These are generally provided by specialist underwriters (such as Just Retirement and Partnership Assurance), and supported by specialist underwriting processes and expertise.
2.3.3.2 Lifestyle annuities, such as smoker annuities and postcode-rated annuities (Aviva, Legal & General and Prudential have all issued such policies), often with simplified underwriting approaches.
2.3.3.3 Immediate needs annuities are a special type of Purchased Life Annuity that can be purchased where an elderly relative is already in either residential care or a nursing care home, or is about to be admitted. The annuity is paid directly to the care provider for the life of the individual and H.M. Revenue & Customs (HMRC) has agreed for this to be paid gross (no tax is payable on the income). However, HMRC have stipulated other conditions, including that the amount payable as an annuity can only be equal to or less than the actual charge made by the care home, and there cannot be a surplus accruing to the individual's estate, should there be a reduction in the home care fees charged or in the unlikely event that the individual returns to their home to look after themselves. The usual method of purchase is a single lump sum payment in exchange for an income to cover all or part of the costs of long term care for the life of the individual. It is also possible to have different options depending on the circumstances and the individual's other assets, where the benefits payable from the immediate needs annuity can be deferred. Other features that can be added to the annuity are escalation rates and capital protection. Escalation attached to an annuity means the income paid to the care home rises by a fixed percentage each year and protects the income against inflation, and escalation rates can be chosen between 1% and 5%. Capital protection allows the original capital to be protected in the event of the early death of the individual. The percentage of capital to be protected, up to usually 75%, would be returned to the estate less all income paid to the care home. This option would increase the capital cost of the immediate needs annuity.
2.3.4 Investment-linked annuities: The pension fund is invested in assets that are used to determine the value of an individual customer's policy, and the income paid varies according to the performance of the underlying investments. Investment-linked annuities can either be with-profits or unit-linked.
2.3.4.1 With-profits annuities link the income to the performance of the insurance company's with-profits fund, often with some form of smoothing of investment performance. The income will usually be determined by reference to an ‘anticipated bonus rate’, so can increase or reduce in future years as actual bonus rates are declared above or below the anticipated rate.
2.3.4.2 Unit-linked annuities are linked to the value of the investment fund they are based on. There will often be a choice of different investment funds, to suit different risk profiles (for instance, London & Colonial's ‘New Open Annuity’).
2.3.4.3 Flexible annuities are designed to offer flexibility and the opportunity for some capital growth compared to conventional/guaranteed annuities, and may be fixed for a term (during the period up to age 75) or payable throughout life. (Examples include Living Time's Income Plan, Lincoln's i2Live and Canada Life's Annuity Growth Account.)
2.3.5 Variable annuities: A variable annuity is a unit-linked product which incorporates an underlying guarantee (often as a rider benefit). They can be designed to provide regular income payments which may rise if underlying investments perform well, but which contain an underlying minimum guarantee. These have been a popular product design particularly in various other markets (notably in the US, Japan and Korea) and are now emerging into the European market, including the UK, as a means of delivering security in retirement income while also providing some ongoing exposure to stock market investment returns. Variations have been issued that are available within a UK pension wrapper or with purchased life annuity tax treatment for income payments. (Example products in the UK include AEGON's Income for Life, MetLife's Retirement Portfolio and (until May 2009) Hartford Life's Platinum.) There are various types of guarantee benefits available, of which two are most similar to the benefits available from individual annuity products:
2.3.5.1 Guaranteed Minimum Withdrawal Benefit: A fixed benefit percentage is paid by partially encashing units in the policy, and if the unit value completely expires before the end of the guarantee period (which may be either for a limited term, or throughout life), the provider maintains the payout of the fixed benefit percentage. The benefit amount may increase if the underlying investments within the unit funds perform well, but will not reduce (unless ‘excess’ withdrawals are taken from the policy).
2.3.5.2 Guaranteed Minimum Income Benefit: A fixed benefit percentage is payable throughout life after the selected vesting age, but the unit proceeds are effectively surrendered at vesting (at which stage effectively the policy is converted to a conventional annuity). The benefit amount may increase if the underlying investments within the unit funds perform well prior to vesting, but will not reduce.
2.3.6 Finally, although not an annuity product, the UK pension regulations allow for individuals to take a taxable income direct from their pension fund in the form of income drawdown while the remainder of the fund continues to be invested. This is known as Unsecured Pension (USP) and allows the individual to draw a maximum income of 120% of the pension that could have been purchased calculated using GAD rates. There is no minimum amount of income that must be drawn, but the holder must either purchase an annuity or transfer the money to an Alternatively Secured Pension (ASP) by the age of 75. In addition, where death occurs prior to the individual's 75th birthday, the remaining fund can be paid to the beneficiaries minus a 35% tax charge. The rules for ASP are complex and outside the scope of this paper, but ASP can be used to take at least 55% and up to 90% of the yearly pension that GAD decides that a 75-year-old could get from an annuity bought on the open market. On death, the pension fund can only be used to provide income for dependants, or be paid as a lump sum to a registered charity, and there may also be a charge on the individual's estate for inheritance tax. The availability of USP and ASP, and how these interact both with conventional (including enhanced) annuity products and with ‘third way’ annuity products (loosely defined as being products that are not conventional annuities but which seek to provide individuals with income during retirement), is likely to change the dynamics of the annuity market in coming years, particularly if the requirement (other than in limited circumstances) to annuitise by the time the individual attains age 75 is modified or abolished.
2.4 Market Size
2.4.1 The overall market for individual annuities is split into two broad categories:
2.4.1.1 Pension annuities: Individuals with a defined contribution (also called ‘money purchase’) pension – which applies to all personal pensions, stakeholder pensions and some occupational schemes – are required by legislation to purchase an annuity by the age of 75. Pension annuities are designed to convert the accumulated pension fund into a regular and guaranteed stream of income during retirement.
2.4.1.2 Purchased life annuities: These are annuities bought by individuals, using their own capital or savings, on a voluntary basis. They provide an income stream, either for life or for a fixed term. The purchased life annuity market is substantially smaller than the pension annuity market, even though there are relative taxation advantages for purchased life annuities compared to pension annuities (as some of the annual ‘income’ is treated for tax purposes as a partial return of the individual's capital with only the excess subject to tax). This points to some additional evidence that, given a free choice between having a lump sum and a lifetime income, the majority of individuals will tend to select a lump sum. The implications for the individual annuity market are relatively clear, should the compulsory annuitisation of pension funds be abolished.
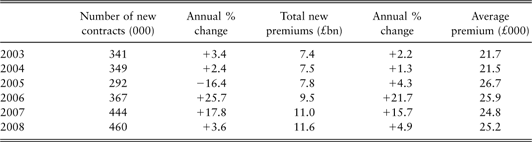
2.4.2 According to ABI data (see Table 2), new pension annuity premiums were £11.5bn in 2008, while new purchased life annuity premiums were just £51m. Table 2 shows how the pension annuity market has developed over the 6 years from 2003 to 2008 (and excludes ‘bulk’ annuity premiums).
New pension annuity business – number of new contracts and the amount of new premiums.

Source: ABI.
2.4.3 The reduction in contract numbers in 2005 is largely explained by the deferral by many individuals of taking their retirement benefits until the new ‘pensions simplification’ regime began to apply, from ‘A-Day’ on 6 April 2006, as the tax-free lump sum available at retirement increased for many individuals after that date.
2.4.4 Reliable aggregate data on the income drawdown market is not readily available as the data from the ABI only reflects income drawdown products within the insurance-administered sector of the market. Funds held in some Self-Invested Personal Pensions (SIPPs), wraps and platforms are not included within these data, and it is likely that there has been significant growth within these markets which will not be reflected within the ABI data. Reliable independent data for these markets is also difficult to obtain, but a recent survey by Money Management (September 2009) indicated that the total amount of funds held within SIPP accounts exceeded £50bn. The ABI data shows that the insurance-administered income drawdown market remains around 15–20% of the total pension annuity market recorded by the ABI, although interest in this segment is increasing as more consumers seek increased flexibility in their retirement income options.
2.4.5 As mentioned in paragraph 2.2.3 above, demographic and other pressures are likely to ensure that there will be continued growth in the pension annuity market over the next five years. The UK's ageing population will increase the number of retirees over the period, which will in turn lead to increased demand for pension annuity products. Some forecasts are for volumes and premiums in the pension annuity market to increase by 40–50% over the next 5 years.
2.4.6 A more in-depth analysis of product sales reveals that there has been a shift away from conventional annuities towards products that offer the opportunity for increased income and/or flexibility. ABI figures show that the proportion of pension annuity premiums applied to conventional annuities reduced from 91% in 2004 to 83% in 2008. Low annuity rates also appear to be encouraging more people to consider a wider variety of annuity options, which may provide them with a higher income during their retirement. Enhanced/impaired annuities and investment-linked (including with-profit) annuities have increased to account for a much larger proportion of the market in recent years (with enhanced annuities now accounting for around 12%, or around £1.4bn, of sales in 2008, up from 6% in 2004). However, with the more sophisticated underwriting techniques being used, the lines between the conventional and enhanced annuity markets are being increasingly blurred, so the classification of ‘conventional’ and ‘enhanced’ will be less easy to determine in the future.
2.4.7 Since their introduction into the UK pensions market in 2006, sales of ‘third way’ products such as variable annuities have grown to become a more prominent segment of the market. In 2008, sales of variable annuities more than doubled to exceed £1bn in premiums, and despite some turbulence in the sector during 2009, sales currently appear to be continuing at broadly similar levels.
2.4.8 The CPA market is quite concentrated in a few providers. Overall, the top five providers account for just over two-thirds of the total market (see Table 3).
Top five providers’ share of the UK individual annuity market, by new business (APE), 2008.

Source: FSA annual returns.
Data includes a small amount of regular premiums and are recorded on an annual premium equivalent (APE) basis, i.e. 100% of regular premiums plus 10% of new single premiums. Where possible, bulk annuity business has been excluded.
2.5 Regulatory and Legislative Developments
2.5.1 There have been various changes to the regulatory and legislative landscape over the last few years, and there are a number of recent developments which are also affecting the market for annuities. The main change was the introduction of the ‘pensions simplification’ rules from April 2006, which opened the way to providing many more options and increased flexibility to customers in determining how and when to take retirement income benefits. As described in section 2.3.6 above, one of the main impacts was to modify substantially the regulations applying to the use of income drawdown as an alternative to the purchase of an annuity to a wider range of customers, and potentially to avoid the need to purchase an annuity at all through the use of ASP. The rules are described in more detail in the briefing note on ‘Income Drawdown’ produced by the Actuarial Profession in May 2008 (subsequently updated).
2.5.2 Other recent developments include impacts arising from the FSA's Treating Customer Fairly initiative (such as the wider promotion and uptake of OMOs and the use of FSA comparative tables), and impacts likely to arise from the Retail Distribution Review (RDR), although the consideration of these changes is outside the scope of this paper. Furthermore, changes introduced to tax rules by HMRC also impact on the market, such as changes to trivial commutation rules for occupational pension schemes, and there are likely to be some significant long-term impacts arising from the restriction of higher-rate relief on pension contributions announced in April 2009.
2.5.3 In recent years, there has been considerable focus on the fact that only around a third of annuitants appear to shop around for the best available deal when they arrange their annuity product. There may be several reasons for this, including that the provider with whom the customer has accumulated their pension savings may give attractive annuity rates, potentially arising from guaranteed annuity options within the accumulation product. However, this may also be because a relatively high proportion of funds are for small amounts (around 40% of annuities are sold with a fund size of less than £10,000 according to ABI data) which would mean that any increase in income available from shopping around would be relatively small, as well as this being uneconomical for advisers to spend significant time on.
2.5.4 In July 2008, the FSA announced the results of its thematic work on the OMO, revealing that while there is evidence of good practice in the market, a substantial number of providers needed to make improvements to their customer communications and transfer processes. In October 2008 the industry, through the ABI, responded to the FSA review by launching the Options Campaign, which has sought to improve turnaround times and to standardise the process with regards to pension transfers. However, ABI data showing the proportion of internal and external sales shows that these developments are yet to have a material impact on the uptake of the OMO, although other recent ABI data suggest that transfer times have been reduced to around eight days, having previously stood at more than three weeks.
2.5.5 The development of the FSA comparative tables of annuity products and providers (in its website, www.moneymadeclear.fsa.gov.uk) has been an important instrument in trying to improve consumer engagement and understanding, particularly regarding the OMO. However, developments in pricing strategies in terms of enhanced and postcode-rated annuities created difficulties in providing standard comparisons online, leading to suspicion that the data were not up-to-date. In April 2009, the FSA announced that it was looking to make improvements to its comparative annuity tables, a move which could ultimately result in the introduction of real-time quotations. As this paper is being prepared (February 2010) the FSA website provides some limited information about enhanced and postcode-rated annuities, typically indicating where individual companies listed can be contacted directly for further details.
2.5.6 The implementation of RDR proposals will probably have a substantial impact on the annuity market in the coming years, although there are many views concerning the potential outcome of the changes to the distribution structure of the market. Some consider that the number of independent advisers could fall by half, while others suggest that the impact may be less dramatic. However, largely as a reaction to this and other changes, several annuity providers have already looked at alternative distribution and advice models, including introducing non-intermediated (direct) channel propositions. The high proportion of annuity sales based on small pension funds and the potential implications of the RDR is already increasing the proportion of non-intermediated sales in the coming years, as demonstrated in Table 4. Some non-specialist insurers (which have been used in the accumulation phase for their customers’ pension funds) are also making arrangements with specialist annuity providers to pass on smaller (or sometimes all) vesting pensions in return for a fee. Furthermore, many people are using the internet to do their own research and the information available on websites such as the FSA's Money Made Clear (FSA, 2010) and The Pensions Advisory Service's (2010) Online Annuity Planner has made it easier for people to do so in a reliable and straightforward way.
Proportional distribution of new pension annuity premiums, by sales channel.

Source: ABI.
2.5.7 From December 2009, new rules governing occupational pensions came into effect that enabled trustees of occupational schemes to determine that members who have a small fund (of less than £2,000) can be compulsorily cashed in under triviality rules. This change currently includes only occupational pensions and not personal or stakeholder pensions. It will permit occupational schemes to avoid having to pay small pension amounts that would otherwise be uneconomical to administer. The £2,000 limit does not include benefits held in other pension schemes and is therefore a significant amendment of previous trivial commutation rules and could potentially be of wider use and applicability following the introduction of the National Employment Savings Trust from 2013.
2.6 International Comparisons
2.6.1 The UK market is the most substantial market for annuities in the world, accounting for around 40% of all global annuity business (measured by the size of annuity liabilities or assets backing these liabilities), according to estimates made by Swiss Re (2007). This has largely been driven by the historic tax and regulatory environment in which pensions savings have been made, as described above.
2.6.2 The development of national annuity markets is subject to a range of external factors, the most important of which, according to an OECD report in 2008, appear to be:
2.6.2.1 the design and scale of the country's social security system;
2.6.2.2 the country's occupational retirement system and any mandatory saving framework; and
2.6.2.3 the impact of local tax incentives (both to individuals and to contributing employers).
2.6.3 Other important markets include:
2.6.3.1 United States of America: Although this is a substantial market for annuities, it is significantly smaller than the UK relative to the size of the economy. This market has provided consistent and often-cited evidence that, given the choice, people do not choose to annuitise when given the opportunity (but no incentive or compulsion to do so) at the end of their working lives.
2.6.3.2 South Africa: Also a large immediate annuity market, largely due to the tax-favoured mandatory annuitisation vehicles to which much of retirement saving has been directed. As in the UK, this market has a significant variety of product design and choice and, like the United States, uses the slightly confusing nomenclature of ‘retirement annuities’ to refer to the tax-favoured individual products in the accumulation phase.
2.6.3.3 Chile: Reform in the pension annuity market since the early 1980s has produced a significant build-up of assets in the accumulation phase and Chile is considered now to have one of the most sophisticated markets for both immediate and deferred annuity markets in the world (see Rocha & Thorburn, Reference Rocha and Thorburn2007). The Chilean experience appears to show the feasibility of developing a market for retirement products from a low initial base, into a well-developed and rapidly growing market for ‘programmed withdrawals’ (PWs) and annuities, judged by the number of PW and annuity policies, the size of the PW and annuity premiums, the assets of life insurance companies, and the number of market participants.
2.6.3.4 Several countries (such as Belgium, Denmark and Germany) also have a history of annuity provision, but in a rather different type of vehicle, the guaranteed deferred annuity. This typically offer minimum guaranteed investment returns that cover both the accumulation and payout phases, including mortality risks over a very long period. These returns are then often supplemented by bonuses that arise from performance that is in excess of the relatively low guaranteed levels, both during the accumulation and payout phases, after allowing for mortality gains or shortfalls to the provider. Similar structures are also found in The Netherlands, but it also has a significant immediate annuity market, largely due to the low level of social security benefits in retirement.
2.6.3.5 Many other countries have no, or underdeveloped, annuity markets particularly where there is no mandatory annuitisation requirement on accumulated pension funds. In these markets there are several potential drivers for this, which the OECD and others have identified, including: the desire to leave bequests to the individual's dependants; the availability of public pension systems, occupational pension schemes or other tax-favoured competing assets; poor consumer understanding of the product and risks covered; and perceived poor value-for-money. The Association of British Insurers (2005) also undertook some research in the area of consumer understanding in the pension annuity market and produced a ‘consumer perception’ report which helped to inform the H.M. Treasury (Reference Treasury2006) report on the annuities market.
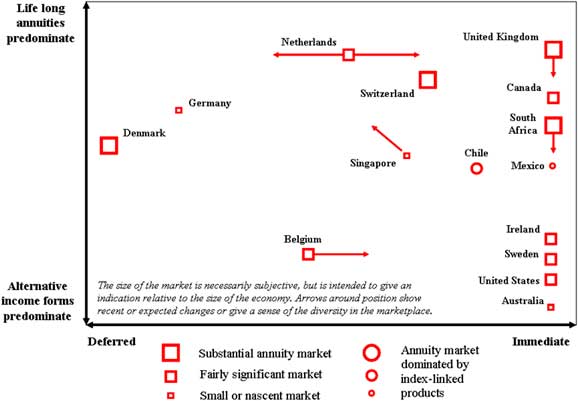
2.6.4 A pictorial representation of the structure of selected international annuity markets is also presented in the OECD report, which indicates how the relative size of the various markets compare and in what predominant form annuities are provided (see Figure 1).
Schematic representation of selected annuity markets. Source: Rusconi (Reference Rusconi2008).

2.7 Alternatives to Annuities
2.7.1 For a growing number of people, a phased approach to retirement is the preferred option, which presents new challenges and opportunities for those operating in the retirement income market. Some industry commentators have suggested that the rule forcing people to annuitise their pension funds by the age of 75 is out of step with changing attitudes and behaviour towards retirement and is currently restricting innovation and limiting the development of new products. As mentioned in section 2.1.3 above, there is a possibility that future legal and fiscal changes may be introduced to address this issue, although there is not a widespread consensus across the political spectrum.
2.7.2 Key alternative sources of potential income in retirement include income from the State Pensions, income drawdown from accumulated pension savings, equity release, other accumulated savings (such as Individual Savings Accounts, mutual funds, investment bonds and National Savings), inheritances and continuing employment.
2.7.3 The market for variable annuities has grown considerably in recent years. According to research conducted by Watson Wyatt, sales of variable annuities exceeded £1bn in 2008, which was more than double that recorded in 2007. However, since the start of 2009, the sector has experienced a turbulent period. In May 2009, one of the UK's four variable annuity providers, Hartford Life, withdrew from the market following challenging group results in early 2009.
2.7.4 Generally speaking, the global economic downturn has had a negative impact on the margins available on variable annuities, as the cost of providing product guarantees has increased significantly with increasing equity volatilities and reducing interest rates. In June 2009, AEGON replaced its ‘5 for Life’ variable annuity with the Secure Lifetime Income Plan, as it became harder to offer a minimum guaranteed lifetime income level of 5%, while MetLife has restricted the choice of funds on which the guarantees are being made available.
2.8 Summary
2.8.1 In this section we have examined the overall environment for the UK individual annuity market and described many of the product types and features that have become prevalent in this significant market segment, notably over the last 10 years or so.
2.8.2 The UK demographic trend has been towards people living longer into retirement. There has also been an increased propensity for the working population in the UK to accumulate their pension savings in money purchase arrangements rather than in defined benefit arrangements. Both of these influences have meant that the market in the UK for conventional annuities and other retirement income products has grown substantially, and it is expected to keep on growing substantially for the foreseeable future.
2.8.3 At the same time, the variety and complexity of retirement income products available to individuals has also increased substantially, so that conventional annuities are not likely to be the only product solution being considered by prospective pensioners. In particular, there has been substantial growth in the enhanced and impaired annuity market, which has implications for the pricing and management of conventional annuities as well.
2.8.4 Another important driver of customer behaviour and product design has been the tax and regulatory environment applicable to individuals. The industry has endeavoured to deliver appropriate products that are, and will continue to be, relevant to customers’ changing needs and their desire to seek value-for-money products that satisfy their various needs (particularly income, but also protection for dependants) during their retirement years. As future taxation and regulatory changes emerge, actuaries will be called upon to assist companies to understand the changing dynamics of the market; design, price and deliver appropriate products that meet customer needs; and ensure that companies are well-managed to deliver the customer promises and manage the risks taken on by the annuity provider.
3. Longevity Risk
3.1 The Uniqueness of Longevity ‘Risk’
3.1.1 In nearly all forms of insurance the interests of the insurer and the insured are aligned: neither party wishes the insured event to occur (death, disability, loss of earnings etc).
3.1.2 Longevity is the major insurance risk which definitively does not have this feature: effectively the insured ‘event’ is survival beyond the expected age (or beyond the age at which all assets are consumed). The annuitant is highly motivated that the insured event should occur, and may well take action to improve his/her own longevity, before or after the annuity contract has been bought.
3.1.3 This is a fundamental characteristic of longevity risk, and is one reason explaining the value of compulsory annuitisation in rendering the risk more insurable.
3.2 Longevity Basis and Assumption Setting
3.2.1 The pricing or reserving of liabilities associated with longevity requires the assumption of how long on average the population involved can expect to live. It is a common practice to answer the question on longevity or mortality rates of the population in two parts. The first part involves estimating the current mortality rates of the population, usually called base mortality, which will be discussed in this section. The second part seeks to estimate how the current mortality rates will change in the future, commonly referred to as mortality improvement since that has been the overwhelming recent experience in the UK, and is discussed in section 3.6.
3.2.2 Different groups of people can have different base mortality rates. Some well-known examples of factors that relate to mortality are age, gender and socio-economic positions. A more comprehensive list of factors that potentially have some impact upon mortality has been summarised by the Board for Actuarial Standards (2008).
3.2.3 Competitive Pressure Leads to New Challenges
3.2.3.1 Historically, the dominant annuity product in the market has been the conventional annuity. The product has limited rating factors for longevity, and these include age, gender and premium size.
3.2.3.2 The recent past has seen the expansion of annuity products with more sophisticated underwriting procedure such as postcode-rated, impaired life and enhanced annuities. This development presents opportunities and challenges for the derivation of base mortality for people with different characteristics.
3.2.3.3 Taking the derivation of best estimate for a postcode-rated annuity as an example, annuity providers face the challenge of deriving the best estimate base mortality for different sub-groups of people based on postcode. The first challenge is to assign a description to a postcode. Commercially available products, Office for National Statistics (ONS) census data and other systems provide a way to describe a postcode. For example, one commercially available product describes the population living in a postcode area by labels such as ‘Grey Days’ or ‘Silver Foxes’.
3.2.3.4 However, being able to group people into ‘Grey Days’ or ‘Silver Foxes’ does not tell us if these characteristics are relevant to mortality. The next challenge is to ascertain the correlation of the characteristics in the postcode with mortality. Then it is possible to assign a best estimate base mortality for people of different characteristics which are correlated with mortality.
3.2.3.5 Traditional actuarial techniques that analyse actual mortality relative to expectation from a life table would not be adequate to establish the base mortality of people of different characteristics such as postcode groups, pension bands and gender. This is because once people are split into these groups, the volume of data in each of the groups may not be credible for analysis using traditional methods. Hence, models that can analyse many variables at the same time in a statistically robust manner are required. These models, usually called the multivariate models, include generalised linear and survival models which have been presented to the Actuarial Profession by Richards & Jones (Reference Richards and Jones2004) and Richards (Reference Richards2008).
3.2.3.6 In addition, more sophisticated geo-demographical, epidemiological, statistical and other relevant techniques are required to derive the best estimate base mortality when extensive sub-grouping is required.
3.2.4 Risks and Uncertainty
3.2.4.1 The Board for Actuarial Standards (2008) has set out a range of potential sources of errors when deriving the base mortality rates. These include risks and uncertainty surrounding model, judgement, randomness and data integrity. Taking the process of establishing the base mortality of people living in different postcode groups as an example, here are some plausible ways in which risks can arise.
Model risk
(1) Model risk may occur when the method chosen for estimating the base mortality of people living in a postcode group may not be adequate.
(2) In the absence of reliable or credible data, it may be necessary for a model to assume that people living in a postcode group such as ‘Silver Foxes’ would have the same mortality rates as those of people in Social Class I (professionals). This association may not be appropriate because the actual base mortality of ‘Silver Foxes’ may be closer to that of a combination of people in Social Class I, II and III; or a selection of healthier groups of Social Class I, II and III. The risk is that the mortality rates of ‘Silver Foxes’ would not turn out to be as predicted.
Judgement risk
(1) Judgement risk may occur when necessary adjustments are made to the results of the models. Providers with reliable and credible data have the advantage of being able to derive the base mortality of people living in different postcode groups from their own experience. However, changes in the market such as the expansion of enhanced or impaired life annuities may mean that past experience is no longer predictive without adjustment.
(2) The enhanced or impaired life annuity market can attract customers who exhibit worse health profiles and higher expected mortality rates through offering cheaper premiums. As a result, people who buy conventional annuities can be expected to be healthier with lower mortality rates on average compared with the population that had previously purchased conventional annuities prior to the expansion of the enhanced and impaired life annuity market. Adjustments need to be made to reflect these changes when pricing new business. These adjustments may require judgement, presenting a risk to estimating base mortality.
Random variation
(1) Random variation is also a source of risk to be considered, especially when the population from which the base mortality assumption is derived is small, or when pension amounts are concentrated in a relatively small proportion of people.
(2) Using stochastic simulations, Lu & Kanter (Reference Lu and Kanter2010) examine the effect of size of population and concentration of pension amount on populations with a similar age structure to the UK population. For 3-year mortality experience, assuming everyone has the same pension amount (i.e. no concentration of risk), the 95% confidence interval increases from ±3% to ±8% of the mean if the number of members reduces from 25,000 to 5,000 people. For a population of 25,000 members, the 95% confidence intervals increases from ±3% to ±8% of the mean if concentration of risk increases from everyone having the same pension amount to a distribution where 10% of the people own about 50% of the pension amount (which is a typical concentration for pension funds).
(3) These analyses show that the uncertainty surrounding the experience of a typical pension fund or annuity book may be higher than has sometimes been appreciated. So it is important to understand factors that affect uncertainty of the experience which is used to set the base mortality assumption.
Data risk
(1) Data risk will add to the uncertainty around the estimation of base mortality. One source of error is the completeness of death data. Some deaths may be reported late or may never be reported. The risk can be minimised by managing and cleaning the data well. There are service providers in the market that can help identify deceased individuals using relevant data of individuals such as date of birth, gender and address. Accurate identification of deceased annuitants will reduce overpayment of annuities, hence saving costs. An assumed incidence of late-reported death can also be derived by good analysis of past trends.
3.2.4.2 Increasing demand for longevity-related products and competition will most likely give rise to more variety of insurance products. A wide range of data, evidence, techniques and technology can be mustered to derive the assumption for base mortality. However, the risks and uncertainty of base mortality must be understood.
3.3 Non-Standard Rating: Enhanced and Impaired Life Annuities
3.3.1 The non-standard market, while growing, has clearly not yet reached its maximum possible size, possibly due to inefficiencies and inertia in the distribution chain. Both ‘A Day’ in 2006 and the various changes around the OMO outlined in section 2.5 have meant that more people are investigating their options when approaching retirement. It is likely that these people have larger lump sums and are also generally better informed about financial matters and hence may have a different socio-economic profile on average than the entire population of new pension annuitants. This should be considered when setting a basis for either ‘standard’ conventional annuities or ‘non-standard’ (enhanced or impaired life) annuities.
3.3.2 The various approaches to underwriting annuities can effectively be considered as points along a spectrum, as successively more information is required to provide a quotation:
3.3.2.1 Standard: No ‘underwriting’ per se, traditionally only age, gender and premium size are used to provide a price.
3.3.2.2 Postcode: Based on a variety of statistical approaches which analyse and group mortality by home address as described above. It is increasingly well understood that mortality varies by region throughout the UK after controlling for age and gender. This information can be transformed and applied to adjust annuity rates offered on new business.
3.3.2.3 Lifestyle: The simplest example is the Smoker annuity, where the annuitant is provided with improved terms if he/she smokes. It is clear that if this were universal as a rating factor then by definition ‘Standard’ conventional annuities would in fact be ‘Non Smoker’ annuities rather than a mix of smokers and non-smokers. This is perhaps the simplest way to explain the impact of the changing approach to pricing and providing annuities. Lifestyle may also be used as a term to cover the ‘simpler’ health factors such as weight.
3.3.2.4 Enhanced: Effectively moving further along the spectrum and extending the medical underwriting by adding simple health factors such as blood pressure, cholesterol, Body Mass Index and/or waist-to-hip ratio. The resulting additional mortality is often incorporated via a rules-based or points-based rating system with limited manual intervention.
3.3.2.5 Impaired life: At the end of the spectrum, this approach tends towards ‘full’ medical underwriting, with extensive questionnaires including disease or condition-specific extensions. At this level the cases may be individually underwritten using expert system support, and the extra mortality is generally tailored to the disease, condition or combination thereof concerned such as cancer, heart attack, stroke, diabetes and other medical conditions.
3.3.3 Given the development of non-standard annuities, it is vital that providers of annuities consider the impact on this part of their portfolio, whether they provide underwritten annuities or not.
3.3.3.1 Pure specialist providers need to focus on getting their mortality estimates ‘right’ for the conditions/approach they are modelling.
3.3.3.2 In addition, those who provide both ‘standard’ and ‘non-standard’ annuities need to form a view on the mortality of the group that is coming into their ‘standard’ book. Are these lives who have passed through an underwriting system and failed to qualify for any form of enhancement? So are these lives in a sense ‘super healthy’?
3.3.3.3 Lastly those providers who continue to offer only the traditional conventional annuity must consider the impact on the mortality of their remaining maturing book of those who, having accumulated a pension fund with the provider, then leave via the OMO. In addition, if the provider accepts OMOs from external sources, are these also lives that have failed to qualify for an enhancement? The first port of call for building this view is the source of the annuity – by which route did this annuitant come to be in the portfolio?
3.3.4 Traditional monitoring methods should continue to be applied: experience analysis of one's own book is essential. Additional dimensions to be considered include underwriting year and source of business (e.g. through an OMO or not). Of course increasing the dimensions of the analysis has an increasingly detrimental effect on credibility: hence larger sources of data such as the CMI should also be analysed. This data is however impacted by relatively long delays in production as well as a highly structured uniform data format, compared to a provider's own data.
3.3.5 It will be a significant challenge to tease out the various contributors to the experience observed: for example ‘underlying’ mortality improvement, ongoing changes in smoking prevalence, and changes due to selection differences in the annuitant population.
3.3.6 The following are some of the possible methods for minimising the anti-selection risk emerging from the growth of the non-standard annuity market.
3.3.6.1 For providers who do not yet ‘underwrite’ their annuitants:
(1) Active monitoring of the proportion of their vesting pension customers leaving via the OMO. Consideration may be given to why this may be, by comparing own competitive position to that of other players and discussion with distributors.
(2) Consideration may be given to the probably increasing proportion of lives in relatively good health entering the portfolio via internally retained vesting.
(3) Consider how to better understand the health status of the lives coming into the portfolio via external OMOs. Were these lives ‘won’ due to a particularly competitive offering coming from interest rates or commission, or are they in fact receiving best terms due to the assumption that they are in ‘average’ health when in fact they are ‘super-healthy’, having been rejected by others’ underwriting processes as insufficiently impaired?
3.3.6.2 For providers who do underwrite, along any part of the spectrum described in section 3.3.2 above:
(1) Essentially the provider needs to have confidence on a case-by-case basis specifically because of the increased level of (anti-)selection. The concept of mix management (realising profits on some lives that compensate for lower profits on others, such that overall the product is acceptably profitable) holds much less strongly here.
(2) Currently there is not a universally shared approach to modelling, which means that prices may differ more widely between providers than occurs for standard annuities. In the worst case, at any pricing point (i.e. combination of values of the underwriting factors) where the provider is ‘wrong’ in the estimated mortality, more business (market share) will be written, and hence overall profit margin will be lowered.
(3) Hence providers must establish a prior view of the expected mix of risk factors, and continuously compare this to actual business written. If more is written in a particular risk segment (such as from a particular postcode type, or with type I diabetes, or with breast cancer) then particular attention must be paid to that part of the model to ensure the necessary level of confidence in the provider's own basis (i.e. to form a view on whether it is the provider or the competition which is ‘wrong’).
3.3.7 To take some extreme examples of the new risks facing annuity writers in this market, consider a healthy, wealthy actuary who buys a flat in a socially deprived area associated with low life expectancy, and takes up smoking, just before retirement. We use this extreme to highlight some of the concerns that can arise from a postcode based model: similar concerns would exist also for motor insurance, for example, but in annuity business the stakes are considerably higher. This may ultimately lead to a requirement for all annuities to be medically underwritten. On the other hand, the wealth factor in the pricing basis incorporating a case-size adjustment may wipe out most of the gain that the arbitrage-chasing actuary hoped to realise. As Generalised Linear Modelling approaches are increasingly applied to this domain, the relative importance of different rating factors will become better understood.
3.3.8 When it comes to constructing a mortality basis for non-standard annuities, the sources of information are much more extensive than for standard lives, but they also tend to be less credible in comparison. They also, as has been noted elsewhere, tend to apply to the general population, possibly from countries other than the UK, rather than to the specific insured lives populations covered by these products.
3.3.8.1 Postcode: Most providers have taken information from one of several proprietary providers of geo-demographic information, and either performed their own analysis against ONS or own portfolio experience by postcode or some other form of geographical locator, or used such an analysis as provided by a number of actuarial consulting firms.
3.3.8.2 Lifestyle: A variety of public health data resources exist both in the UK and in other comparable countries.
3.3.8.3 Enhanced/impaired life: An enormous variety of medical studies exist, the major challenge for annuity providers is to focus on those with the greatest credibility, that extend over a large population and a reasonable period of time. Longitudinal studies appear to be particularly useful, although data from the early years of the study may need to be treated with care in order to ensure its application for the future is still appropriate, as treatments may have evolved considerably in the intervening period. In general most studies produce survival rates for a given condition from inception, but may not always differentiate by age or gender for example. Major studies that are referenced by all providers include the SEER study for cancer, the Framingham Study and MONICA Project for cardio-vascular conditions.
3.3.9 In addition to the historical statistics, the following need to be incorporated in order to build a complete mortality basis:
(1) Views on future evolution of treatments and their impact on mortality: does a certain condition require specific mortality improvement assumptions?
(2) Extensive and continuous involvement of underwriters, medical advisers, and specialists in certain conditions and medical researchers. Their validation of the interpretation of the data as proposed by actuaries is an essential step in the cycle of managing a basis.
3.3.10 The challenge for actuaries is to sift through the various and frequently conflicting sources of information, to synthesise them into a complete basis using a variety of methods, and most importantly to be able to incorporate and exemplify the input provided by the medical experts. Building an impaired lives mortality basis is not a pure mathematical modelling exercise.
3.3.11 Most rating models are focused on developing views on extra mortality coming from one or a combination of conditions. There are a variety of building blocks to modelling extra mortality:
(1) flat per mille extra mortality;
(2) fixed percentage increase; and
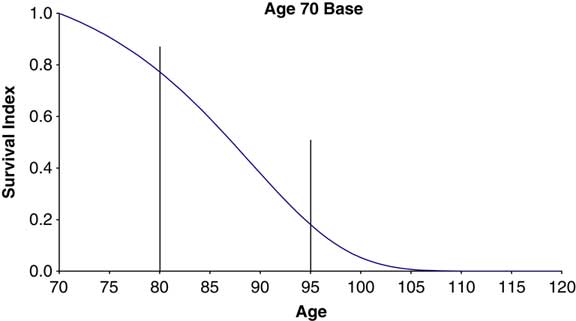
(3) a model that fits a survival curve given certain points (e.g. the points at which 50% and 90% of the population can be expected to have died).
3.3.12 It is important to consider the variation of these factors over time since diagnosis of the impairment, as well as by age, gender and severity of condition. In fact a best possible estimate of the shape of the (extra) mortality is key to obtaining an appropriate price and appropriate run-off expectation for the annuitant. Simply using a single factor and adjusting a given standard mortality curve upwards is unlikely to be sufficiently representative of the expected outcome. Some conditions are acute, with severe extra mortality in the early years but then much improved outcomes for those who survive (for example certain cancers), whereas others are chronic and degenerative implying worsening extra mortality over time.
3.3.13 The experience of the principally US-based Life Settlements market is relevant. It too depends on the estimation of life expectancies for generally older and usually health-impaired individuals. Recently this market suffered from universal upward revision of life expectancies and two of the contributing factors, which are relevant for the UK enhanced and impaired life annuity market, are:
(1) previous use of a simplified fitting of extra mortality, that usually consisted in fitting a fixed percentage extra mortality to a standard term assurance table, such that the survival curve generated produced a life expectancy as predicted by medical underwriters; and
(2) more subtly, the fact that medical underwriting is provided by separate third party organisations on a fee-for-service basis. The more ‘competitive’ the underwriting, the more business would be generated, hence an implicit preference was given to the organisations who provided the lowest life expectancies.
3.4 Immediate Needs Annuities
3.4.1 As opposed to CPA annuities, immediate needs annuities, as described in paragraph 2.3.3.3, are not a retirement age product, but rather a much older age product where entry age tends to be around 85–90. Hence life expectancies tend to be well below 10 years.
3.4.2 Although lives are medically underwritten there remains a significant anti-selection issue because of non-compulsion: the choice to purchase lies entirely with the insured and his/her family. They may decide to apply for an immediate needs annuity but will compare it to their estimate of the cost of other options such as self-funding, equity release or selling the family home. Their comparison will be based on an own view of the insured's health, which may not be an expert view, but will usually be based on knowledge of the insured's health which is more extensive than the insurer can obtain.
3.4.3 It is important also for the provider to be aware also of the risk of mistaking ‘standard’ for ‘healthy’: in this age range, most people have (or have had) health issues, so average mortality is already somehow impaired. It is noticeable that the spread of mortality between the groupings of good, average and impaired health status is not as wide as at retirement ages. In other words there is increasing convergence in mortality rates between groups as age advances.
3.4.4 Because of low life expectancy, sensitivity to the mortality assumptions is much greater, and hence the proportional cost of each one year deviation in life expectancy is much greater. Simply put, a one year deviation on a ten year life expectancy will cost less than 10% to the expected result, whereas the same absolute deviation on a two year life expectancy (a possible outcome for a heavily impaired 90-year-old) is closer to a 50% increase in annuity outgo and likely to far exceed expected profit margins. Relatively small advances in health treatments for the very elderly could therefore have a disproportionate impact on the experience of such business.
3.4.5 Although immediate needs portfolios tend to be much smaller than those for standard or impaired life annuities, at least the mortality experience becomes credible over a much shorter period of calendar years as the average mortality rate is usually relatively high, due both to the high ages and levels of impairment in the population.
3.5 Underwriting
3.5.1 The first impaired life annuity was launched in 1995; this was followed in 1996 by a smokers’ annuity. The market then changed significantly in 2000 when a simplified underwriting approach using a fully automated process was introduced.
3.5.2 Currently around 35% of CPA policies written through IFAs are for enhanced or impaired life annuities. This is fairly close to the generally accepted theoretical level of 40% of lives that should qualify. However, not everyone takes up an OMO, and so there remains scope for market growth.
3.5.3 All providers underwrite both lives for an enhanced or impaired life annuity issued on a joint life basis (i.e. the primary annuitant and the contingent annuitant). Most providers will not quote for an impaired life annuity if the primary annuitant is healthy whilst the spouse has an illness (as an ‘any spouse’ definition commonly applies).
3.5.4 The reinsurers have a significant role in this market, and typically provide underwriting tools to support the direct writers. The reinsurers are careful to keep up to date with medical developments and often have significant research resources. However, the reinsurers are reluctant to share their detailed data and models, even with their insurer partners.
3.5.5 There is only a limited amount of readily available information to support underwriting decisions.
(1) Books and websites summarising investigations into different illnesses and their impact on mortality are available, although most of these relate to the general population (rather than the population of annuitants), and many of them are from overseas.
(2) The General Practice Research Database (GPRD) provides another source of data in the form of patient histories right through from diagnosis, to treatment, and ultimately to death.
3.5.6 Quality of research and data varies greatly between different illnesses. For example cancer data are very good for the UK, with sufficient detail to determine not only long-term mortality rates but also the shape of the mortality curve for various types of the disease. In contrast, the data is poorer for heart disease, where long-term data are not always collected and research funding is lower.
3.5.7 The purpose of medical underwriting for annuities is different from that for protection. Rather than detecting a minority of sub-standard risks to be rated or declined, the underwriting process assesses whether to offer a lower price than standard, based on a declaration of health impairments and risk factors; there is generally no attempt to detect ‘super-standard’ lives. The underwriting process in the annuities market is considered by many to be around 10–15 years behind that in the protection market, in terms of its sophistication, which suggests that significant further changes in underwriting may lie ahead.
3.5.7.1 An industry standard questionnaire is used by the major providers of impaired life annuities to collect medical data from potential annuitants. This is the starting point for each quotation. However, there is variation between the providers in how this information is used:
(1) Some providers have fully automated the underwriting process (e.g. the market leader in the impaired life annuity market);
(2) Some providers use human judgement on every case;
(3) Intermediate practice exists, e.g. some providers will only use human judgement on the larger cases, or those with complex medical conditions.
3.5.7.2 When selling protection products, IFAs are used to using detailed on-line underwriting tools. These are not yet available in the annuities market.
3.5.7.3 Also, IFAs need educating in filling in the information required by the insurers. Insurers tend to find that data provided directly by individuals is of better quality than that provided through IFAs. This may be partially due to the relatively low levels of commission on annuity products, which mean that some IFAs may be less motivated to spend a long time on these forms.
3.5.8 At the current time, most insurers have insufficient death data relating to enhanced or impaired life annuities to carry out meaningful analysis on the efficacy of their underwriting process. Insurers monitor the incidence of over-disclosure of medical conditions by comparing the application form to the medical record held by the individual's GP. The level of over-disclosure is typically found to be very low.
3.5.9 Expected Future Developments in Underwriting
3.5.9.1 There is generally believed to be scope for future growth in the non-standard market. In the long term it is likely that a larger proportion of individuals will be asked to fill in a medical questionnaire when they convert their accumulated pension fund into an annuity.
3.5.9.2 For cultural reasons, many people understate their illnesses and ‘bad habits’ when filling in insurance medical questionnaires. It is expected that there will gradually be a realisation that it is in the annuitant's best interests to disclose fully any health impairments. Underwriting and pricing will need to adjust in order to take account of this.
3.5.9.3 There is a need for improved qualitative data to be collected for the underwriting process. For instance, this would involve not just collecting the date of a heart attack, and the number of pills that the individual is currently taking, but also asking for the individual to describe whether they suffer from other symptoms or complicating factors (e.g. breathlessness when climbing stairs) as such additional data would be helpful in flagging certain risks.
3.6 Mortality Improvement
3.6.1 An assumption for future changes in mortality is required for the valuation and pricing of longevity risks. This assumption has gained more prominence over the last decade in an economic environment with low interest rates. When interest rates are low, the liabilities of pension funds and annuity books are more sensitive to the assumption of how long people can expect to live. Furthermore, mortality rates of people above age 50 have fallen relatively rapidly over the last few decades. It is therefore not surprising that much effort has been made over the last two decades to develop and understand methods for the projection of future mortality.
3.6.2 Developments by the CMI Bureau
3.6.2.1 The CMIB has been influential in developing and debating the methods for the projection of mortality improvement in the industry over the last decade (see CMI working paper 38 for a review). Some notable developments are summarised in Table 5.
Developments in mortality projection by the CMIB.

3.6.2.2 The CMI Interim Cohort Tables with adjustments are commonly used by pension funds and life insurers. Examples of adjustments to the Tables include having a minimum rate of mortality improvement, using a percentage of the rate of mortality improvement of males for females, and reducing the minimum rate of mortality improvement at higher ages. The Interim Cohort Tables are useful in that they are well-known and allow the market to compare the strength of reserving among insurance/reinsurance companies or pension funds.
3.6.2.3 However by 2008, the CMI was concerned about the wide and continuing use of the increasingly out-of-date Interim Cohort Tables. A committee was set up to review and update them with the latest data. This led to the development of a model that projects annual rates of mortality improvement. The model requires some initial rates of mortality improvement as inputs, preferably the most recently available figures. It blends these initial rates to some assumed long-term rates. It allows the projection of period patterns as well as cohort patterns of annual rates of mortality improvement. The model gives one scenario for every set of inputs, hence it is a deterministic model and not a stochastic model. The sensitivity to changing various parameters is shown in Working Paper 39.
3.6.2.4 The model is available in Microsoft Excel format. Users can input the most recent mortality experience of a population for the projection. They can also determine the parameters of the model for future scenarios. The software will generate tables of the ratios of future mortality rates to initial mortality rates, and annual rates of mortality improvement of each age for each future calendar year. So this approach allows the users to generate many future scenarios, in contrast to the Interim Cohort Tables that have only 3 scenarios. It remains to be seen if the Interim Cohort Tables will be replaced as a standard for pricing, analysis and reporting, although the flexibility inherent in the new model may mean it will take some time to make meaningful comparisons between companies.
3.6.3 Developments in the Wider Research Community
3.6.3.1 Booth & Tickle (Reference Booth and Tickle2008) have reviewed the methods of mortality modelling and forecasting. They divide the various published methods into three broad categories:
(1) The expectation approach: Involves expert opinion, specification of a forecast scenario and usually come with alternative high or low scenarios. The projections of future mortality by the ONS (2008) are examples of expectation approach. These mortality projections are used to estimate the population size in the future in the United Kingdom and its constituent countries. The latest projections, called the 2008-based projections, have 3 scenarios with different assumptions about future rates of improvement in mortality. These projections are called the Principal, Low Life Expectancy Variant and High Life Expectancy Variant. The CMI Interim Cohort Tables and the new CMI model described in Working Papers 38, 39 and 41 are examples of the expectation approach. The approach has the advantage of drawing on expert opinion using a wide range of knowledge in the fields of demography, public health, medicine and other relevant disciplines. However, it also has the disadvantage that expert opinion may be biased, subjective or wrong.
(2) The extrapolative approach: Assumes that historical trends will continue into the future. Examples of this approach include the P-Spline, Lee-Carter, modified Lee-Carter and Cairns-Blake-Dowd models (Renshaw & Haberman, Reference Renshaw and Haberman2006; Cairns et al., Reference Cairns, Blake and Dowd2006). The approach has the advantage that most historical trends do continue in the short and medium terms (say 5–15 years) and that many of the examples are stochastic models. However, it is unclear that historical trends will continue in the longer term. Furthermore, different stochastic models may give different results for the measure of uncertainty about the future leading to inconclusive views.
(3) The explanatory approach: Seeks to predict mortality based on relationships between mortality and disease processes or risk factors. Examples of the approach include a smoking model and a disease-based mortality model presented to the Staple Inn Actuarial Society (Humble & Wilson, Reference Humble and Wilson2008; Love & Ryan, Reference Love and Ryan2007). Epidemiologists have used various explanatory models to assess the impact of future changes in patterns of risk factors or treatments on mortality (Aslan et al., Reference Aslan, Critchley and Capewell2005; McPherson et al., Reference McPherson, Marsh and Brown2007). This approach has the advantage of using medical, epidemiological and other relevant data to inform future outcomes. It could be used to help experts form their opinion in the expectation approach. However, the causal relationships between risk factors, morbidity and mortality are usually not well understood, hampering the use of the explanatory models.
3.6.3.2 Each of these approaches may be useful for different purposes. Actuaries will need to harness the strengths and understand the limitations of the various approaches, while choosing the most appropriate approach for their work.
3.6.3.3 Life offices typically use more sophisticated projection methods to derive their reserving bases. These projections are then converted into adjusted Interim Cohort Tables which have the advantage of familiarity to the market.
3.6.4 Immediate Challenges Ahead
3.6.4.1 Given that the Interim Cohort Tables are increasingly out-of-date, many decision makers will have to re-examine their assumptions for improvement in mortality. The immediate challenge is to decide whether the Interim Cohort Tables or their variants are still appropriate. If not, there will be a need to find a more appropriate replacement.
3.6.4.2 Various methods are available for mortality projection, which have different advantages and disadvantages. The methods have to be understood to decide if they are suitable for different purposes, such as setting the best estimate or deciding on the level of prudence required. For a discussion of the risk and uncertainty of setting the assumption for future change in mortality rates, see Board for Actuarial Standards (2008).
3.6.4.3 There are still many questions that need to be explored to arrive at the best approach. For example:
(1) People in different socio-economic groups have different levels of current mortality, but how their relative mortality will change in the future is unclear. They experienced different average annual rates of mortality improvement between the mid-1970s and late 1980s. However, their differences in average annual rates of mortality improvement reduced between the late 1980s and recent years (CMI Working Paper 39). How these different improvement experiences relate to the change in smoking prevalence between different socio-economic groups over time is not entirely clear, but this is certainly acknowledged to be a contributory factor. Will people in different socio-economic groups experience different rates of improvement in mortality in the future?
(2) There is a lack of credible and reliable data for the older population (above age 90). How do we work out their future mortality, particularly as medical advances may become of greater benefit to the elderly? In addition, if an indefinite (or very significant) extension to lifespan becomes medically achievable, what response should companies and others (including government and customers) look to make? Should providers be considering whether to change product designs now to cover such eventualities, or maybe even set a limit to the age for which annuity payouts would be made?
(3) Given the variety of methods available, how would the market compare assumptions if different companies or pension funds use different methods? Table 6 contains projections related to different methods. For each projection the cohort life expectancy at exact age 65 has been produced using the PCMA00 base mortality table projected to mid-2005 using the past rates of improvement contained in the Model described in CMI Working Paper 38. Projected mortality rates in years after 2005 are derived using the various projections listed to produce relative values for comparison (Hawes et al., Reference Hawes, Collinge, Erasmus, Fulcher, Houlihan, Patel, Rahman, Sinclair, Siu, Teggin and Yang2009).
Table 6Cohort life expectancy at age 65 for males.


3.7 Reinsurance and Risk Transfer
3.7.1 Much of the reinsurance in the annuity market is designed and placed on a fairly simple basis e.g. quota share. This contrasts with the protection market where an insurer will often use multiple reinsurers (e.g. one reinsurer to provide cover for smokers, another for non-smokers) and the financial design of the reinsurance may be sophisticated. It is likely that the reinsurance market for annuities will likewise become more sophisticated, with different reinsurers specialising in different risks.
3.7.2 To date writers of annuity business have had only a limited number of options available to enable them to pass the underlying risks to other parties. These options have typically involved:
(1) Removing the risk entirely by selling a block of annuities to another insurer through a Part VII transfer;
(2) Entering into a quota share arrangement in which a tranche of the underlying risks are passed to a reinsurer; or
(3) Through longevity reinsurance, passing only the mortality/longevity risk to a reinsurer. Longevity reinsurance is often referred to as a longevity swap.
3.7.3 More recently capital markets solutions have also been developed, but they do not yet provide a method for transferring significant amounts of risk to the capital markets. Capital markets solutions are also often based on an index, or a formulaic definition of longevity improvements, which creates potential basis risk for insurers. The investors behind these early capital markets transactions have often been reinsurers, or hedge fund investors who have followed the reinsurers’ assessment of the risk. We have yet to see significant interest from capital markets investors and these solutions so far represent a small proportion of the capacity provided by more traditional reinsurance solutions.
3.7.4 Full Risk Transfer Solutions
3.7.4.1 The only true full risk transfer solution for an annuity provider is to sell the annuity portfolio to another insurer. However, through quota share reinsurance solutions a percentage of the underlying risks (asset and longevity) may be passed to a third party reinsurer.
3.7.4.2 Under an annuity quota share reinsurance treaty an insurer will pay a reinsurer an upfront single premium in return for the reinsurer paying a fixed percentage of all future annuity payments on the business reinsured. Typically an insurer benefits from collateral to minimise its exposure to the reinsurer's credit.
3.7.4.3 One method for providing collateral is the reinsurer depositing the premium back with the insurer. Under this structure (see Figure 2) surplus arising on the assets deposited back will be payable to the reinsurer, which will be responsible for making actual annuity payments to the insurer. The terms for investment of the assets deposited back will be key to the pricing of the contract.
Deposit back method for providing collateral.
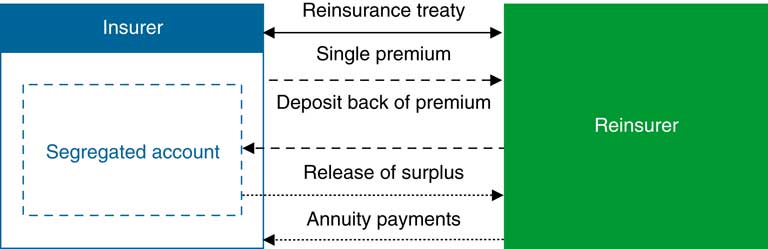
3.7.4.4 An alternative solution (see Figure 3) is for the single premium to be payable into a segregated account (separate from the insurer and reinsurer). The assets within this account will need to be insolvency-remote from the reinsurer and will provide security for the insurer should the reinsurer default on its obligations.
Segregated account method for providing collateral.

3.7.4.5 However, in both of the structures depicted in Figures 2 and 3, the insurer will not be fully protected against the default of a reinsurer, as the underlying annuity risk would then return to the insurer. This is the residual risk that only a full sale can eliminate.
3.7.5 Longevity-Only Risk Transfer Solutions
3.7.5.1 Recently a significant new market in longevity only insurance, or ‘longevity swaps’, has emerged. Under these contracts the annuity provider would retain the underlying asset risks while passing the longevity risk to a third party.
3.7.5.2 Typically these contracts have been backed by reinsurance. Under a longevity swap/reinsurance arrangement (see Figure 4):
Longevity reinsurance illustration.

(1) The insurer agrees to pay the reinsurer a fixed set of monthly cash flows (the ‘Fixed Leg’), which are equal to the expected annuity payments on day 1 plus the reinsurer's risk and profit margin.
(2) The reinsurer agrees to make actual monthly annuity payments (the ‘Floating Leg’) to the insurer over the duration of the contract.
(3) If the underlying annuities are index-linked, typically both the Fixed Leg and Floating Leg will increase with actual inflation experience.
(4) Current swap/reinsurance products mainly target annuities in payment, and may be offered on an indemnity basis (i.e. referencing the experience of the annuitised lives), or an index basis (i.e. referencing some other data such as UK population statistics). Capital markets solutions often reference an index, and this design leaves some basis risk with the ceding insurer.
(5) Counterparty risk is often mitigated through collateral arrangements. These usually reference a negotiated view of best estimate future mortality, which is used to determine the relative value of the swap. The rate and frequency with which this best estimate view changes will have a significant impact on how effective the collateral arrangements are in minimising counterparty exposure.
3.7.5.3 It is possible for other capital market solutions to be created, or developed further, which will also allow the transfer of some or all of the risks underlying an annuity. Alternatives may include:
(1) Annuity securitisation: The issuance of notes whose repayments reference surplus arising from an underlying annuity portfolio. Typically these notes would be split into different seniority tranches to maximise the potential investor base and obtain maximum price efficiency for the annuity provider.
(2) Longevity bonds: The issuance of bonds whose repayments reference an underlying mortality/longevity index. The first such longevity bond to be attempted was by the European Investment Bank in 2004, but this did not receive sufficient interest from investors and so was not issued. These bonds have been described more fully in Blake et al. (Reference Blake, Cairns and Dowd2006).
(3) Longevity forwards: Payments are made in the future, which reference the movements in an underlying mortality/longevity index. Such indices have already been created by investment banks and can be traded against.
(4) Longevity linked convertible bonds: The issuance of bonds whose repayments reference an underlying mortality/longevity index. Should the expected capital repayment at maturity be impaired, the bondholder will have the option to convert the bond into equity. This provides the insurer with a higher quality of capital, but also increases the probability of the investor being able to recover some/all of its investment in extreme scenarios.
3.7.6 Development of the Longevity Risk Transfer Market
3.7.6.1 Currently the reinsurance market in longevity-only risk is active, with several reinsurers expected to enter the market alongside the existing providers. The growth of this market is being helped by interest from pension scheme trustees, who like insurers are keen to look at ways to mitigate their exposure to longevity. 2009 also saw the first longevity swap transactions between pension scheme trustees and insurers, under which the risk has in the most part been directly passed onto reinsurers.
3.7.6.2 We are likely to see this reinsurance market grow. However, insurers/ reinsurers are unlikely ever to accommodate more than a small proportion of the total longevity exposure in the UK. The current amount of annuitant liabilities for insurers and pension schemes combined is estimated to be well in excess of £1 trillion. To be able to pass significant amounts of this risk to third parties, large-scale capital markets solutions would need to be developed.
3.7.6.3 There have been suggestions that the Government should issue longevity bonds to facilitate the retirement product market. In response, the Government have suggested they have no such current plans but will keep this under review – see Debt Management Office (2009). Government would need to balance the policy perspectives of assisting the annuity market with their already significant exposure to longevity risk through state benefits and public sector pension schemes. In funding cost terms, the benefits of receiving a premium for longevity risk would need to be weighed versus the likely lower liquidity of such bonds. For insurers, these bonds may not necessarily be attractive instruments in their own right since they would combine government bond exposure with the longevity hedge. However, they would create additional longevity supply which insurers could access via the capital markets, in the same way that government issuance of index-linked gilts supports capacity in the inflation swap markets.
3.7.6.4 Large-scale capital markets solutions may emerge in the short to medium term, with the insurance and pensions sectors and several investment banks currently actively investigating this area. In late 2009 the Life and Longevity Markets Association (LLMA) was formed, a non-profit organisation whose aim is to promote the development of a liquid traded market in longevity-related and mortality-related risk. LLMA brings together several market participants from the insurance, reinsurance and investment banking communities and shows the strength of desire for a viable liquid secondary market in longevity risk transfer to be created. We have also seen a few bespoke longevity-related transactions being completed, although often reinsurers rather than capital markets investors have been actively involved in the pricing and warehousing of the risk.
3.7.6.5 The potential benefits of a significant capital markets solution are substantial and could one day provide:
(1) An effective longevity risk mitigation tool to insurers and pension schemes, which could create significant capital benefits;
(2) A market price for longevity risk, which should allow shareholders to better assess the risks held within, and the value of, annuity providers’ portfolios; and
(3) Investors with a new asset class that provides scope for improved strategies for diversifying risk and optimising investor returns.
3.8 Summary
3.8.1 In this section we have examined techniques and data sources for determining base level mortality rates, and for setting rates of future change in mortality rates for the full spectrum of annuitant products as offered currently on the market. We have described the underwriting approaches and highlighted the detailed consideration for longevity rather than mortality underwriting.
3.8.2 Longevity risk management is, like other areas of risk management described in the following sections, becoming an area of increasing specialisation. The challenge for the actuaries who specialise in longevity risk is then to communicate the issues effectively to the decision-makers around them.
3.8.3 One area where developments are likely is around the issue of longevity risk transfer. While many of these techniques have recently emerged when considering bulk annuity transactions, there are implications for writers of individual annuities which could usefully be explored.
3.8.4 The development of techniques for modelling mortality at older ages has had a paradoxical result, i.e. as we have learnt more and developed much more powerful insight into the diversity of the current level of mortality and the complexity of the structure of changes in mortality rates, the actuarial profession has realised how much more remains to be understood. Longevity risk is a field where a definitive insight, allowing actuaries to develop a generally accepted and complete view on modelling this risk, remains undiscovered. This is one of the reasons it remains important for actuaries to ensure the uncertainty around this risk is communicated effectively and fully appreciated by their audiences.
4. Financial Management
4.1 UK Regulatory Capital Requirements
4.1.1 The capital requirements for UK-based insurance companies are set by the FSA. These can be divided between Pillar I requirements, which are broadly based on the EU Solvency I directives, and Pillar II requirements, which are derived using a risk based approach. Pillar II is often referred to as the Individual Capital Assessment (ICA) regime, and was originally consulted on in CP136 in 2002.
4.1.2 There are two components to the Pillar I capital requirements for annuity business:
(1) Long term insurance capital requirement (LTICR); and
(2) Resilience capital requirement (RCR) (the RCR does not apply in all cases – see below)
4.1.3 For the purposes of this paper we have assumed that the reader is broadly familiar with the requirements of this regime, although a brief summary is given in sections 4.2 and 4.3.
4.2 Pillar I Considerations
4.2.1 The LTICR is calculated as a straightforward percentage of mathematical reserves at the end of the valuation period. Typically for annuity policies this is calculated as 4% of the mathematical reserves, of which 1% represents the insurance expense risk capital component, and 3% the insurance market risk capital component. Mathematical reserves may be reduced for the proportion reassured but may not be reduced below 85% of the gross of reinsurance reserves for the purpose of calculating the LTICR. Hence, while the size of the LTICR is directly linked to the size of the overall mathematical reserves, the Pillar I capital requirements are not directly linked to the level of risk in the business.
4.2.2 The RCR only applies to companies that do not report under the realistic reporting regime (Twin Peaks). The RCR is calculated by applying a series of prescribed stress tests to both the assets and liabilities. These stress tests only apply to some elements of market risk and there is no credit risk stress within the RCR. It may appear anomalous that companies that have small (or no) with-profits funds suffer an additional capital requirement on any annuity business they write, compared with those that write similar levels of annuity business but have a with profit fund which falls within the realistic reporting regime (i.e. with-profits fund greater than £500m).
4.3 Traditional Approach to Pillar I
4.3.1 The mathematical reserves for annuities are calculated as the present value of future benefit outgo, and hence the key drivers for the mathematical reserves are mortality/longevity (discussed in section 3) and the valuation rate of interest.
4.3.2 The Pillar I regulatory peak requires insurance companies to use a valuation rate of interest derived from the risk adjusted yield on the assets backing the liabilities.
4.3.3 Traditionally, as discussed in section 5.1 below, insurers have sought to match annuity businesses with long term assets that are able to provide a relatively stable stream of income over time, in particular gilts and investment-grade corporate bonds.
4.3.4 The risk adjusted yield on corporate bonds must, as per INSPRU 3.1.41-43, make allowance for that part of the yield which is deemed to be due to credit risk. However, to the extent that part of the yield spread above comparable gilts is deemed to be due to factors other than credit risk, this element may be included as part of the risk adjusted yield – and is typically referred to as an ‘illiquidity premium’.
4.3.5 One common approach to analysing spreads is to try to decompose them as follows:
(1) Compensation for the expected default losses.
(2) Compensation for the uncertainty about default losses.
(3) Residual, including illiquidity premium.
4.3.6 In practice, companies have historically determined their allowance for the first two of these factors, and the illiquidity premium was a balancing item. Further, the traditional approach was to base the deduction for default losses on a prudent view of defaults typically set with regard to historic losses, and these default deductions were relatively stable, reflecting credit market conditions that had applied over many years.
4.3.7 As a consequence, in periods when spreads have widened, a larger proportion of the spread has been taken as the illiquidity premium within the valuation rate of interest. While this approach had previously looked to give a broadly reasonable and useable assumption, the extreme market conditions that applied in particular at December 2008 (year end for most companies) represented a challenge to the established approach.
4.4 Alternative Approaches to Pillar I
4.4.1 Credit Risk
4.4.1.1 Prior to the credit crunch, the spread between gilts and corporate bonds had been fairly stable over a long period. Over 2008 and 2009 the market turmoil led to a significant widening of spreads.
4.4.1.2 This led to uncertainty over the decomposition of the total spread into its constituent parts described above, and the validity of the traditional regulatory peak methodology of allowing for default risk based on historic default levels.
4.4.1.3 The FSA (2008) challenged the historic approach in the Insurance Sector Briefing of September 2008, in particular by emphasising that insurers were expected ‘to take account of both expected and unexpected credit defaults’ and by drawing attention to the overriding principle in INSPRU 1.2.16G that, when setting margins, companies should, where relevant, consider the ‘risk premium that would be required by an unconnected party to assume the risk’.
4.4.1.4 The FSA did not issue definitive guidance on how this was to be done and there is no generally accepted method for determining the size of the illiquidity premium. This has resulted in a wide range of practices across the market. One of the reasons for this could be the lack of disclosures that companies are required to provide on the size of the illiquidity premium they assume when determining the valuation rate of interest.
4.4.1.5 There has been a significant strengthening of regulatory peak default provisions over 2008 and into 2009, and annuity fund solvency has therefore been impacted by widening credit spreads.
4.4.1.6 One trend has been a change in focus to a defined level of reserves available to cover defaults. The amount of additional reserves held for default risk is intended to reflect the risk appetite set by the board and management's view on the required capital.
4.4.1.7 Only limited details of these approaches have been made publicly available but we understand they often assume defined allowances for credit risk in both the short and long term.
(1) Long-term allowances are notably higher than prior to the credit crunch reflecting greater expectation of volatility in bond defaults in future.
(2) Short-term allowances result in additional reserves for the higher than normal levels of default anticipated in the next few years. These reserves are no longer set by reference to credit spreads, but rather the cost assessed for excess defaults is assumed to run off over time, and reduce in line with defaults actually incurred (if any). Defaults therefore need to be closely monitored.
4.4.1.8 Figures 5 and 6 show credit haircuts by credit rating for a sample of insurers, taken from an analysis of FSA Returns. The first shows the median level of haircuts at end 2007 and end 2008 and shows that over 2008 UK insurers, on average, doubled their default haircuts in response to the widening credit spreads, so that the value of liabilities will have reduced by less than the value of assets, with an adverse impact on solvency.
Credit Default Haircuts 2007 & 2008. Source: FSA Returns End 2008.

Credit Default Haircuts 2008. Source: FSA Returns End 2008, Royal Bank of Scotland analysis.

4.4.1.9 Figure 6 compares the haircuts to an estimate of the spread on the corporate bond portfolios over equivalent gilt yields. This suggests that the median haircut was around 25% of the spread over gilts, so that essentially 75% of the spread was treated as an illiquidity premium and passed on through the liability valuation. The graph shows considerable variation around the median level, but in almost all cases default haircuts were at most 50% of the spread over gilts.
4.4.2 Valuation Rate of Interest
4.4.2.1 Many insurance companies use a single discount rate to value annuity business, blending the current risk-adjusted yield and the reinvestment rate if appropriate. However, typically when managing annuity business, companies use a combination of short-dated and long-dated bonds to produce the required cash flows to match liabilities.
4.4.2.2 The single discount rate approach under the current INSPRU rules requires the risk-adjusted yield to be calculated as the weighted arithmetic mean of the risk adjusted yields, with each asset weighted by its market value. As the market value depends on the duration of the asset and the current shape of the yield curve, the averaging process can place a disproportionate emphasis on a particular point on the yield curve.
4.4.2.3 For example, consider an asset portfolio of 50% short-dated and 50% long-dated bonds. If the yield curve is upward sloping then short-dated assets will have higher market prices, so when determining the valuation rate of interest more weight is placed on the shorter end of the yield curve. Discount rates are therefore lower than should be the case. The converse is true when the yield curve is downward sloping.
4.4.2.4 As an alternative approach, some companies have applied for a waiver from the FSA to allow them to use a portfolio gross redemption yield approach. Under such an approach the calculation of the Pillar I discount rate is as follows:
(1) Project cash flows on the entire basket of assets;
(2) Calculate the portfolio gross redemption yield, i.e. the single interest rate which when used to discount the asset cash flows will give the total market value of assets;
(3) The portfolio gross redemption yield is then the starting point for the valuation rate of interest.
4.4.2.5 The main advantage of this approach is that it more accurately captures when cash flows are expected to arise, and therefore shows where the true exposure to the term structure lies. The use of such a waiver is a one-way election, and companies cannot revert to the former approach if this would give a more favourable result.
4.4.2.6 One issue that some companies have struggled with in relation to their Pillar I position is that any efforts to de-risk their bond portfolio by switching to higher graded bonds results in a decrease in their valuation rate of interest, thereby reducing their published solvency position. The converse is true as well, and has introduced a potential incentive to increase credit risk in the portfolio if the published solvency position is worsening.
4.5 Pillar II Considerations
4.5.1 The Pillar II capital requirements present a number of issues for companies that write annuity business. The approach required under the FSA guidance to determining ICA capital is broadly to determine the realistic valuation (best estimate) of the liabilities, and then apply stress tests to the key risk drivers in order to arrive at the capital required to withstand a one in 200 year adverse event.
4.5.2 Best Estimate Liabilities
4.5.2.1 In determining best estimate liabilities for annuities, companies typically take a very similar approach to that used under Pillar I, except that the margins for prudence in the assumptions are removed. However, when determining the allowance for credit risk in Pillar II, companies tend to be more pessimistic than for Pillar I.
4.5.2.2 Based on results published in the Technical Practices Survey by KPMG (2009), on average the proportion of spread allocated to illiquidity premium was 59% for Pillar I but only 54% for Pillar II.
4.5.3 Stress Tests
4.5.3.1 One of the key issues for annuity writers is determining what is an appropriate stress test to apply to allow for the widening of credit spreads. Following the banking and corporate bond crises during 2008 and 2009, the security of corporate bond holdings has been brought under great scrutiny.
4.5.3.2 A recent survey compared the stresses that were applied by companies over 2008 and 2009. As clearly shown by the responses summarised in Table 7, the assumed widening of credit spreads in the stress situation has increased dramatically. This has presumably led to a significant increase in the ICA capital for annuity providers.
Comparison of credit risk stress tests in 2008 and 2009.

Source: KPMG Technical Practices Survey 2009.
4.5.3.3 Base mortality rates, and sometimes mortality improvements, are also stressed as part of the ICA calculations. These can be quite large stresses as they represent a 1 in 200 year event. The KPMG technical practices survey indicated that on average companies stress the base annuity mortality assumptions by about 21% (so that a ‘stressed’ qx is 79% of the base qx). Mortality improvements are stressed in a variety of ways (e.g. medium cohort to long cohort, or higher underpins). However, on average the overall combined effect of stressing the base mortality and mortality improvements was found to be equivalent to about a 23% reduction in mortality rates. This compares rather closely with the final advice from CEIOPS under Solvency II which sets a 25% overall stress, although it could be argued that this stress should reasonably be varied for annuitants of different ages.
4.5.4 Correlations
4.5.4.1 One area of interest is the correlations that may be applied to annuity risks within the ICA calculation. A study prepared by Deloitte & Touche LLP (2005) for the ABI looked at correlations between annuitant mortality and assured lives mortality and made a number of interesting observations.
4.5.4.2 For many insurers this is an important area of focus. The effect on capital requirements can be significant depending on the relative sizes of the annuitant and assured life blocks of business. Annuitant and assured lives mortality rates at the same ages are likely to be highly correlated, but generally annuitants and assured lives belong to different age groups. Patterns of mortality improvement may differ between age groups and thus correlation between annuitant and assured lives may be lower due to the differing age profile of the populations.
4.5.4.3 The effect of high correlation would be to reduce, rather than to increase, the overall capital requirement, since insurance risk affects the capital required to support assurance business and annuity business in opposing ways. (The appropriate stress test for protection business is increased mortality whereas for annuities it is decreased mortality.) Impact of selective lapse and re-entry of assurance business must be considered as annuity terms are typically fixed and policies are not currently transferable.
4.5.4.4 The ABI concluded that an indicative range for this correlation is −75% to −20%. This compares with the final advice from CEIOPS under Solvency II which sets a −25% correlation.
4.6 Profit Reporting
4.6.1 So far our discussion has been around regulatory capital requirements. However, Pillar I and Pillar II are not necessarily aligned to methods used to inform shareholders of profitability, such as IFRS or embedded value.
4.6.2 Many commentators have said that the current IFRS rules for insurance contracts are not particularly helpful in determining profitability. This is because the rules require companies to follow local GAAP, which for the UK is based on the Pillar I liabilities. Since Pillar I requires a prudent assessment of the liabilities it does not clearly portray the underlying shareholder value. This has been one of the key reasons why many companies have chosen to publish embedded value information alongside their published IFRS accounts.
4.6.3 Discussions around the valuation method that will be applied under IFRS4 Phase II are still continuing. This is not expected to be implemented until after the introduction of Solvency II and is also expected to be based on a market-consistent approach but incorporating allowance for illiquidity of the liabilities (not of the backing assets). The IASB has stated that it is not currently minded to give guidance on the assessment of any illiquidity premium, although as discussed in the next section, other influential voices have expressed an alternative view.
4.7 Embedded Value
4.7.1 Embedded value reporting is well established in the UK and is used widely by larger European life insurers. It has had a somewhat chequered history though, largely due to the historical lack of detailed rules or guidance. Not surprisingly, this lack of guidance has led to considerable diversity in how companies prepared their embedded value results.
4.7.2 However, the CFO Forum has played a major role over the last five years in codifying an approach to embedded value reporting, through the publication of the European Embedded Value (EEV) principles in 2004, guidance on disclosures in 2005, and more recently the Market Consistent Embedded Value (MCEV) Principles. While the move to MCEV had been heralded as a big step forward in standardising embedded value reporting, the original MCEV Principles raised some significant issues for companies writing substantial blocks of annuity business.
4.7.3 Under market-consistent methodology, the market value of an asset is a function of the expected future cash flows generated by that asset after allowing for the risks associated with the emergence of those cash flows. Applying the same methodology to the liability cash flows and by using certainty equivalent techniques, the investment return is set equal to the risk-free rate, which is also used to discount liability cash flows. (The CFO Forum prescribes the use of swap yield curves as the risk-free rate wherever possible.) This represented a significant change from traditional methodologies that take credit implicitly for future investment returns in excess of the risk-free rate.
4.7.4 In reality, investments may out-perform risk-free assets and therefore any ‘extra’ investment return that emerges is shown as an investment variance within the analysis of the embedded value profits.
4.7.5 Critics of the MCEV Principles pointed out that UK annuity contracts are very illiquid. Under the terms of a UK annuity contract, a policyholder pays over a lump sum to an insurer in exchange for an income stream for the remainder of their life. Crucially, there is no ability on the part of the policyholder to reverse this contract and receive a lump sum from the insurer. This is the case even if the policyholder were to die or was unhappy with the service received from the insurer. Consequently, from an insurer's perspective there are no circumstances where, due to policyholder action, it would have to sell corporate bonds and realise a loss at a disadvantageous point in the market.
4.7.6 The volatility of credit spreads is of little economic significance to the life company provided that it has both the ability and the intention to hold the bond to maturity. The principal economic risks for an annuity writer in that situation are:
(1) actual defaults;
(2) reinvestment risk (as most annuity writers have shorter assets than liabilities); and
(3) longevity.
4.7.7 Because of this, many companies argue that the insurer should benefit from the illiquidity premium in the discount rate with which it calculates the embedded value. Indeed, without such an allowance, annuity business is likely to show a loss on inception, because in order to price annuity contracts competitively, companies will take account of the total expected return from the assets backing that business, whereas they can only take credit for the risk-free rate for the purposes of MCEV.
4.7.8 After publication of the original MCEV Principles, the main annuity writers lobbied the CFO Forum about how to address this issue. One argument that was used was that as embedded value reporting was initially introduced, partly to show the value that management had added to a life company, showing an initial loss on what management considers to be profitable business is somewhat counter-intuitive, even if it is consistent with financial economics.
4.7.9 A deferral of profits is not usually an attractive proposition and raises the question of whether companies will find annuity business less attractive to write. It is important to recognise that the cash flows under the contracts remain the same and therefore their economic value has not changed. The profits will emerge over time as the earnings on assets are realised over the lifetime of the annuities.
4.7.10 In October 2009 the CFO Forum published a revised set of principles which allowed the use of an illiquidity premium. The changes affirm that the reference rate to be applied under MCEV should include both the swap yield curve appropriate to the currency of the cash flows, and on top of it, an illiquidity premium, where appropriate. However, this is far from the end of the debate as the calculation of any illiquidity premium, and indeed whether or not it should depend on the assets held, has not been prescribed.
4.8 Summary
4.8.1 There are a variety of measures and metrics which companies make reference to when managing their annuity business (Pillar I capital, Pillar II capital, EV, IFRS). Moreover, at times one of these measures may suggest actions that have an adverse effect on another of the measures. This makes the financial management of annuity business very complex. Often companies have to decide which measure is the most important to them and manage the business based on that measure, and acknowledge that there will be impacts on the other, less prioritised, measures.
4.8.2 It is unclear what will happen to these measures under Solvency II, although the trend is that there will be greater comparability between each of these (and potentially they could all merge into a single measure). However, given the continued debate around what allowance should be made for illiquidity premiums and a reluctance by any authority (regulators, CFO Forum, IASB) to give definitive guidance on how to measure these illiquidity premiums, there is likely to continue to be a variety of methods used and consequent difference in outcomes from the different measures for the foreseeable future.
5. Investment Management
5.1 Traditional Approach
5.1.1 Traditionally investment policy for life company annuity portfolios has shown a strong bias towards fixed income investments, with a relatively high proportion in long-dated credit (corporate bonds) rather than government bonds, and with bond cash flows matched closely, where possible, to liability flows.
5.1.2 The historic reasons for this are explored in both Dyer et al. (Reference Dyer, Crouch, Eason, Fulcher and Jolly2004) and Fulcher et al. (Reference Fulcher, Baid, Chambers, Catchpole, Tatham, Rogers and Jolly2007). These can be summarised as follows:
5.1.3 Regulatory Capital Efficiency
5.1.3.1 As discussed in section 4.3 above, the traditional regulatory valuation allowed life offices to capitalise a portion of the credit spread when valuing liabilities.
5.1.3.2 In particular, the risk-adjusted yield would typically be higher for corporate than for government bonds, and higher (for example) for BBB than for AAA credit. Hence taking risk through long-dated credit led to a reduction in regulatory capital requirements and a relatively stable capital position.
5.1.3.3 This also meant that a large part of mark-to-market volatility on credit assets, arising from spread volatility, could be recovered via the liability valuation due to an increase in the risk-adjusted yield, with limited net capital impact.
5.1.3.4 The Resilience Capital Requirement also excludes a stress test for credit spreads (which would, in any case, have limited impact based on the methodology above since liabilities would largely reduce in line with assets). Life companies were required, in contrast, to hold a RCR against exposure to equity and property risks. Hence taking sources of risk other than credit leads to, potentially significant, additional risk capital requirements. There is also no explicit credit in the regulatory peak for diversification of asset/liability exposures and hence no capital incentive to diversify risk exposures.
5.1.3.5 For interest rate risk, insurers held resilience reserves against exposures to rate rises or falls. In addition, most insurers held additional cash flow mismatching reserves, assuming very prudent disinvestment and reinvestment rates where asset and liability flows are not fully matched. Therefore close cash flow matching with bonds was the most capital efficient strategy.
5.1.3.6 The calculation of the risk-adjusted yield under INSPRU is also penal on reinvestment risk on credit spreads, hence long-dated credit is preferred over short-dated credit to hold against annuity business.
5.1.3.7 Regulations strictly limit the extent of currency mismatching allowed, and an EU Directive requires that insurers match ‘index-linked’ benefits ‘as closely as possible’ with assets. This is interpreted as including inflation-linked annuities, requiring insurers to invest in inflation-linked bonds or use inflation swaps to match such liabilities.
5.1.4 Other Benefits of Credit Assets
5.1.4.1 Credit spreads historically have been very wide relative to historic default losses, leading to a material expected premium above risk-free rates: see Muir et al. (Reference Muir, Chase, Coleman, Cooper, Finkelstein, Fulcher, Harvey, Pereira, Shamash and Wilkins2007).
5.1.4.2 To the extent this represents a premium for illiquidity and/or mark-to-market risk, a hold to maturity investor such as an annuity book should benefit from this, as they should be able to capture, over the term of the bond assets, the benefit of their illiquid liabilities.
5.1.4.3 There are other assets that are equally or more illiquid and would be expected to enjoy an illiquidity premium, but these do not benefit from the ‘pull to par’ of bonds, i.e. a fund would typically need to liquidate assets to meet liabilities.
5.1.4.4 Available market yields and credit spreads can be used to drive pricing of new business in a transparent fashion.
5.1.4.5 Duration matching of assets and liabilities makes good economic sense, as well as regulatory sense. For example, if an insurer invests in bonds that are shorter-dated than liabilities, then they are exposed to reinvestment risk on both interest rates and credit spreads. Fixed (index-linked) income can be used to match fixed (inflation-linked) cash flows, i.e. provide year by year cash flow matching with reasonable tolerance.
5.1.4.6 Timmis et al. (Reference Timmis, Allan, Evans, Plenderleith and Roe2010) consider the extent to which historic investment strategy has been constrained by historic regulation, and how a less constrained asset allocation may have performed during the global financial crisis.
5.2 Challenges to the Traditional Approach
5.2.1 Regulatory Changes
5.2.1.1 Since the publication of CP97 in 2001 (FSA, 2001), insurance regulation in the UK, particularly for with-profits business, has moved towards a more economic and risk-focused regime, the introduction of the ‘realistic peak’ being an example of this.
5.2.1.2 In addition insurers have been required to form their own view of risk and capital via the Individual Capital Adequacy Standards.
5.2.1.3 At the same time, the regulatory peak basis has, to some extent, been moved to a more realistic economic framework. For example, following PS06/14 in 2006 (FSA, 2006), realistic reporters are no longer required to hold resilience reserves. It is also arguable that the requirements for cash flow mismatching and reinvestment risk under the current regulatory peak requirements are more economic and less artificial than approaches that were required from historic regulation and also driven by actuarial guidance (GN8) which is no longer applicable.
5.2.1.4 Typically under the ICA, explicit capital is held against credit risk on a one-year horizon, which can lead to a capital disadvantage for long-dated credit. The impact of credit spread widening on the ICA capital position may still be limited to the extent this is deemed to represent a rise in illiquidity premiums, although typically lower levels of illiquidity premiums have been assumed in the ICA than in the theoretically more prudent regulatory peak valuation, as discussed in paragraph 4.5.2.1 above.
5.2.2 Regulatory Impact of the Global Financial Crisis
5.2.2.1 As discussed in section 4.4, the impact of the global financial crisis on credit spreads has challenged the traditional approach to setting the risk-adjusted yield, with materially higher default assumptions resulting.
5.2.3 New Investment Approaches
5.2.3.1 From an investment perspective, insurers have made much greater use of new instruments. In particular, the use of interest rate and inflation swaps has become wide spread amongst annuity funds, and this has enabled insurers to separate investment choices e.g. credit selection, from duration/inflation matching.
5.2.3.2 In the BPA market there has also been an influx of new entrants, often with backers from outside the insurance sector (e.g. private equity funds or investment banks). These new entrants have been less influenced by traditional approaches and thinking, albeit that they are ultimately constrained by the same regulatory requirements.
5.2.4 Recent Market Conditions
5.2.4.1 There has been significant turbulence since 2007 in financial markets and, in particular, a rapid change from the relatively benign markets in 2005–7 to the much more volatile markets seen since mid-2007, with a major financial crisis followed by the impact of quantitative easing from central banks leading to:
(1) steeply sloping yield curves, with very low short-dated interest rates;
(2) swap rates below government bond rates at the long end, and volatility of the spread between swap and government bond rates;
(3) widening of the cost of credit protection on governments, calling into question the security of ‘risk-free’ sovereign risk;
(4) the ability to earn significant spreads above LIBOR from asset swapping gilts, linkers and other government guaranteed paper;
(5) extreme volatility of credit spreads;
(6) a significant apparent illiquidity premium, e.g. as evidenced by a margin of on average around 250bps at year end 2008 between bond yields and the premium for credit protection under similar credit default swaps (CDS);
(7) the default of some banks and other corporate entities;
(8) non-call of callable bonds issued by financial companies, on grounds of economics (cost of re-financing versus step-up on non-call) as well as mandatory non-calls and coupon deferral for banks receiving state aid;
(9) high volatility in foreign exchange (FX) markets; and
(10) increased correlation amongst most markets in the adverse market conditions.
5.2.4.2 This has produced severe challenges for annuity fund investment strategies. In particular it has highlighted the systematic exposure of annuity funds to credit and the potential risks and issues associated with hedging strategies, as discussed below. More generally, it has demonstrated the need for investment strategies and risk management to allow for the potential for extreme, and often unexpected, market moves and the importance of scenario testing.
5.3 Current Investment Strategies
5.3.1 The investment strategies for non linked business as at end 2008, per published FSA Returns, for 11 of the main players in the annuity market are shown in Figure 7. This includes new entrants in the BPA market and longer established insurers writing BPA business as well as those who focus on the individual annuity market.
Investment Portfolios backing Non Linked Business 2008. Source: RBS, FSA Returns End 2008.

5.3.2 We see that corporate bonds (‘other fixed interest securities’) represent the majority of most portfolios, followed by approved fixed income (gilts, supranational and other Government guaranteed debt).
5.3.3 Variable interest securities may typically be held to match expense outgo, although one of the insurers in the graph has a significant portion of its fund invested in such assets.
5.3.4 Several of the insurers have small property portfolios to provide an additional source of diversified return. These include sale and leaseback structures, which are more ‘regulatory friendly’ than direct property investment because of the guaranteed, long-dated rental income that provides an attractive risk-adjusted yield for the regulatory peak. Sale and leaseback can also provide an attractive source of inflation to match index-linked annuities.
5.3.5 ‘Other’ assets in Figure 7 include:
(1) commercial and other mortgages;
(2) derivatives – and in particular the mark-to-market position on them; and
(3) deposits and other assets to provide liquidity as well as funding the LIBOR leg of any derivative hedges.
5.3.6 Analysis of FSA Return disclosures shows that derivative use is becoming commonplace within annuity funds, including:
(1) the use of interest rate swaps to manage duration matching;
(2) RPI swaps to hedge inflation linked liabilities; and
(3) FX hedges and cross-currency swaps to enable diversification into non-sterling denominated bonds.
5.3.7 Some insurers have also made use of CDS, either as an alternative to cash bonds to take credit risk, or as a way to hedge the credit risk on their corporate bond portfolios.
5.3.8 Duration
5.3.8.1 Figure 8 shows, based on FSA Returns, the duration of approved (e.g. gilts) and credit portfolios, and how these both moved over 2008 for a number of insurers. This shows a clear trend for a shortening of credit duration, and a lengthening of the duration of approved security portfolios. These changes are typically in excess of those expected due just to falling yields on approved securities and rising yields on corporate bonds, and hence represent an apparent shift in strategy.
Duration of Approved & Credit Portfolios 2008. Source: RBS, FSA Returns End 2008.

5.3.8.2 In part this may reflect a lack of supply/liquidity over 2008 in long-dated credit, but it may also represent a shift towards a more ICA/Solvency II ‘friendly’ strategy of reducing credit spread volatility.
5.3.9 Inflation Matching
5.3.9.1 For index-linked annuities, the EU ‘close matching’ requirement means that insurers must hold assets that match the liability inflation linkage as closely as possible. There are two distinctive approaches that could be adopted:
(1) Invest in physical inflation linked assets to provide the inflation linkage.
(2) Alternatively use inflation swaps to provide the linkage and invest in physical assets without inflation linkage. Indeed an insurer might have a common investment policy for all annuities, with swaps used to provide the liability matching for index-linked annuities.
5.3.9.2 Analysis from FSA Returns demonstrates companies following each of these strategies (see Figure 9).
Investment Portfolios backing Index-Linked Business 2008. Source: RBS, FSA Returns End 2008. The apparent negative balance of inflation swaps for insurer D reflects the negative mark-to-market position on the portfolio of swaps as at the end 2008 reporting date.

5.3.9.3 From Figure 9, we see that insurers A, B and C make extensive use of variable securities to match their index-linked annuities. By contrast, insurer D backs its index-linked annuities mainly with fixed income securities, swaps being used to provide the necessary inflation linkage and E follows a strategy somewhere in between.
5.4 Practical Issues
5.4.1 Hedging of Liabilities Using Derivatives
5.4.1.1 As discussed above, many insurers have recently made extensive use of derivatives. Eason et al. (Reference Eason, Diffey, Fulcher and Wilkins2009, Reference Eason, Diffey, Evans, Fulcher and Wilkins2010) and Hawes et al. (Reference Hawes, Collinge, Erasmus, Fulcher, Houlihan, Patel, Rahman, Sinclair, Siu, Teggin and Yang2009) both explore the effectiveness and regulatory treatments of life office hedging strategies, particularly in light of the global financial crisis, highlighting the following issues:
(1) Basis risk and mark-to-market volatility between the hedging instrument and the hedged risk: For example government bond yields vs. swaps, inflation breakevens from physical bond markets vs. RPI swap levels and physical bond spreads vs. CDS premiums all showed considerable mark-to-market volatility during 2008–2009. In some cases, the volatility of the basis risk was actually higher than the volatility of the risk being hedged.
(2) Counterparty risk and the associated additional capital requirements: This includes the need for appropriate collateral arrangements, as well as consideration of replacement costs if counterparty fails.
(3) Collateral arrangements: While these can help protect against counterparty risk they can raise issues of their own, particularly in volatile markets. Mark-to-market positions can become significant requiring the insurer to post/receive large volumes of cash or other liquid securities. This may require insurers to stress test potential collateral calls when recommending the volume of liquid (or ‘eligible’) securities to hold within the fund. Assets held as collateral will typically earn a low return and thus significant collateral calls are likely to negatively impact the portfolio yield.
(4) Portfolio yield impact: Swap contracts that are heavily in the money will generate a return linked to LIBOR, which will typically serve to reduce the overall portfolio yield.
(5) Inflation risk: The caps and floors on inflation linkage in contract terms may not be matched fully by available market instruments, particularly for deferred pensioners.
(6) Currency risk: Practical issues arise from hedging of non-GBP bonds with short-dated FX futures or FX forwards. These include the volatility of basis swap levels when rolling futures and the impact of potentially significant cash settlements and collateral calls.
5.4.2 Cash Flow Matching
5.4.2.1 As discussed above, the regulatory incentive for close cash flow matching is arguably less now than was traditionally the case. Notwithstanding this, cash flow matching remains high on the agenda for most insurance companies, particularly those in run-off and with limited free capital. Indeed, the recent financial crisis has depleted the free capital of many insurers, creating extra focus on this area of asset-liability management.
5.4.2.2 Unlike with-profits funds, annuity writers do not have the ability to smooth policyholder payouts and/or reduce bonus levels (with the exception of with-profits annuities). In the absence of a cash flow matched strategy, they are exposed to the risk of forced sales of assets, possibly illiquid ones, and perhaps at times of market distress.
5.4.2.3 However, a cash flow matched strategy does not necessarily guarantee that regulatory/accounting results will be immune to shifts in interest rates curves. In particular, the insurer will need to consider:
(1) The wide variety of conflicting metrics that are relevant, e.g. regulatory peak, ICA, IFRS profits and capital, EV, Solvency II.
(2) Which cash flows to match (e.g. regulatory peak flows, best-estimate flows, stressed flows from the ICA): these can be materially different in terms of both cash flows and the interest rate sensitivity.
(3) Which discount rate is used to value liabilities: e.g. regulatory peak valuation rate, expected return on assets, gilts, swaps.
(4) Matching issues: Due to the artificial nature of the calculation, such as the use of a fixed rate of interest for all terms, and the 2.5% deduction from the risk-adjusted yield on assets to determine the valuation interest rate.
5.4.2.4 These factors can make a material difference to the interest rate sensitivity, as shown in Hawes et al. (Reference Hawes, Collinge, Erasmus, Fulcher, Houlihan, Patel, Rahman, Sinclair, Siu, Teggin and Yang2009). Therefore the insurer must typically find a balance between cash flow matching and immunisation of financial results/regulatory capital. The latter is typically achieved using duration and convexity matching to match the sensitivity of assets and liability values over short-term time horizons.
5.4.2.5 In practice, the exercise of cash flow matching also raises a number of further issues, including:
(1) Should the matching take into account defaults on the bonds and at what level of prudence? Any differences between allowed for and observed defaults will give rise to excess or shortfalls in cash flow.
(2) Difficulties associated with modelling callable bonds: The decisions and rationale for calls/non-calls have been continually evolving over the past 18 months, and insurers must correspondingly revise their modelling assumptions and rebalance their matching. The non-call of bonds could lead to an unexpected need to liquidate other bonds to meet cash flows.
(3) The limited supply of bonds in the market with which to match cash flows, particularly for index-linked liabilities.
(4) Derivatives strategy: Interest rate swaps and inflation swaps can be used to refine hedging, but the use of derivatives raises a number of issues as discussed in the previous section.
(5) Frequency of rebalancing: More frequent rebalancing should lead to more accurate matching, but will incur increased frictional costs of administration and trading.
5.5 Solvency II and MCEV
5.5.1 Solvency II has potentially very significant implications for annuity business in the UK, and is discussed extensively in section 7. From an investment strategy perspective, the key themes emerging are:
5.5.2 Use of a One Year Time Horizon, rather than Run-Off Basis
5.5.2.1 Solvency II essentially makes the premise that liabilities will be transferred to a third party at the end of the year, at which point the assets will be switched into the matching ‘risk-free’ portfolio. Capital is therefore held against the risk that the current portfolio is insufficient after one year to provide for this transfer of obligations.
5.5.2.2 This is a significant contrast to the current approach for investment strategy for most annuity books, supported by the regulatory peak valuation, which considers a run-off approach to assessing the ability of an insurer to meet its obligations.
5.5.2.3 Solvency II therefore focuses on the risk of short-term movements in market value, and less on long-term cash flow matching. For example, Solvency II does not require reserves against cash flow mismatches and long-term reinvestment/ disinvestment risks, but rather to hold capital against the changes in the value of assets versus liabilities that might arise from moves in interest-rate curves over a one-year time horizon.
5.5.2.4 To give a simple example here, imagine an insurer with a 20 year liability cash flow, covered by two zero-coupon bonds with maturities in 19 and 21 years. If the insurer does not rebalance its portfolio, it would be exposed to the rate at which it could reinvest the proceeds of the 19 year bond for one year at maturity, and to sell (disinvest) the 21 year bond one year before maturity.
(1) Under traditional valuation approaches, the life company would hold very prudent capital against this reinvestment/disinvestment risk. For example, they may have assumed that reinvestment would be at very low rates (e.g. 0%) but that simultaneously disinvestment would be at very high rates (e.g. as high as 15% in some cases). This could give rise to reasonably material capital requirements. Under the current regulatory peak rules, the life company would still be required to take the cash flow mismatch into account, albeit on a less prudent and more economic basis.
(2) In contrast, Solvency II implicitly assumes that the portfolio would be rebalanced at the end of one year into a matching bond. Hence it focuses solely on the change in market value of assets versus liabilities from curve moves over a one-year period. The resulting capital would likely be minimal given this particular asset-liability position.
5.5.3 The Choice of ‘Risk-Free’ Discount Rate
5.5.3.1 The appropriate risk-free discount rate for annuity business, and the potential inclusion of an illiquidity premium, is an area of intensive and ongoing debate at the time of writing.
5.5.3.2 As discussed in section 7, CEIOPS advice in November 2009 recommended the use of government yields as the risk-free rate, but did suggest potential for inclusion of an illiquidity premium for annuity business, albeit with significant restrictions.
5.5.3.3 Even if an illiquidity premium is allowed in discounting annuity liabilities, Solvency II is fundamentally based on a market-consistent method so that this illiquidity premium should be a function of the nature of the liabilities rather than the particular assets held. Therefore, insurers under Solvency II are likely to have more capital sensitivity to credit spread volatility than is currently the case.
5.5.4 Credit Spread Risk Capital
5.5.4.1 Capital must be held against credit spread risk, and this will typically be greater for longer-duration bonds. It is as yet unclear whether insurers will be able to assume, as is presently done in most ICAs, that part of this spread is due to changes in the illiquidity premium, but again we would expect capital requirements to increase, particularly for lower-rated credit.
5.5.5 Diversification Benefit via the Correlation Matrix
5.5.5.1 The diversification benefit of other asset classes, and other risks, is explicitly recognised in Solvency II which actively encourages diversification via the correlation matrix. Therefore we may also see heightened levels of diversification over the next few years as insurers begin transitioning to the new regulatory regime. Indeed, some existing capital measures (such as the ICA framework) already reward diversification.
5.5.6 We would expect that Solvency II would provide an incentive for insurers to move away from longer-dated credit, and towards a more diversified asset mix with shorter-dated credit and other assets, with swaps and long-dated government bonds used to manage interest rate risks. Active interest rate mismatches may be taken, to the extent that interest rate is seen as a rewarded risk (e.g. if curves are artificially depressed due to demand from life companies), and liabilities may be less closely cash flow matched than currently.
5.5.7 This will reduce mark-to-market risk relative to a risk-free portfolio, but will potentially come at the expense of a greater exposure to reinvestment risk, particularly in terms of the ability to lock in expected returns earned on the assets over the term of the contract to meet pricing targets.
5.5.8 Further, Solvency II may reduce the ability of insurers to invest in illiquid assets, due to the likely greater volatility of available capital and the more risk-based capital requirement. In the event that credit markets fall, insurers may be forced to sell assets, not to meet cash flows, but rather to reduce their risk capital requirements.
5.5.9 The potential implications of Solvency II on investment strategies are explored further in Hawes et al. (Reference Hawes, Collinge, Erasmus, Fulcher, Houlihan, Patel, Rahman, Sinclair, Siu, Teggin and Yang2009).
5.5.10 MCEV
5.5.10.1 Similar to Solvency II, the CFO Forum's MCEV Principles, when first published in June 2008, prescribed the use of the swap curve for valuing annuity business.
5.5.10.2 However, as discussed in section 4, the financial crisis has led to the CFO Forum confirming in October 2009 that the principles would be changed to reflect inclusion of an illiquidity premium. Nevertheless, and as with Solvency II, the trend to market-consistent financial reporting is likely to reduce the privileged position of credit as an asset class for annuity business.
5.6 Potential for New Asset Classes
5.6.1 Increasingly, insurers are investigating the possibility of using ‘non-traditional’ asset classes to back their annuity business. Analysis from FSA Returns, as above, shows that some insurers have already started to transition away from pure bond portfolios into assets such as sale and leaseback and commercial mortgages.
5.6.2 Annuity liabilities are illiquid in nature. Consequently, annuity funds are well placed to invest in illiquid assets, for which there is a dearth of investors after the global financial crisis, and take advantage of the illiquidity premium inherent in the underlying yield. Annuity funds may also be better placed to provide long-term finance in future than banks.
5.6.3 With respect to index-linked annuities, the BPA market has grown rapidly over 2008–2009, and this has led to a significant increase in the volume of index-linked business on insurers’ books. Consequently, there is much greater demand for inflation-linked assets. Additionally, much of this business has caps and floors in place, so there is increasing appetite for assets with suitably tailored inflation linkage, which also provide diversification of inflation exposure away from the derivative counterparties.
5.6.4 Other reasons for considering new asset classes include diversification of risk and seeking assets that may provide an offset for longevity risks.
5.6.5 Examples of new asset classes being considered include:
(1) Asset-backed securities and covered bonds.
(2) Equity release mortgages: These can be considered as a partial longevity hedge, since lighter mortality will increase the term of the mortgage and hence the period over which margins can be earned. However, as discussed by the Equity Release Working Party (2005), lighter mortality can also increase the exposure to no negative equity guarantees (NNEGs) and mortgage decrements are also driven by other factors such as entry into long-term care not just mortality.
(3) Ground rents: Bonds secured on the inflation-linked and very long-dated ground rents paid by leaseholders.
(4) Infrastructure: Financing of long-term projects, in the form of debt which could be inflation linked, in line with the underlying project cash flows.
(5) LIBOR-generating assets to provide the floating leg on swap contracts.
5.6.6 There are however several challenges associated with non-traditional assets:
(1) The insurance company's ability to model and understand the risks associated with the assets, particularly new risks that may be introduced.
(2) Educating the Board and getting senior management buy-in.
(3) Market prices on less liquid assets will be less observable – hence there may be need for a mark to model approach. Similarly non-market risks, such as NNEGs in equity release mortgages may require a mark to model approach.
(4) The potential for introducing additional risks for which capital must be held, e.g. counterparty risk, mark-to-market risk.
(5) Demonstrating admissibility for statutory reporting and overcoming other regulatory obstacles. For example, due to the nature of the regulatory peak framework, insurers currently require these non-traditional asset classes to provide long-dated, relatively secure (‘risk-adjusted’) income. However, with the introduction of Solvency II with its one-year time horizon and market-consistent approach, this may not be a prerequisite. Solvency II may, as discussed above, reduce the ability of life insurers to benefit from the illiquidity of their liabilities.
(6) Definition of mandates and performance measurement for asset managers as asset classes move away from more liquid credit benchmarks: see section 5.7.
5.7 Defining Investment Mandates
5.7.1 The traditional approach to setting investment mandates for annuity funds relied on relatively constrained metrics. For example, investment managers were required to closely match liability cash flows and limits on sector and rating exposures were tightly defined. Performance management was typically focused on the ex-ante long-term expected return on the portfolio and whether this met pricing targets.
5.7.2 However, this had the disadvantage that asset managers were unable to add significant value through active management of duration and credit positions. They were often forced to buy bonds from particular sectors simply to provide the appropriate liability cash flows at required maturities. Ex-post performance measurement was also difficult due to the lack of a standard benchmark against which to assess returns.
5.7.3 More recently, derivatives have increasingly been used to aid liability matching. There has been a trend to give asset managers mandates based on more liquid benchmarks and with fewer constraints. Overlays are then used to provide the fine-tuning on liability matching, typically with the asset-liability management function.
5.7.4 However, the growing range of potentially conflicting relevant metrics (regulatory peak capital, ICA capital, IFRS profits, embedded value) causes issues for investment management mandates since asset strategies that may be optimal under one benchmark can be detrimental under another. It can also be practically difficult for asset managers to estimate the impact their decisions may have on each of these metrics, so that it is difficult to avoid imposing significant constraints.
5.7.5 If, as anticipated above, asset classes are increasingly diversified, then performance and risk measurement will need to move away from credit benchmarks.
5.7.6 The move to market-consistent approaches such as Solvency II and MCEV will place increased emphasis on short-term returns and volatility in market values relative to a risk-free liability portfolio benchmark. This in turn may lead to a greater use of value-at-risk measures to assess risk.
5.7.7 However, one significant issue with more diversified portfolios will be ex-ante measurement of expected returns in order to drive pricing and assess whether returns on capital are likely to be met.
5.7.8 We would expect the move to Solvency II to lead to more diversified asset portfolios and less constrained investment mandates, but to present a number of new and significant challenges.
5.8 Summary
5.8.1 Traditionally, annuity providers have invested in a closely matched portfolio of corporate, and government, bonds. This strategy was, in part, influenced by the traditional Pillar I regulation, based on a long-term cash flow matching approach, with credit risk manifested as default risk.
5.8.2 Regulation and financial reporting for annuity business is undergoing a fundamental change, in particular the move, under Solvency II, to a one-year value-at-risk approach versus a risk-free portfolio, with credit risk represented by mark-to-market spread volatility. Irrespective of the outcome of the current debate as to the appropriate risk-free rate this is likely to represent a significant challenge to existing asset strategies, particularly in terms of a transition strategy.
5.8.3 The global financial crisis has also highlighted a number of significant issues for insurers in terms of management of their business, such as the need to carefully consider basis risk on hedging strategies and potential for unexpected liquidity strains, such as from collateral calls or non-call of financial assets.
5.8.4 Annuity providers are increasingly seeking to diversify away from corporate bonds into new asset classes, and the global financial crisis has potentially presented new opportunities for insurers to exploit the illiquid nature of their liabilities. However, these new asset classes will bring a number of new risk management challenges. Further, Solvency II may reduce the ability for insurers to invest in illiquid assets.
6. Enterprise Risk Management
6.1 Why ERM?
‘Enterprise risk management is a process, effected by an entity's board of directors, management and other personnel, applied in strategy setting and across the enterprise, designed to identify potential events that may affect the entity, and manage risk to be within its risk appetite, to provide reasonable assurance regarding the achievement of entity objectives.’
– Committee of Sponsoring Organisations of the Treadway Commission (2004), italics added
6.1.1 The goal of ERM (see italics above) is an ambitious one for any commercial venture. It is especially so for an insurer, given that certain categories of risk must necessarily be taken. Moreover, as we detail below, ERM for annuities is particularly difficult and complex relative to other classes of insurance business.
6.1.2 Keeping sight of the goal is, we suggest, important when designing and developing an ERM framework. ERM is not primarily an end or a goal in itself, but a means of safeguarding performance against objectives. However, an appropriate ERM framework can in itself contribute towards some types of objective, such as a target credit rating or a position relative to regulatory standards.
6.1.3 Deighton et al. (Reference Deighton, Dix, Graham and Skinner2009) have discussed the principles and practices of ERM for insurers. In this paper we explore the ERM issues specific to annuity business, while stating more general ERM points in brief where this is helpful.
6.2 The Framework
6.2.1 ERM aims to ensure that risk management is fully embedded in the business, that is to say risk is fully taken into account at all stages of managing and reporting on the business.
6.2.2 To frame the discussion, therefore, we adopt a control cycle framework for ERM with the key stages listed below. We consider each stage in turn.
(1) Define the metrics by which risk and return are to be measured.
(2) Define risk appetite and business strategy by reference to the risks associated with the business.
(3) Identify and assess all risks, applying risk mitigations and controls so that the residual risks borne comply with the risk appetite and business strategy.
(4) Use the chosen risk and return metrics in business decision-making.
(5) Monitor all risks and processes, through appropriate risk metrics, which are reported to the management and key stakeholders.
(6) Repeat the cycle taking into account observed experience and performance.
(7) Regularly review the ERM process itself, based on the experience of use and on emerging good practice, so that it remains appropriate and effective.
6.3 Risk Metrics
6.3.1 Measures of risk and return are likely to be chosen at the enterprise (group) level and, to the extent possible, should be defined consistently across all businesses within the enterprise. The metrics should also be comprehensive, in the sense that they capture the effects of all material risks, whatever may be the nature of a risk or the time scale over which a risk operates.
6.3.2 The difficulty of achieving these ideals varies according to the complexity of the enterprise and the diversity of its businesses. For example:
(1) A composite insurance group might define economic capital (EC) in a consistent way across its businesses, enabling EC to be adopted as the measure of risk. There are numerous possible measures of return including IFRS profit, economic value added (EVA), distributable cash flow, etc, and each of these may be measured over a shorter or longer time horizon.
(2) A broad-based financial group with banking, insurance, and investment operations might have diverse measures of risk, for example EC in insurance and value at risk (VaR) in banking.
6.3.3 An effective choice of metrics will have regard to:
(1) The insurer's objectives for the business. These are usually multiple, and some degree of conflict between objectives is normal.
(2) The sensitivity of metrics to management actions, in particular the extent to which risk mitigation is reflected in the measured outcomes.
6.3.4 Annuity business contains material insurance risks and material financial/market risks, which operate over a very long time scale, and with significant interaction or non-linearity between categories of risk. This combination is unusual even within insurance (although with-profits business is similarly complex).
6.3.5 No single risk metric will capture this complexity. A suite of metrics is likely to be needed, covering different time horizons, different confidence levels for stochastic models, and non-stochastic tests such as stresses and reverse stresses.
6.3.6 Where annuity business is part of a diversified insurance entity or group, the choice of risk metrics for the group can have a major impact, and potentially a distorting one, on annuity business strategy and decision making. This is equally true where metrics are specified by an external authority. For example:
(1) Metrics that operate over a short time horizon (such as 1 year) may not fully reflect the importance of risks that operate over the long term (such as longevity trend, reinvestment, or credit quality migration).
(2) Metrics that isolate asset risks from liability risks (such as some forms of economic capital) may produce unpredictable results for the aggregate risk borne.
6.3.7 Both of the above examples will affect capital requirements for annuities under Pillar I of Solvency II as currently proposed. Whether Pillar II (the ‘Own Risk and Solvency Assessment’, or ORSA) is similarly affected may depend on each company's approach to ORSA implementation.
6.4 Risk Appetite and Business Strategy
6.4.1 The risk appetite is likely to be set first at the group level. After the overall risk appetite has been defined, it must be delegated across the businesses within the group. For example:
(1) A group's capital strategy might be to preserve a financial strength rating of ‘A’ in the aftermath of a ‘one in 30’ capital market shock (this of course implies target capital in excess of A-rating capital).
(2) This capital strategy, taken together with the group's capital resources, implies a maximum risk exposure.
(3) The excess (if any) of maximum exposure over current exposure is in principle available for delegating to the business units. The group may delegate less than 100% of the unused exposure in order to retain some central flexibility.
6.4.2 Through the allocation of risk budgets to specific business units, the respective managers are tasked with effectively managing the risk exposure in line with the corporate strategy and other performance management targets. Thus the strategy adopted by a business unit should be consistent with the risk appetites delegated.
6.4.3 Risk budgets may include allowance for the interactions between risks across the business (diversification and concentration); such allowances must accurately reflect the business mix, and remain appropriate to the business being written.
6.4.4 Annuity business involves categories of risk that may not arise (or not materially) elsewhere in a diversified group, yet may interact with risks in other business units: for example, longevity risk or credit spread risk.
6.4.5 The risk budget delegated to annuity business may depend materially on how the group's ERM model allows for such interactions. In turn, the way that risk interactions are recognised and attributed may be affected by strategic considerations, as well as by evidence and judgement on the nature of the risks.
6.4.6 For example, longevity risk could be modelled as:
(1) a segment of mortality risk, independent of other mortality risks;
(2) a separate risk that is correlated or anti-correlated with other mortality risks;
(3) a direct offset against mortality risk; and/or
(4) some intermediate position between the above.
6.4.7 The most appropriate model would depend not only on technical evidence of the nature of longevity/mortality interaction, but also on the group's overall mixture of risks, its strategies and objectives.
6.4.8 Where an insurer sponsors a defined benefit (DB) pension scheme for its own employees, there may be material interaction between annuity business risk and scheme funding risk. To capture this, the DB scheme may need to be treated as a ‘pseudo business’ alongside the annuity business and other classes of business.
6.5 Risk Identification, Assessment and Management
6.5.1 The risks that could generate internal and external loss events must be identified systematically. However risk identification should not be limited to downside risks only, as opportunities or upside risk should also be included in the identification stage. Identified risks are assessed for impact and likelihood, and only then can a series of possible responses be planned.
6.5.2 Risks, both in nature and impact, will evolve over time, depending on current processes, the external environment and the effectiveness of controls. Identification, assessment and response planning should be a regular, evolving process.
6.5.3 Exogenous Risks
6.5.3.1 Annuity business is particularly exposed to exogenous risks, which do not arise from the insurer's actions, and are generally not avoidable or diversifiable. A topical list of such risks includes:
(1) Implementation of Solvency II capital requirements (see section 7 for further details).
(2) Volatility of capital markets, and interaction between different capital market risks.
(3) Fiscal policy, such as the taxation of exempt approved business, the introduction of the National Employment Savings Trust, and the requirement to annuitise (or otherwise secure) retirement benefits by age 75.
(4) Health policy, such as the allocation of priority groups for treatment, flu vaccinations (including Swine Flu) being a current example.
(5) Medical/scientific developments, such as cures for common causes of death, possible anti-ageing treatments, or procedures that delay legal death indefinitely.
(6) Anti-discrimination legislation, such as the EU Gender Directive (now incorporated into UK sex discrimination laws) and the proposed Equality Bill.
6.5.3.2 Exogenous risks often have discrete and widely different possible outcomes (‘binary’ in the jargon, although there are rarely as few as two possibilities). They also often have a long period between first identification and eventual resolution.
6.5.3.3 In such cases it may be impossible to adequately manage all possible outcomes simultaneously. Therefore, management of such risks may entail ‘taking a view’, aligning business strategy and operations with some (or just one) of the possible outcomes. Contingency plans for other possibilities may be drawn up immediately, or deferred until the likelihood of those outcomes is deemed significant enough.
6.5.4 Asset-Liability Management (ALM) Risk
6.5.4.1 The annuity provider's assessment of ALM risk will necessarily be expressed in one or more reporting frameworks. As noted in section 5.4.2 above, the choice of reporting metric has a profound effect on the risk and capital consequences of different strategies.
6.5.4.2 The ownership of ALM risk may be segmented between business functions, or even business units (where the insurer has an associated investment management company). For example:
(1) The modelling of liability cash flows is necessary, and this may introduce a basis risk between the true cash flows and the modelled cash flows – in particular a basis risk arises from the lead time of data gathering and reporting.
(2) An asset benchmark may be chosen by reference to the modelled liability cash flows, but (in the absence of complex swap transactions) it is unlikely to produce exactly matching asset cash flows, thus a further basis risk may arise.
(3) The investment manager may deliberately select assets different from the benchmark, introducing another basis risk.
(4) Credit exposure is not limited to the issuers of credit assets held, but includes exposure to capital market counterparties (such as banks and guarantors) and to reinsurers.
(5) Interactions are to be expected with other types of market risk – with insurance risk for reinsurance counterparties, and arguably with longevity risk for counterparties who themselves sponsor DB pension schemes.
6.5.4.3 In principle these basis risks are separable, but the assessment and management of ALM risk should encompass them all.
6.5.4.4 Liquidity risk arising from annuities is normally considered negligible, because annuitants do not have an option to change the timing of their benefits. This is accurate, in our view, if asset and liability cash flows are well matched, but some residual liquidity risks can arise, for example:
(1) Adverse movements in the value of collateralised instruments (e.g. derivatives, structured assets, reinsurance, longevity swaps) will result in collateral calls. This in turn could require assets to be sold, if the assets already held are not acceptable as collateral.
(2) Deferred annuities commonly offer cash commutation and transfer value options. However, the option terms are normally not guaranteed, which largely mitigates any liquidity risk.
(3) When an annuitant dies within a minimum payment period (e.g. 5 years), the outstanding guaranteed payments may be paid as a lump sum. However, the longevity surplus on early death would usually outweigh any liquidity issue.
6.5.5 Longevity Risk
6.5.5.1 In addition to the usual risk of mis-estimation due to sparse data or operational error, longevity risk has several special features:
(1) The trend of longevity in the general population. This may be seen as an exogenous and non-diversifiable risk, which the annuity provider inherently accepts, and must continually assess.
(2) Homogeneity of trends, for example between socio-economic groups, between male/female, or between the annuitised and non-annuitised populations.
(3) Uncertainty in projecting or forecasting trends.
(4) The inherent conflict of interest, already mentioned above, whereby the insurer takes on the risk of an outcome which customers are strongly motivated to have occur.
6.5.5.2 The outcome of this risk can only be measured over a long time base: it is necessary to read through the ‘white noise’ of yearly mortality data, to identify trends and other factors such as concentration of risk on high-value lives, and to assign these appropriate weights.
6.5.5.3 Possible responses to this risk include:
(1) Through sophisticated underwriting processes, a company may aim to select lives or socio-economic or other market segments groups that will pose less risk of unexpectedly increased longevity.
(2) Advanced research into observed longevity trends and drivers (for example analysis by cause of death) may enable a reduction in uncertainty.
(3) Life insurance risk may offer a partial hedge, although the effectiveness of this is a matter of debate.
(4) Longevity risk is shared with annuity holders in most forms of with-profits annuity.
(5) A secondary market for longevity risk exists, but is limited in capacity and scope compared with the primary market – this is further discussed in section 3 above.
(6) Some types of asset may be argued to mitigate longevity risk, for example equity release providers, asset managers, healthcare manufacturers/providers or holiday providers. However the correlation may be weak and/or the available assets may be small relative to annuity liabilities.
(7) Change the nature of the risk being written, e.g. by imposing an upper limit on the duration of the annuity.
6.5.6 Operational Risks
6.5.6.1 Operational risks which are particularly relevant to annuities include:
(1) The risk that beneficiaries, especially buyout scheme members and the dependants of annuitants, are not correctly identified and/or that their benefits are incorrectly calculated. In some cases, insurers have accepted beneficiary/benefit risk for a price and subject to specific underwriting.
(2) The risk that the deaths of annuitants are not detected promptly, or are concealed by dependants, leading to overpaid benefits.
6.5.6.2 The enterprise's appetite for operational risk will usually be low (excepting the cases of priced-in risk mentioned above) and control processes will need to be correspondingly tight. However the detection of data deficiencies and recent deaths is potentially very expensive, and intrusive on customers, if carried out to the maximum possible extent.
6.5.6.3 A residual risk may therefore be accepted, and controls established (such as regular searches against registered deaths) to limit the exposure.
6.6 Risk Interactions
6.6.1 Many of the principal risks have significant interactions. For example:
(1) Longevity risk interacts with interest rate risk. If an annuity portfolio experiences a divergence from expected mortality, or if the assessment of future longevity trend changes, then the expected liability cash flows will have changed, so the investment policy (particularly the duration of the asset benchmark) may no longer be appropriate.
(2) For inflation-linked liabilities, a similar interaction exists between longevity risk and inflation risk. If inflation diverges from expected, the amount of longevity risk thereby changes; conversely if expected longevity changes, the amount and duration of inflation risk thereby changes.
6.6.2 Natural hedging strategies applied to individual risk factors, such as cash flow matching, can (in principle) mitigate the impact of each individual factor down to any given level. But such strategies cannot mitigate the interactions between risks.
6.6.3 To mitigate interactions requires insight and judgement on the nature of the interactions, sophisticated risk modelling to quantify the impacts, and the availability of market instruments that are expected to perform in line with the results of risk modelling.
6.7 Risk-Based Decisions
6.7.1 Business decisions should have due regard to risks and risk appetite, and the expected and actual outcomes should be assessed in a risk-adjusted framework. The move away from rules-based capital assessment towards risk-based capital through the Individual Capital Assessment has helped to embed risk management into insurance companies in the UK, with a directly quantifiable impact on business decisions.
6.7.2 For an effective ERM process, risk-based capital should be more than a reporting exercise. ERM requires risk awareness and risk management to be fully embedded in the business decision-making process, which implies, in particular, that the risk-based capital consequences of decisions are anticipated along with the performance consequences.
6.7.3 The assumptions used within the ERM framework should be regularly updated and the risk-based capital assessment process be regularly reviewed for appropriateness.
6.7.4 With all of the risks interacting at such a fundamental level, how should an annuity company approach its organisational structure to ensure that a coherent consistent risk management process is applied across all roles?
6.7.5 Balance is required between day-to-day understanding of the individual risks, and a coherent strategy that recognises how the risks interact. Managers of key risk functions (such as longevity and ALM) require a unified message from a single risk manager (such as the CRO or MD of the business unit), who should ensure cross-area communication and interaction. A ‘silo’ approach to delegating and managing individual risks is unlikely to be effective, which can bring its own challenges in large and diversified organisations.
6.8 Risk and Performance Monitoring
6.8.1 An insurer needs to measure the performance of its managers, as to whether they are delivering suitable returns for the risks that they are undertaking. We assume that the company seeks to ensure that well-judged risks with favourable outcomes are suitably rewarded. This may be through the use of delegated authorities and linking performance targets to risk metrics such as risk capital requirements.
6.8.2 Regular risk measurements should be implemented to ensure that the metrics that are used to evaluate the impact performance management and decision-making is appropriate. Regular reporting will also help to identify emerging trends and risks that may have been overlooked. However, care should be taken to ensure that there is not an overload of information such that important data gets lost.
6.8.3 Issues arising in the measurement of risk include:
(1) What is the best way to value the risk? Should it be an internal risk-based capital assessment, or based on the value that an independent party would be prepared to pay to take on the risk? (The latter approach underlies Pillar I of Solvency II.)
(2) Valuation and assessment of the complex risks associated with an annuity portfolio will necessarily be performed through a complex modelling process. Although risk models provide an increased understanding of the nature of risks and their interactions, such as multiple events, they can pose significant risk of their own. Complex models can create new and potentially overlooked risks. The setting of parameters and implicit assumptions can, if a model is not treated with caution, lead to over-reliance on the model results.
6.8.4 Monitoring the outcomes may present relatively little challenge once the right data sources have been identified. For example, most annuity providers have good quality mortality reporting, whilst ONS and CMI studies provide some insight into longevity trends. Emerging performance can be detected with sufficient frequency and fed back into risk assessment processes.
6.8.5 The metrics for reporting on market risk need to be chosen carefully, with a view to the desired outcomes, namely that performance reporting and decision-making will be shaped appropriately. For example, market value of an asset portfolio against a benchmark is unlikely to be sufficient information: the prices of the portfolio and the benchmark may have responded differently to exogenous factors, and more fundamentally they may bear different relationships to the liabilities.
6.8.6 Risk and performance reports need to recognise and, possibly, attribute the effect of interactions between risks. This is likely to require insight, judgement and advanced modelling similar to the description above.
6.9 Cycle Repetition
6.9.1 The cyclical ERM framework needs to operate repeatedly but must not become mechanical. Risks change over time; even if last year's reporting showed risk within appetite, and business performance indicators remain as they were, fresh investigations may be needed to confirm that the risk position is still acceptable.
6.9.2 Successive ERM cycles for an annuity business should, for example, consider:
(1) The impact of emerging changes in the business and its market, and whether these are adequately modelled. Topical issues include segmentation of the pricing basis (postcode pricing), changes in the prevalence of risk selection (enhanced/impaired life/smoker terms), and emergence of alternative products (longevity swaps).
(2) The ALM outcome compared with that predicted by the model, given the actual behaviour of capital markets. Material differences may point to a need for improved modelling.
(3) The status of exogenous risks, especially those not yet addressed by management action or detailed modelling, and whether such steps are now timely.
(4) The materiality of slow-acting trends, such as population migration or climate change, which might safely be disregarded for other types of business.
6.10 Summary
6.10.1 The challenges in creating and operating comprehensive ERM for an annuity business are particularly complex (though perhaps equalled by with-profits business). This is due to the provision of long-term guarantees against insurance risk and financial risk, the interactions within and between those risk categories, and the need to consider many external sources of risk such as medical, political and social change.
6.10.2 The choice of an ERM framework is fundamental – including the dominant metrics, the time horizons over which these are studied, and the architecture of processes. It is not likely that a single ‘right’ choice exists, as it must be aligned with the insurer's commercial goals (see the quotation at the head of this section), whilst also capturing the impact of regulatory capital and reporting environments, and (where applicable) coping with a variety of risk profiles and diversification effects for different business lines.
6.10.3 The complexity of the ERM challenge is, in a sense, also the reason why actuaries and insurers need to address it. Annuity business is no longer simple (if it ever was) – this has been a recurring theme in our paper – and risk management must be appropriate to the increased complexity.
7. Solvency II
7.1 Background
7.1.1 Solvency II was initiated by the European Commission in 2000 to implement a new supervisory and solvency framework for the European insurance industry. The directive was adopted by the European Parliament in April 2009 and is expected to be in force in late 2012.
7.1.2 Most of the implementing measures of Solvency II are still open to discussion between CEIOPS, the European Commission, and the insurance industry. We analyse the development of Solvency II as things stood by January 2010.
7.1.3 This section contains many technical details of Solvency II in relation to annuity risk management. Most of the quantitative content can be skipped without loss of continuity. Nevertheless, the senior management of an insurance company are expected to have a good understanding of the rationale underlying either the standard formula or internal model, in order to demonstrate a solid governance and risk management system, as stated by CEIOPS (2009).
7.1.4 The first part of this section discusses the Solvency II technical provisions for annuity liabilities, with a focus on the determination of the risk-free discount curve and particularly the illiquidity premium, which has stimulated much debate.
7.1.5 In the second part, the Solvency Capital Requirement (SCR) standard formula analysis aims to raise awareness of model control and proper understanding of the risk factors, as the risk metrics derived from a company's own risk assessment will have a deep impact on all areas of annuity management, including product design, longevity underwriting, investment strategy and financial management.
7.2 Technical Provisions – Overview
7.2.1 Hedgeable insurance obligations can be ‘easily’ calculated as the market price of the hedging positions from a deep, liquid and transparent financial market. Otherwise, the technical provisions under the Solvency II requirement are the sum of the best estimate and the risk margin.
7.2.2 Best Estimates
7.2.2.1 In the current UK annuity business practice, the ‘best estimate’ is often interpreted as discounting the expected future cash flows, based on the ‘average’ point estimates of future mortality, benefit escalations, ongoing expenses, etc. Under the Solvency II framework, the best estimate is defined as the probability-weighted average of future cash flows, in line with the recent developments in International Accounting Standards (such as IAS37 amendments, and policyholder behaviour measurement).
7.2.2.2 The probability-weighted approach suggests that an insurer has to consider a wide range of possible future events: for example, a 25% reduction in mortality rates may have a small probability of occurrence but a large impact on the cash flows. However, the assumptions chosen to project the best estimated cash flows should be set in a realistic manner, whereas the prudent allowance for data uncertainty and model error should be taken into account in the risk margin calculation.
7.2.2.3 Following the comments received on CP39, CEIOPS stated in its final Level 2 advice that the best estimate should be calculated as the average of the discounted cash flows, not the discounted average of probability weighted cash flows. For annuity business, the two methods can produce different results, for example if the benefit escalation rate is highly correlated with the interest rate.
7.2.2.4 CP76 describes a three-step process for proportionality assessment, where the nature and complexity of risks need to be assessed. For a typical annuity product, longevity risk is the foremost risk factor. Proportional to the longevity risk, an insurer can use the baseline mortality table, adjusted by future improvements based on a model such as CMI's. (Appendix A illustrates that average point estimation is a suitable proxy for stochastic mortality projections.)
7.2.2.5 The best estimate can be calculated by grouping homogeneous policies into suitable model points, provided that the grouping does not misrepresent the underlying risks and does not significantly misstate the costs. Although an annuity insurer may choose to project the cash flows on a policy by policy basis, it is most likely that the assumptions are still determined by reference to a group of policies (for example by the same gender, age, smoking status, socio-economic class). Solvency II has set out requirements to choose assumptions that can adequately reflect the cash flow uncertainties.
7.2.2.6 By and large, the validation and documentation process is very onerous, applicable to all relevant and material models, assumptions, data verification, and experience analysis. In addition, the validation is required to be carried out at least once a year, and upon any substantial change.
7.2.2.7 In conclusion, although many companies have already adopted the same principles in calculating their technical provisions, many may struggle, initially and on an ongoing basis, to comply with the requirements of the validation process.
7.2.3 The Impact of ‘Risk-Free’ Discounting
7.2.3.1 The most fundamental impact of Solvency II on annuities is the likely full or partial move to a ‘risk-free’ rate of valuation for technical provisions, in contrast to the position under Pillar I where a substantial illiquidity premium can be taken into account.
7.2.3.2 If no illiquidity premium is allowed in the risk-free rates, or the illiquidity premium allowance is small, the technical provisions for annuities will be materially increased since the business has a very long duration. Moreover, the annuity business balance sheet will become more volatile, because any change in credit spreads will affect the assets but not the liabilities. We discuss technical and practical aspects of this issue in the following sections.
7.3 Inflation Assumptions
7.3.1 There should not be any ambiguity in annuity indexation (often linked to an inflation index) as it is specified in the contract. Expense inflation assumptions, nevertheless, can be more subjective, because expense inflation is sensitive (but not equal) to future price and/or wage inflations.
7.3.2 In the QIS4 context, the underlying inflation assumptions are required to be consistent with implied inflation from the financial markets. Sterling index-linked gilts are linked to the RPI, in contrast with the European harmonised Consumer Price Index (CPI). According to the QIS4 principle, a UK annuity insurer may choose to base its inflation assumptions on the RPI basis, which will be different to its European peers. The insurer will also need to validate that the inflation assumptions ‘adequately reflect the uncertainty underlying the cash flows’ (CP39, paragraph 3.26).
7.3.3 Future inflation assumptions can be determined as:
(1) Long-term inflation consensus: Often expressed as a flat rate of future inflation (not market consistent and therefore not discussed here).
(2) Gilts-based implied inflation: Available from the Bank of England website as the difference between nominal and real gilts yields.
(3) Swap-based break-even inflation: Referred to in QIS4 as ‘the market prices of relevant financial instruments, for example inflation proofed swaps’; see also Hurd & Relleen (Reference Hurd and Relleen2006).
7.3.4 In the UK, there has been an over-demand for index-linked gilts from pension funds and life offices, and market-making banks have to warehouse large volumes of bonds. After the Lehman collapse, balance sheet concerns forced those banks to offload low-returning gilts. By contrast, inflation swaps are less prone to balance sheet distortion and funding issues. The differences in the two markets explained why the swap-bond basis has opened up since September 2008 and gradually reverted towards the pre-crisis level since October 2009, as shown in Figure 10. The wide basis also suggests that choosing an appropriate benchmark is important for an annuity insurer to determine the inflation assumptions, particularly during crisis periods.
10-Year Swap Over Bond B/E Basis. Source: Deutsche Bank, Bank of England.

7.3.5 Index-Linked Gilts
7.3.5.1 Like the nominal bonds, index-linked gilts are exposed to market supply and demand distortion (see McGrath & Windle, Reference McGrath and Windle2006). Excessive extrapolations are required due to the limited supply of very long-dated index-linked gilts.
7.3.5.2 The published Bank of England implied inflation curve is derived from a simplified model which makes assumptions on inflation risk premium and the convexity adjustment for the yield curves. Deacon & Derry (Reference Deacon and Derry1994) estimated that the model probably over-states the ‘true’ inflation expectation to some extent.
7.3.5.3 Nevertheless, because the present values of annuity payments and expenses are exposed to real rate risks and not only inflation risks, the optimal matching assets to the liabilities must be index-linked gilts. To date, many annuity writers still prefer to use the Bank of England implied inflation curve when setting up their inflation assumptions.
7.3.6 Inflation Swaps
7.3.6.1 Market-consistent inflation expectation, in isolation from nominal rates, is probably better defined in the inflation swap market, because the zero-coupon break-even rate is the ‘pure’ form of n-year forward expected inflation. The swap market also provides longer maturities of inflation rates than the gilts market.
7.3.6.2 Since the FSA now favours the ‘swap minus’ method in discounting sterling liabilities, inflation assumptions derived from the swap market may serve the purpose better, whereas the implied inflation will introduce excessive noise due to the swap-bond basis.
7.3.6.3 There are, however, practical issues for using the break-even inflation rates: data availability, counterparty concerns, and liquidity issues. Overall, the sterling inflation swap market is even smaller than the index-linked gilts market, and its supply is dominated by a few banks.
7.4 Risk-Free Discounting
‘To think about the distant future in terms of standard discounting is to have an uneasy intuitive feeling that something is wrong, somewhere.’
– Martin L. Weitzman, American economist
7.4.1 Under the market-consistent principle, if a portfolio of financial instruments perfectly replicates the annuity cash flows regardless of market movements or credit events, the market price of such a replicating portfolio is the best-estimate technical provisions for the annuity book. So far CEIOPS has been very rigorous in interpreting the ‘risk-free interest rate’ context in Article 86 of the Level 1 text.
7.4.2 Much controversy has arisen in the UK over which replicating portfolio is applicable to the annuity business:
(1) government bonds;
(2) high-quality non-government bonds;
(3) interest rate swaps; or
(4) corporate bonds with default protection.
7.4.3 Government Bonds
7.4.3.1 Even AAA-rated bonds issued by national governments can bear credit risk: CEIOPS recommended the European Central Bank (ECB) yield curve as the Euro risk-free term structure, since the ECB curve is not linked to any single government. CEIOPS asserts that only AAA-rated sovereign bonds can be considered risk-free: this is far more prudent than the Basel II standardised approach, which assigns zero risk weight to AAA to AA- sovereign debts and to bonds issued by some supranational organisations.
7.4.3.2 For sterling denominated liabilities, the FSA argued to CEIOPS that the gilts do not meet all the desired characteristics for a risk-free financial instrument, mainly due to technical bias caused by the over-demand for long-dated gilts.
7.4.4 High-Quality Non-Government Bonds
7.4.4.1 In its feedback to CP 40, the CEA commented that ‘… the defined risk-free term structure … may also be derived from other asset markets such as mortgage bonds or high quality corporate bonds’.
7.4.4.2 In some European countries, insurance companies hold sizeable covered bonds to back insurance liabilities. For instance, in Denmark (the second largest European covered bond market), more than a quarter of the bonds are held by local insurers and pension funds. In October 2008, the Danish government reached a stability agreement with the Danish Insurance Association, whereby the mortgage bond spread is temporarily allowed in the discount rate applied to the technical provisions calculation, until the end of 2009. It is estimated that this regulatory relaxation reduced the technical provisions by around DKK 60bn, or roughly £10bn.
7.4.4.3 Covered bonds are considered ‘super-safe’ because their investors have a senior claim to both the bond issuer and the cover pool of mortgages. The issuer also has the ongoing obligation to maintain sufficient assets in the cover pool. The Committee of European Banking Supervisors (2009) has proposed that European banks hold core assets including cash and high-quality government and covered bonds to guard against a short-term liquidity stress.
7.4.4.4 Despite the dual-recourse protection, covered bonds are not completely immune from default risk. Taking Northern Rock as an example, although the Covered Bond Guarantor SPV guarantees to assign high-quality new mortgages to replace the non-performing ones, it is now questionable whether these new collaterals can be sustained, given the bank's difficulty in writing new mortgage business (particularly after the bonds end up in the asset management arm, although the government is still providing guarantees). Due to the turmoil in the global property market, Standard & Poor's (2009) has recently changed its rating methodology for covered bonds and put more than half of Europe's covered bond programmes under credit watch. It is expected that more of these bonds will be assigned AA rating to reflect the methodology changes.
7.4.4.5 Since CEIOPS is putting a strong emphasis on the credit risk criterion, we consider that mortgage bonds are unlikely to be treated as ‘risk-free’ under the current Solvency II framework.
7.4.4.6 In addition, most covered bonds are short to medium dated (average maturities of newly placed covered bonds since 2006 are less than ten years, although more long-dated bonds have been issued since 2009), thus it is difficult for them to meet the desired characteristic of ‘highly liquid for all maturities’ as set out in CP40.
7.4.5 Interest Rate Swaps
7.4.5.1 Interest rate swaps are widely used by annuity writers for asset-liability management, and the CEA is supportive of using the swap curve as the ‘typical’ risk-free term structure. The FSA also proposed to use the swap curve less a credit risk adjustment as the risk-free term structure for sterling liabilities, due to technical factors in the gilts market, although the following two practical problems still emerge:
7.4.5.2 Swap rates are not freely available and hence an external body needs to collect data from investment banks and inter-dealer brokers.
7.4.5.3 A ‘clear and simple’ method to derive the credit risk adjustment is open for further discussion, but the FSA suggests moving half-way between the gilts and the swap curve. The FSA suggested method is based on the Swedish insurance solvency test, known as the ‘Traffic Light System’ (see Blåvarg et al., Reference Blåvarg, Flodén and Höller2006). Although simple and easy to implement in practice, this method does not seem to meet all the desired characteristics for an ideal risk-free term structure:
(1) Realism: The UK rates market has been distorted for some time, in that longer-dated swap rates are below the corresponding gilt yields. With long-duration liabilities, an annuity writer would need to earn ‘LIBOR plus’ rates in a risk-free manner, to achieve the average of bond and swap yields.
(2) No technical biases: At longer durations, the credit risk adjustment is subject to a certain degree of technicality, due to government bond price distortions. In the Traffic Light System, the adjustment beyond the longest duration of government bonds is specified as half the average rate difference between swaps and the three longest government bonds.
(3) No credit risk: Some academic papers discuss the decomposition of swap spread into credit risk premium and other components. For example, Liu et al. (Reference Liu, Longstaff and Mandell2006) studied US dollar swap rates from 1988 to 2002, and found that the credit risk premium is not persistent and positively skewed.
7.4.5.4 Figure 11 shows the spread of 3-month sterling LIBOR over the 3-month OIS, from July 2007 (start of the sub-prime crisis) to June 2009. (The sterling OIS is the SONIA-based overnight indexed swap which is an important measure of credit and liquidity risks in the money market.) Historically the LIBOR-OIS spread was relatively stable at around 10 basis points. The graph seems to question whether there exists a ‘clear and simple’ method to derive the credit risk adjustment.
3M LIBOR – OIS Spread. Source: Deutsche Bank.

7.4.5.5 In their feedback to CP40, some organisations also observed that financial options are often priced based on the swap curves and hence swap rates are market consistent risk-free rates. CEIOPS dismissed the proposal with a comment that options are not valued on a risk-free basis.
7.4.6 Corporate Bonds with Default Protection
7.4.6.1 Corporate bonds are not free of credit risk. However, they have appealed to UK annuity writers for many years, partly because they provided persistently attractive returns over gilts (this is known as the ‘credit spread puzzle’) – in the sense that observed credit spreads are much higher than average historical default rates (see Fulcher, Reference Fulcher2007). In particular, because annuity liabilities are illiquid, it is believed that a sizeable illiquidity premium can be earned and added to the discount rates.
7.5 Illiquidity Premium
7.5.1 Only two members of CEIOPS are supportive of the illiquidity premium add-on to the discount rates. As a compromise, CEIOPS extended the discussion in Annex B of its response to comments received following CP40, and suggested that illiquidity premium could be allowed for in discounting annuity cash flows, subject to the following restrictions:
(1) Existing business on the date when Solvency II comes into force: This is based on the rationale that existing policyholders may expect some extra return because they do not have the option to cancel the contract. However, it is arguable, for some pension savings products with annuitisation options, that in-force policyholders may have similar expectations regarding their vesting annuities.
(2) Retirement annuities: It is not clear whether this applies to the second life annuity if the first life had retired and died. However, immediate needs annuities would certainly not be qualified.
(3) The only underwriting risks are longevity and expense: Apparently this would exclude annuities which provide death benefits (exposed to mortality risk), or those with significant data risk (mainly relevant for bulk annuities).
(4) No discretionary benefits: With-profits and some variable annuities would be excluded.
(5) Currency matching: The same-currency denomination restriction seems to be very rigid, given that investments in foreign currency bonds with FX hedging can provide the same currency matching.
(6) Adequate ALM with ‘the highest part’ of the technical provisions invested in corporate bonds: Ironically, the most accurate matching between asset and liability cash flows would be achieved through interest rate swaps, not corporate bonds. Insurance companies investing heavily in structured products and mortgages to back their annuity liabilities may need to consider switching into corporate bonds.
(7) One single value: For sterling denominated annuities, the illiquidity premium should be a single value calculated at least quarterly by a European institution, although it is unclear whether different illiquidity premiums by duration are allowed. The calibration process would be different from the current UK practice where illiquidity premium varies by credit rating. The partial spread between the highest-quality bonds and the gilts is not likely to be large.
7.5.2 Further to these restrictions, CEIOPS also suggested that no diversification between the risks relating to liquid and illiquid obligations should be taken into account in the calculation of the SCR standard formula. For some insurance companies with a sizeable annuity book, this could have a bigger impact as the annuity SCR would become an add-on to the aggregate SCR, whereas the technical provisions may only be marginally reduced if the illiquidity premium is small.
7.5.3 In November 2009, the European Commission (2009) responded to CEIOPS’ advice on the liquidity premium, and asked CEIOPS to lead a task force with a mandate to develop technical solutions on the issues of illiquidity premium, risk-free rates, and curve extrapolation. Subsequently, CFO Forum and CRO Forum submitted two proposals to the task force (see 7.6.4.8 below and CRO Forum (2009)), and it is expected that much debate will follow on these issues.
7.6 Measuring the illiquidity premium
7.6.1 Given that market liquidity is difficult to measure, in the UK illiquidity premium is often derived as a residual term from the credit spread, after deducting the credit premium as a compensation for future defaults. So far at least three methods have been developed by the insurance industry to estimate the future defaults.
7.6.2 Historical default analysis
7.6.2.1 In line with INSPRU 3.1.43, this method estimates the expected default rate by reference to the historical default rates and recovery rates by different rating categories. The unexpected default allowance, on the other hand, is rather arbitrarily chosen, for example as:
(1) a multiplier of the expected default risk premium;
(2) the x th percentile derived from the historical analysis;
(3) a percentage of recent market spread movement;
(4) a multiplier of the default risk premium during a past crisis period; or
(5) a combination of the above.
7.6.2.2 Generally speaking, such methods are not market-consistent. Given the high technical standards of Solvency II, the methods are also less convincing from practical perspectives:
(1) The use of average historical defaults, despite the long time horizon, fails to capture the distinctive feature of the corporate bond market where defaults tend to cluster during crisis periods. At the same time, default losses, in both individual and aggregate terms, are also much more severe. Moreover, credit spreads may include a significant premium for the risk of more extreme defaults than observed in any historical period, typically referred to as the ‘peso effect’: see Muir et al. (Reference Muir, Chase, Coleman, Cooper, Finkelstein, Fulcher, Harvey, Pereira, Shamash and Wilkins2007).
(2) Historical data from rating agencies are not entirely reliable. During a crisis period, rating agencies’ responses may lag market developments. Rating methodology has evolved over time and past ratings may not be consistent with current ratings.
7.6.3 Default Predicted by a Structural Model
7.6.3.1 The FSA referred to the Bank of England model as a useful framework to address the default risk allowance. The Bank of England model, based on a series of working papers and quarterly bulletin researches, uses a structural model to decompose sterling credit spreads. Under the structural model framework, first introduced by Merton (Reference Merton1974), equities of a company are simultaneously treated as a put option on the underlying asset. The default probability is therefore the probability that such a put option is in the money at a strike equal to the face value of all outstanding debts.
7.6.3.2 Strictly speaking, the structural model may not be completely market-consistent, because such a model often requires extensive calibration in which some parameters are not directly observable in the market, for example debt recovery rates and long-term implied volatilities. However, it has been widely used as a standard model for capital structure arbitrageurs, who try to exploit price inefficiency between equities, bonds, and credit derivatives.
7.6.3.3 Despite their many variations, most structural models predict a credit spread much lower than the market observed spread, thus suggesting that at least part of the credit spread puzzle is caused by an illiquidity premium. Interestingly, the Leland and Toft model chosen in the Bank of England study is an exception, which often overestimates the credit risk, particularly on very short-dated bonds (largely because of its simplifying assumptions about continuous coupon payments).
7.6.3.4 The major problem with a structural model is that it employs too many parameters, some of which are correlated, such as asset volatilities and leverage ratios. Some academic studies have found that the structural models have substantial prediction errors (see for example Huang & Huang, Reference Huang and Huang2003; Eom et al., Reference Eom, Helwege and Huang2004). Therefore, it is not appropriate to classify all of the residual term from the structural model as the illiquidity premium.
7.6.4 Market Implied Default
7.6.4.1 In theory, basis trades provides a truly market-consistent way to derive the illiquidity premium. The rationale for the basis trades is as follows: by holding both a bond and the CDS of the same maturity, the investor is immunised from default risk. The basis is computed as the difference between the bond credit spread and the CDS spread, either positive (bond spread < CDS spread) or negative (bond spread > CDS spread), the latter often interpreted by some annuity insurers as illiquidity premium.
7.6.4.2 There are a few caveats in relation to the basis trade method:
(1) Currency basis: Sterling bond investors may only hedge the default risk by holding euro or dollar denominated CDSs.
(2) Maturity basis: The majority of CDS contracts are less than 10 years and the most liquid CDSs are of 5-year maturity, whereas annuity insurers tend to hold much longer bonds to match their liabilities.
(3) Seniority basis: No CDS provides default protection to junior subordinated bonds (Tier 1 and Upper Tier 2).
(4) Accrued interest basis: In the event of default between two coupon dates, the bond does not pay accrued interest whereas the CDS buyer must pay.
(5) Settlement basis: In the event of default the CDS buyer can deliver a different bond (cheapest to deliver).
(6) Recovery basis: For example in the Delphi default case, 11 out of 12 CDS sellers chose the cash settlement, leaving the CDS buyers holding $37 in cash and defaulted bonds then worth $64 per $100 face, but later gradually falling by more than 50% in price.
7.6.4.3 Given these caveats, it is doubtful whether the negative basis analysis can be applied to bond index vs. CDS index, if the underlying asset pools are not entirely the same.
7.6.4.4 Even at the individual bond level, the basis trade may not give the correct picture of the illiquidity premium. Historically, many CDS bond bases were positive because of the difficulty in shorting corporate bonds:
(1) It is expensive to execute a credit repo, if not completely impossible, making buying CDS protection more convenient than shorting credit;
(2) The maturity of the repo market is much shorter than the bond maturity, thus requiring periodic rollovers of short credit positions. The CDS spread must reflect the excessive risk premium for the rollover uncertainty.
7.6.4.5 The negative basis, on the other hand, signals the growing funding pressure during the financial crisis (and hence often referred to as ‘funding spread’):
(1) Repo counterparties charge a haircut on corporate bond collateral, requiring the investor to fund the difference using cash.
(2) Selling CDS protection requires less upfront cost, compared with purchasing cash bonds.
7.6.4.6 Other factors, such as market activity in bond issuance and loan syndication (as underwriters often pre-position themselves in the CDS market to hedge the impending) and counterparty risk (see for example Georgescu & Popescu, Reference Georgescu and Popescu2009), also contribute to the CDS-bond basis. With the recovery of the credit market, the large negative basis persistent during 2008 and 2009 has now been narrowing toward parity, as shown in Figure 12.
Bond spreads compared to CDS spreads in 2008 and 2009. Source: Deutsche Bank Global Markets Research.

7.6.4.7 There is sufficient information to support the existence of an illiquidity premium in the financial market. However, Solvency II requires that the illiquidity premium is derived ‘in a prudent, reliable and objective way’, which is a general principle for the technical provisions calculation. To date, none of the three methods mentioned above (i.e. historical default analysis, default predicted by a structural model, and market implied default) can definitively meet these criteria.
7.6.4.8 In a joint working paper, the European Insurance CFO Forum and the CRO Forum (2009) proposed that a combination of various methods could provide sufficiently clear evidence to estimate the illiquidity premium. The outcome of this proposal is still unknown at the time of writing.
7.7 Risk Margin
7.7.1 The risk margin is calculated as the cost of financing an amount of ‘eligible own funds’ equal to the ongoing solvency margin sufficient to support the run-off the business: this is termed the ‘cost of capital’ approach. Subject to a proportionality assessment, a four-hierarchy decision-making approach can be used for projecting future SCRs.
7.7.2 The cost of capital approach, as adopted in the Level 1 Directives, implies that an insurer should be capable of hedging all its hedgeable liabilities in the aftermath of a ‘one in 200’ shock during the first year. This is rather unfriendly to an annuity writer, compared with, for example, a run-off approach where the insurer is assumed to retain its original investment strategy.
7.7.3 Unlike the MCEV Principles which permit a bottom-up cost of capital approach, Solvency II specifies a top-down cost of capital currently proposed at 6% per annum, regardless of the business line or the underlying risk drivers.
7.7.4 For annuity business, the future SCR projection should cover the following risks that are deemed to be unhedgeable:
(1) underwriting risk, including longevity and servicing expenses;
(2) counterparty risk, if the insurer uses reinsurance or purchases derivatives;
(3) operational risk; and
(4) unavoidable market risk.
7.7.5 If the standard formula is used for the SCR projection, a 25% immediate reduction in mortality will be implemented in each subsequent year. For a closed annuity book, as the business runs off, the average age profile of the policyholders should increase and ultimately 25% reduction will likely be overly prudent.
7.7.6 The unavoidable market risk was not addressed in QIS4 but was proposed by CEIOPS in CP42, following study by the CRO Forum (2008). It seems that matching long-dated annuity cash flows is regarded as an ‘unavoidable market risk’ and, as a consequence, any annuity written for younger ages will require extra capital support.
7.8 SCR Standard Formula – Market Risks
‘Acceptance of prevailing standards often means we have no standards of our own.’
– Jean Toomer, American poet
7.8.1 The standard formulae define the SCR a company needs to hold, unless it decides to use an internal model. They are calibrated to reflect the risk profile of most insurance and reinsurance undertakings, according to the adopted Level 1 text. In this and the following section we discuss the standard formulae requirements for market risks and other risks, respectively. Insurers will also be required (whether they use a standard or internal model) to perform an ORSA, which would be expected to pick up risks not covered by the standard formula.
7.8.2 Interest Rate
7.8.2.1 Interest immunisation is probably always the first ALM goal for an annuity insurer. The interest rate stress test thus provides a benchmark on the effectiveness of the ALM.
7.8.2.2 The standard module is defined as relative changes on the base term structure by different duration buckets, which will cause a few practical problems under current market circumstances:
(1) Unless the standard formula can be calibrated frequently, relative changes will lead to weaker stresses when the yield curve is at a lower level.
(2) Many UK annuity writers have already experienced the same problem when reporting their 2009 ICA results. In the current market condition where interest rates are at a historically low level, it is expected that the upward stresses may be more severe than proposed in CP70.
(3) Relative changes cannot generate negative interest rate scenarios if the current yield curve is positive.
7.8.2.3 CP70 has acknowledged the weakness of relative stress testing, and hence introduced the 1% minimum downward stress. Notwithstanding, the stressed interest rates are still floored at 0%.
7.8.2.4 In August 2009, the Swedish central bank introduced negative interest rate on bank deposits; the Bank of England also hinted that it may follow the Swedish example, if quantitative easing fails to stimulate sufficient money flow into the economy. It is difficult to rule out negative interest rates (at least at the short to medium end of the curve) as a ‘one in 200’ event.
7.8.2.5 The weaknesses of the relative change method can be overcome in the internal model (for example by using the normal/lognormal blend model or the regime-switching model), while the standard formula could consider two different sets of stresses, one applicable to low rate environments and the other to high rate environments. Alternatively, scenario testing based on macro-economic analysis can be applied to supplement the stress testing, for example to assess the possible outcome of the withdrawal of quantitative easing.
7.8.2.6 The standard module in CP70 only gives two stress scenarios, each representing a combination of the four yield curve changes (level, slope, curvature and twist). Many UK annuity insurers, in their ICA reporting, will tend to use more scenarios, each representing a single change in the yield curve.
7.8.3 Credit Spreads
7.8.3.1 Many UK annuity insurers have reported credit spread risk as the most significant ICA market risk (although some classify it as ‘credit risk’), particularly for those who have implemented ALM measures such as duration matching.
7.8.3.2 Unlike some UK ICA practice, migration and default risks are not explicitly included in the Solvency II spread risk module. Under current market conditions, unless the credit content of the portfolio is rebalanced frequently, the module may under-estimate the spread risk as some bonds can be downgraded very quickly from high-quality to junk within the one-year SCR horizon. In its latest consultation paper, the Basel Committee (2008) has proposed an Incremental Risk Charge (IRC) to capture credit migration risk, which is defined as ‘potential for direct loss due to an internal/external rating downgrade or upgrade as well as the potential for indirect losses that may arise from a credit migration event.’
7.8.3.3 In order to avoid excessive complexity, CP70 identifies three different asset classes to which the spread risk sub-module applies: bonds, structured products (tranched products in particular), and credit derivatives.
Bonds
(1) No capital charge is applicable to sovereign bonds issued by any OECD or EEA countries in domestic currencies.
(2) For other bonds, the charge depends on credit rating and duration. As discussed before, over-reliance on credit ratings given by the rating agencies may lead to scenario or stress testing results that are inconsistent with the market development. Seniority and sector factors can be more important than credit ratings: for example, sterling financial sub-debt spreads have been extremely volatile since 2008 even measured relative to non-financial spreads as illustrated in Figure 13. Although CP70 recognises that financial bonds tend to have more volatile spreads, the standard formula proposed does not distinguish between financial and other sectors.
Figure 13Credit Spread. Source: iBoxx, Deutsche Bank.
(3) The new proposed stresses are more onerous than the QIS4 stresses, but broadly in line with current ICA practice (see section 4.5.3.2 above), although some insurers expect to reduce their ICA spread stresses once the credit market ‘normalises’.

Structured products
(1) CP70 has adopted a new standard formula to determine the SCR for structured products. In this new formula, the solvency capital is calculated as the default loss percentage with respect to the tranche thickness.
(2) CEIOPS holds the opinion that inaccurate ratings assigned to structured products were one of the reasons for the current financial crisis, and so CP70 proposes to use the weighted average rating of the underlying asset pool. However, this can potentially cause inconsistency between different products, or between structured products and bonds. For example, consider two structured products with the same duration, attachment and detachment. If one has 100 AA underlying names and the other has only 10 AA underlying names, the former is much less risky than the latter. Nevertheless, under the current proposals the two products would have the same SCR.
(3) Although CP70 proposes to stress-test bonds and structured products very differently, in reality many high-quality structured securities are not particularly more risky than the bonds of the same ratings, as illustrated in Figure 14.
Figure 14Credit Spread. Source: iBoxx, Deutsche Bank.
(4) It seems that investments in senior tranches pooled on well-diversified high-quality assets may be overly penalised in SCR under CP70, due to the 10% minimum value at risk which lacks any supporting evidence.

Credit derivatives
(1) CP70 has taken a rather unfriendly view on credit derivatives, by requiring a capital charge determined by the more onerous of spread widening and spread narrowing scenarios, both of which are stronger than QIS4 levels.
(2) Unless an insurer can demonstrate that its CDS holdings are recognised as effective risk mitigation of its bond portfolio (see 7.10 below), the company will be penalised in capital because it will have to apply a bond spread widening and simultaneously a CDS spread narrowing scenario in its SCR calculation.
(3) This very prudent treatment of bond vs. CDS basis probably suggests that the risk-free term structure derived from the macro-level negative basis (i.e. pooled bonds vs. index CDS) is less likely to appeal to CEIOPS.
7.9 SCR Standard Formula – Non-Market Risks
7.9.1 Longevity
7.9.1.1 Longevity risk, or a reduction in future mortality rates, is probably the most significant risk for UK annuity insurers in their ICA reports.
7.9.1.2 Following earlier working papers by the CMI and the call from the Board for Actuarial Standards, most UK annuity writers distinguish the baseline mortality assumption and the mortality improvement assumption under both Pillar I and Pillar II reporting.
7.9.1.3 By contrast, although CP49 acknowledges that longevity risk should reflect the uncertainties in the level, trend and volatility of mortality rates, the standard module of a 25% immediate reduction in the baseline mortality rates is inconsistent with this principle. Moreover, the calibration process to derive the 25% stress looks inappropriate for the UK annuity industry.
7.9.1.4 In its historic improvement analysis, CP49 calculated the mortality improvements for England and Wales population from 1992 to 2006. The cumulative improvements for a normal annuitant are close to or more than the 25% suggested stress. However, the analysis did not take into account the improvement factors that a UK annuity insurer now invariably builds into its projection model. If for example the CMI's Medium Cohort projection is used, the table will look significantly different (see Table 8).
Mortality improvements for England and Wales from 1992 to 2006.

Source: CEIOPS, CMI, Deutsche Bank.
7.9.1.5 The 25% immediate shock is derived by assuming zero expected improvement in future mortality; even so, CEIOPS commented that the 25% should apply to a best estimate mortality table which includes improvement factors. As pointed out by the ABI, there will not be a level playing field if other countries exclude improvement factors in the technical provisions calculation. The issue is likely to be dealt with in Level 3 guidance.
7.9.2 Counterparty Default
7.9.2.1 This section only discusses the ‘type 1’ counterparty exposures as defined in CP28.
7.9.2.2 The final advice from CEIOPS proposes a reinsurance recovery rate of 50%, based on a recent Moody's report and a GIRO working paper.
7.9.2.3 According to current UK regulations, reinsurance creditors are junior to preferential creditors and direct insurance creditors. However, for commercial reasons it is common for reinsurance companies to grant a floating charge to the cedant, in effect making the cedant equal priority with direct insurance creditors, and thus senior to any senior unsecured bondholders. Therefore, a recovery study based on bond or CDS market information, such as the Moody's report, may underestimate the recovery rate from a reinsurance contract that features such a charge. On the other hand, the GIRO working paper seems to use the 50% recovery as a ‘working assumption’ rather than a ‘best practice’.
7.9.2.4 In contrast, a recent ASTIN presentation has made the recovery assumptions illustrated in Table 9, derived from another GIRO working paper. Those for high quality (AA- and above) reinsurance companies can be significantly higher than 50%.
Assumed recovery rates from a reinsurance company.

Source: Britt & Krvavych (Reference Britt and Krvavych2009), Bulmer et al. (2006).
7.9.2.5 For some (re)insurance groups, reinsurance business is written by an operating company, whereas the corporate bonds are issued by its holding company. It is often possible, for example in the Washington Mutual case, that the operating company survives to meet its obligations while the holding company defaults. This ‘holdco vs. opco basis’ represents another situation where bond/CDS market information may underestimate the actual reinsurance recovery.
7.9.2.6 An insurer often benefits from solvency capital relief by ceding its insurance obligations to a reinsurance undertaking. According to CP51, the cedant needs to hold capital for the unrecoverable liabilities upon default of the reinsurer. Nevertheless, the insurer may prefer to replace the defaulted reinsurer, if the replacement cost is cheaper than the cost of holding own capital.
7.9.3 Collateral
7.9.3.1 The adopted Level 1 text explicitly specifies that ‘insurance and reinsurance undertakings shall take account of the time difference between recoveries and direct payments.’ In contrast, Level 1 text does not clearly identifies the mark-to-market mechanism of collateralisation.
7.9.3.2 In practice, collaterals are actively managed to mitigate the counterparty default risk. For instance, the cedant could require over-collateralisation if the reinsurer is downgraded. The final advice proposes the market-to-market adjustment of collateral as follows:

Risk factor
(1) The risk factor can be either 100% or 80%, depending on the counterparty risk of the custodian. In the UK, collateral assets are usually segregated and hence the beneficiary insurer can claim that they are insolvency-remote and apply the 100% risk factor.
(2) Nevertheless, default of the custodian or a lead custodian is possible, and dispute is then likely, particularly if the relevant Credit Support Annex (CSA) is governed in a foreign jurisdiction. One example is the re-hypothecation rights permitted in the CSA governed by New York law, where the collateral taker can transfer the collateral to a third party to cover its own exposures under a different CSA. In the Lehman Brothers case, some investors were exposed to such a risk.
(3) Insurers are therefore incentivised to choose a trustworthy custodian and carefully drafted agreements, in order to qualify for the 100% risk factor.
Adjustment for market risk
(1) Collateral market risk is often termed as ‘daylight risk’, which measures the mark-to-market movement in collateral exposure accompanied by a default, prior to the delivery of collateral. The daylight risk covers a time interval between two collateral valuation dates, as well as the grace period between the collateral notice and the delivery of assets.
(2) The final advice refers to the market risk standard module to calculate the collateral mark-to-market adjustment, implying a daylight risk over the 1-year SCR period. It is not yet clear whether an insurer can use its internal model to scale down the market risk adjustment, if it takes proper actions to mitigate its daylight risks, such as more frequent collateral valuations, or a shortened grace period.
7.10 Risk Mitigation Structures
7.10.1 As noted in section 3 above, some investment banks have offered ‘capital market solutions’ to longevity risks, such as longevity bonds, mortality forwards, or synthetic longevity indices. It is not yet clear from the current Level 2 draft whether these products will be classified as ‘financial mitigations’. However, both the Level 1 adopted text and CEIOPS’ response to the CP31 feedback suggests that these risk mitigation solutions will be covered by the same principle. If so, an annuity insurer may have less incentive to hold these instruments to hedge their longevity risks, because the implication for a SCR charge on ‘material’ basis risk is very onerous.
7.10.2 Unlike longevity reinsurance, market risk hedges are definite ‘financial mitigations’. Some common practice in the UK annuity industry will be seriously challenged under the current Solvency II framework:
(1) Hedging interest rate risks with bonds, if the discount term structure is based on swaps;
(2) Hedging inflation risks with index-linked bonds, if the expected inflation is derived from swap break-even rates.
7.10.3 Since CP31 and its corresponding final advice are only applicable to standard formula, insurers are probably more incentivised to use internal models to calculate their SCRs.
7.11 Summary
7.11.1 Solvency II has set up a very high technical standard for developing a coherent risk management framework. A thorough understanding will be vital for an annuity provider in assessing risks, capital requirements, and the implications for strategy and performance. Actuaries need to master the technical detail of the new regime, and assist their firms/clients in making a transition which is likely to be very demanding, in terms of the capability and understanding required.
7.11.2 However, Solvency II is not a perfect framework. For example, most of the common stresses are derived from historical data, notably from the recent financial crisis, which may or may not be appropriate in identifying the prospective risks for each individual insurer. Moreover, some of the proposed rules are sound in theory, but difficult or impossible to apply in practice. Actuaries will need to assist the industry and regulators in working through issues such as these.
7.11.3 For the UK annuity market, the main focus of debate on Solvency II so far has been the allowance for illiquidity premium in the discount term structure. At the time of writing, it appears likely that some allowance for illiquidity premium will be permitted, albeit smaller than the implicit allowance taken under Pillar I at present. The final conclusion from CEIOPS and the European Commission, on this and other issues, is still awaited at the time of writing. Nevertheless, the debate has raised industry awareness of the nature and complexity of risk in managing annuity business.
7.11.4 In our view, the main challenges of Solvency II are not technical and intellectual, but practical and commercial. The potential impacts of this change on the insurance industry, the annuity market, and UK retirement provision overall, are profound. The nature and scale of these impacts is also very uncertain, at least until the final Solvency II rules are known.
8. Concluding Remarks
8.1 We did not expect that this paper could provide all the answers, and whilst it is a lengthy document, much more could be written about any of the topics that we have addressed. Accordingly, in conclusion, we summarise the issues that in our view are the most important for the profession, the annuity industry, and the wider public. We hope that debate on these issues (and others) will be forthcoming.
8.2 Almost all of the UK annuity market arises from compulsory annuitisation of tax-advantaged funds. The tax advantage is not, so far, under any overt political threat, but compulsory annuitisation has often been criticised and may come under active review. Are the risk, pricing, and public policy implications of reducing/removing compulsion well understood by policy makers?
8.3 Longevity trend has been the subject of much research and some controversy. Given that the goal of public policy, and the self-interest of annuitants, will always be a longer life span, how should the trend and its riskiness be assessed and managed? How might the risk be transferred from insurers to other parties? Are asset hedges really feasible?
8.4 Pricing, investment, financial reporting and reserving of annuity business have all changed radically (although there has been relatively little change in, or migration from, the core non-profit annuity product). Have all the implications and risks of current commercial practice been identified and managed?
8.5 In particular, more sophistication in investment strategy has increased the range of financial risks borne, and the complexity of interactions between these. The interaction of longevity risk with ALM risks is also more complex. Are appropriate instruments, processes and techniques in place to manage these interactions?
8.6 There has been a proliferation of measurement systems for performance and capital requirements. The adoption of Solvency II and of economic capital will add to this complexity. Can performance, risk and capital be measured and managed consistently?
8.7 Solvency II will change the capital requirements for annuity business, emphasising some risks more whilst arguably under-emphasising others, and will likely have implications for business strategy especially as regards investments. Are the new requirements and strategy implications understood (as far as can be, given the status of the rules) – not only by insurers but by policy makers? Are they prepared for the implications of transition, including impacts on current and future annuity customers?
8.8 Areas for Further Work
8.8.1 We have not addressed operational risk in this paper (beyond making passing references). However, actuaries should have an interest and seek to develop experience in this field, and we suggest that the operational risk specifics of annuities are an area for further research to be undertaken.
8.8.2 We have not addressed the potential impacts of the International Accounting Standards Board's Phase II project for insurance contracts. Although these may prove to be just as important as Solvency II, in our view more definition is needed from the IASB before such a discussion can be fully productive.
8.8.3 We have not taken account of any developments since January 2010. In regard to Solvency II, particularly, this has forced us to omit some expected developments that will have a material impact, such as the allowance (if any) for an illiquidity premium.
9. Acknowledgements
9.1 As usual, many people besides the named authors have helped to create this paper. David Hare and Mike Bolton, for the Life Practice Executive Committee, provided the initial impetus and proposed the content. Valuable comments came from Andy McAleese at an early stage and from David Still on a late draft, as well as from the official peer reviewers. Many of our colleagues provided help, particularly in sourcing data and references. The help of Audrey Cosens and others at the Actuarial Profession was invaluable in the final production stage.
9.2 We thank all these people for their contributions. Neither any of them, nor our firms, are responsible for the views expressed herein, which are our own. We are also to blame for any errors that remain.
Appendix A : Simplified Method for Technical Provisions
A1.1 In order to project probability-weighted annuity cash flows driven by future mortality changes, the Cairns-Blake-Dowd model with parameter uncertainty is used to generate 10,000 Monte Carlo simulations for a male aged 70. The model is calibrated to the CMI life office collected data (male only) from 1947 to 2005.
A1.2 Figure 15 illustrates the simulated survival curves and each coloured strip represents 10% probability of occurrence at both sides of the distribution.
Simulated survival curves from the Cairns-Blake-Dowd model. Source: Deutsche Bank.

A1.3 The best estimate survival curve is then generated by assuming zero volatility of future mortality rates as shown in Figure 16:
Deterministic best estimate survival curve. Source: Deutsche Bank.

A1.4 Under the assumptions that annuity benefits are level and that the risk-free discount rates are 5% flat, the technical provisions calculated using the best estimate mortality assumptions are only 0.21% different from that calculated from the Monte Carlo simulations.