

INTRODUCTION
The superoxide dismutases (SOD) comprise a group of enzymes capable of reacting preferentially with superoxide radicals to provide antioxidative protection (Imlay et al., Reference Imlay, Chin and Linn1988; Imlay and Linn, Reference Imlay and Linn1988) to cells and tissues in which they are produced (Orr and Sohal, Reference Orr and Sohal1994). Cu/ZnSOD, the first intracellular isoform to be discovered, is also known as SOD1, and historically as SOD3 in humans (Perry et al., Reference Perry, Shin, Getzoff and Tainer2010). In the central nervous system, SOD1 has been reported in astrocytes, primarily the cytoplasm and processes, and to a lesser extent in motor neurons and other neurons (Noack et al., Reference Noack, Lindenau, Rothe, Asayama and Wolf1998; Lindenau et al., Reference Lindenau, Noack, Possel, Asayama and Wolf2000). A study of immature rats, from P2 to P7, reported SOD1 in neuronal cell bodies and processes, as well as in glia and the eppendymal cells of the central canal of the spinal cord (Rogerio et al., Reference Rogerio, Teixeira, de Rezende, de Sa, de Souza Queiroz and De Nucci2005).
SOD1 is essential for normal function of the nervous system. In human, SOD1 mutation causes motor neuron degeneration as in familial amyotrophic lateral sclerosis (Deng et al., Reference Deng, Hentati, Tainer, Iqbal, Cayabyab and Hung1993). However, little is known about the role of normal SOD1 in sensory pathways following peripheral nerve injury. Rosenfeld et al. (Reference Rosenfeld, Cook and James1997) reported no changes in SOD1, but increased MnSOD (SOD2), 12 days post-axotomy in adult rats. In neonates, increased SOD1 protein in spinal cord homogenates was found following axotomy compared to unlesioned controls, but no change in SOD1 or SOD2 expression patterns were seen up to 7 days post-axotomy (Rogerio et al., Reference Rogerio, Teixeira, de Rezende, de Sa, de Souza Queiroz and De Nucci2005).
The biochemistry of superoxide is closely linked to the most studied reactive oxygen species, nitric oxide (NO), which is produced from the substrate l-arginine by NO synthase (Stamler et al., Reference Stamler, Singel and Loscalzo1992; Moncada and Higgs, Reference Moncada and Higgs2006). Since recognition of NO as a signalling molecule, three isoforms of NO synthase have been described, namely endothelial, inducible and neuronal NO synthase (eNOS, iNOS and nNOS, respectively). Following axotomy, nNOS is greatly increased in rat dorsal root ganglion (DRG) neurons by 7–8 days (Verge et al., Reference Verge, Xu, Xu, Wiesenfeld and Hokfelt1992; Zhang et al., Reference Zhang, Verge, Wiesenfeld-Hallin, Ju, Bredt and Synder1993; Thippeswamy et al., Reference Thippeswamy, Jain, Mumtaz and Morris2001). Neuronal NOS is also altered in central terminals of DRG neurons in the dorsal horn of the spinal cord, and in neuronal somata in laminae (L) I, II and VI, and also L X surrounding the central canal of rats and mice following axotomy (Keilhoff et al., Reference Keilhoff, Fansa and Wolf2004; Freire et al., Reference Freire, Guimaraes, Leal and Pereira2009). This suggests that NO released in the DRG–spinal cord network might play an important role in sensory processing. However, the distribution of nNOS and SOD with respect to peripheral axotomy is not fully understood. There is evidence to suggest that NOS functionality may be SOD-dependent (Hobbs et al., Reference Hobbs, Fukuto and Ignarro1994; Schmidt et al., Reference Schmidt, Hofmann, Schindler, Shutenko, Cunningham and Feelisch1996) and that their relative level may determine the formation of peroxynitrite or nitrotyrosine (Beckman et al., Reference Beckman, Smith and Koppenol1993; Huie and Padmaja, Reference Huie and Padmaja1993; Wink and Mitchell, Reference Wink and Mitchell1998).
In this study, we examined the changes in distribution of SOD1 and nNOS in DRG–spinal cord network following peripheral axotomy in transgenic mice in which membrane-linked enhanced membrane-bound green fluorescent protein (eGFP) driven by Thy1.2 promoter in a subset of DRG neurons and central terminals. eGFP combined with an axotomy marker, small proline-rich repeat protein 1A (SPRR1A) immunoreactivity (Bonilla et al., Reference Bonilla, Tanabe and Strittmatter2002; Starkey et al., Reference Starkey, Davies, Yip, Carter, Wong and McMahon2009), enabled identification of central terminals of axotomised DRG neurons. Axotomised mice were treated with the NOS inhibitor, lNG-nitroarginine methyl ester (L-NAME) or vehicle, which was administered to coincide with previously reported peaks in NO production by 7–8 days post-injury (Verge et al., Reference Verge, Xu, Xu, Wiesenfeld and Hokfelt1992; Thippeswamy et al., Reference Thippeswamy, Jain, Mumtaz and Morris2001, Reference Thippeswamy, Haddley, Corness, Howard, McKay and Beaucourt2007; Cheng et al., Reference Cheng, Chen, Shi, Gao, Niu and Li2007; Bradman et al., Reference Bradman, Arora, Morris and Thippeswamy2010), to understand whether altered NO levels affect SOD1 distribution. Furthermore, the response of nNOS to axotomy has been contentious within the literature (Callsen-Cencic et al., Reference Callsen-Cencic, Hoheisel, Kaske, Mense and Tenschert1999; Cheng et al., Reference Cheng, Chen, Shi, Gao, Niu and Li2007; Bradman et al., Reference Bradman, Arora, Morris and Thippeswamy2010), possibly because of the great degree of anatomical and physiological specificity between neurons which respond as heterogenous populations within the dorsal horn (Maxwell et al., Reference Maxwell, Belle, Cheunsuang, Stewart and Morris2007). In view of this, the present study is focused on the effects of axotomy and NO modulation within spinal cord regions, defined by denervation and DRG central input, to understand SOD1–NO interaction.
OBJECTIVE
The objective of this study was to examine the effects of sciatic nerve axotomy and/or NOS inhibition on DRG–spinal cord network in a transgenic mouse that was known to produce enhanced GFP (eGFP) driven by Thy1.2 promoter. Superoxide and NO play important roles in signal transduction in the nervous system. Based on the review of the literature, including our own, it was known that axotomy induces nNOS upregulation in rat DRG (~45%) and to a lesser extent in wild-type C57Bl/6 mouse DRG (~23%). In Thy 1.2 eGFP transgenic mouse (with C57Bl/6 background), the eGFP marks a subset of DRG neurons and their central terminals, and is known to be useful in studying the effects of axotomy. The hypothesis was that axotomy and/or L-NAME alter the expression of SOD1 and nNOS in DRG–spinal cord network, and eGFP would serve as readout for axotomy-induced changes. Axotomised mice were treated with the NOS inhibitor, L-NAME or vehicle to coincide with previously reported peaks in nNOS upregulation at 7–9 days post-axotomy. Immunohistochemical analyses, to understand whether axotomy or L-NAME affects SOD1/nNOS expression, revealed some unexpected results which are discussed in this study.
METHODS
Animals
All animal procedures, breeding and maintenance took place under the UK Home Office licensing authority. Transgenic mice expressing eGFP under the control of the Thy1.2 promoter were generated in the laboratory of Professor Arber (University of Basel, Switzerland) and maintained on a C57Bl/6 strain genetic background. Thy1 (CD90) has been well characterised since its recognition as a neuronal glycoprotein (Morris and Grosveld, Reference Morris and Grosveld1989). The particular Thy1.2 reporter used in this study was selected for its ability to reveal bilateral effects of axotomy in the spinal cord, as previously demonstrated (Belle et al., Reference Belle, Pattison, Cheunsuang, Stewart, Kramer and Sigrist2007).
Surgery – axotomy
Eight adult males were anaesthetised (isoflurane gas with O2 and N2O) and were given an antimicrobial (5 mg kg−1 enrofloxacin, Baytril 2.5%) and buprenorphine analgesic (Temgesic, 0.5 mg kg−1) prior to surgery. All surgical procedures were performed under strict aseptic conditions as described, for rat, previously (Thippeswamy et al., Reference Thippeswamy, Jain, Mumtaz and Morris2001, Reference Thippeswamy, Haddley, Corness, Howard, McKay and Beaucourt2007). Briefly, the left sciatic nerve was exposed at the mid-thigh and a short (~5 mm) piece of the nerve was removed to prevent re-apposition of transected nerve. The wound was closed using standard procedures and coated with OpSite (Nephew and Nephew). Animals were weighed and monitored post-operatively on a daily basis. On the 7th day post-surgery, four mice were treated with L-NAME (Sigma, 50 mg kg−1, i.p. twice daily for 2.5 days) to coincide with reported increases in NO (Verge et al., Reference Verge, Xu, Xu, Wiesenfeld and Hokfelt1992; Cheng et al., Reference Cheng, Chen, Shi, Gao, Niu and Li2007; Thippeswamy et al., Reference Thippeswamy, Jain, Mumtaz and Morris2001, Reference Thippeswamy, Haddley, Corness, Howard, McKay and Beaucourt2007), while the rest received 0.9% w/v saline as a vehicle control. Three hours after the last dose all animals were deeply anaesthetised by an overdose of sodium pentobarbitone (60 mg kg−1). The mice were perfused transcardially with 4% paraformaldehyde (PFA) in phosphate-buffered saline (PBS) as described previously (Thippeswamy et al., Reference Thippeswamy, Haddley, Corness, Howard, McKay and Beaucourt2007).
Immunohistochemistry
L4–L6 spinal cord and DRG were dissected out immediately, and post-fixed in PFA for up to 4 h. They were cryo-protected in 25% sucrose solution in PBS for a minimum of 12 h. Tissues were gelatine embedded, and rapidly frozen by immersion in isopentane cooled by liquid nitrogen. Tissue blocks were stored at –80°C until further use. Sections were cut at 10 μm using a cryostat (Leica, UK) and mounted onto chrome alum gelatine-coated glass slides. Sections were washed three times in 0.1 M PBS before treatment with 10% donkey serum (DS) to block non-specific binding. Primary antibodies were applied (anti-SOD1 rabbit polyclonal, Stressgen, 1:500; anti-nNOS sheep polyclonal, gift of Dr. P. C. Emson, 1:4000; anti-SPRR1A, gift of Dr. M. Sivula, 1:2000) overnight in a PBS-based solution containing 0.1% Triton, 2.5% DS and 0.25% sodium azide. Negative controls comprised adjacent sections treated with diluting solution without primary antibodies. These were processed in parallel with those used for primary antibodies.
Following several further washes in PBS, appropriate anti-species secondary antibodies were applied for 1 h. Fluorochrome-conjugated or biotinylated secondary antibodies followed by fluorochrome-conjugated streptavidin, where appropriate, were used to reveal antibody binding (1:400 anti-rabbit Cy3; anti-sheep biotinylated and streptavidin FITC/marina blue, Jackson ImmunoResearch). Final washing was in PBS several times, then once in distilled water to prevent salt precipitates. Sections were covered with Vectashield soft-mount (Vector Labs, UK) and slides were coverslipped. Digital photomicrographs were acquired using a Nikon TE2000-S microscope and Hamamatsu C4742–95 camera via IPLab software. Images from vehicle control and L-NAME-treated samples were captured at equal scales and exposure times without digital enhancement; subsequent processing and quantification were carried out in ImageJ (Rasband, Reference Rasband1997) as described below.
Quantification
Considering variation between different strains of mice in segmentation of the spinal cord and topography of hindlimb innervation (Rigaud et al., Reference Rigaud, Gemes, Barabas, Chernoff, Abram and Stucky2008), instead of assuming L4/L5/L6, the region of greatest denervation was selected from the lumbar spinal cord of each animal using the following three criteria: endogenous eGFP, IB4 staining and SPRR1A immunoreactivity (Bonilla et al., Reference Bonilla, Tanabe and Strittmatter2002; Starkey et al., Reference Starkey, Davies, Yip, Carter, Wong and McMahon2009). Every 20th section (in steps of 200 µm from 10 µm sections) was examined from throughout the lumbar enlargement of the spinal cord of all animals, and the mediolateral breadth of the denervation gap assessed for each section. As previously reported (Belle et al., Reference Belle, Pattison, Cheunsuang, Stewart, Kramer and Sigrist2007), the presence of Thy1.2 eGFP corresponds closely with the IB4 lectin binding population of small-diameter afferents, and shows an equivalent band in lamina II. Axotomy causes an equivalent ipsilateral loss of eGFP following the lamina-specific withdrawal of afferent terminals (Belle et al., Reference Belle, Pattison, Cheunsuang, Stewart, Kramer and Sigrist2007). Furthermore, SPRR1A immunostaining was performed on adjacent sections to confirm the extent of the injury (Fig. 1, Table 1). Thus spinal cord sections were selected for quantification specifically from the region of peak denervation in each individual, corresponding to the widest extent of the loss of eGFP terminals from lamina II.
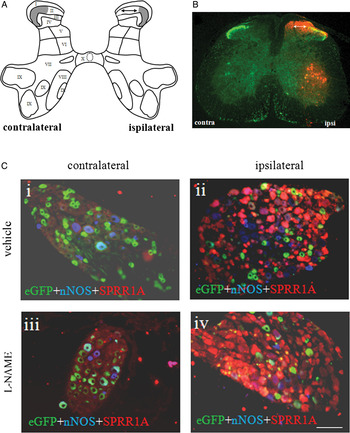
Axotomy markers in spinal cord and DRG. (A,B) Schematic representation of cross section of spinal grey matter (A) showing different laminae (modified from original by Rexed, Reference Rexed1952). Shaded area in A represents distribution of eGFP in Thy 1.2 transgenic mice (green in B). A gap that appears in LII (indicated by dual arrow in A,B) represents the region of denervation effect. Axotomy marker SPRR1A immunostaining (red in B) confirms ipsilateral side of the spinal cord and reveals the extent of neuropathology. Contralateral side also shows the loss of eGFP, representing cross-over effects of axotomy. SPRR1A did not mark the contralateral side in B. (C) Contra- and ipsilateral DRG, from vehicle- and L-NAME-treated mice, stained with SPRR1A (red) and nNOS (blue). Axotomy decreases the number of eGFP+ neurons in DRG (green in ii and iv), which gives rise to the gap in the lamina II of the dorsal horn (B) where neuronal pathology is revealed by SPRR1A. Note the lack of eGFP in SPRR1A+ neurons. Scale bar 100 µm.

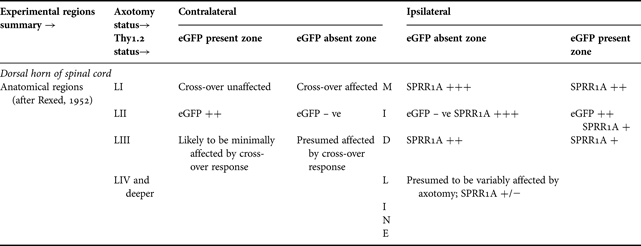
Summary of the extent of anatomical resolution employed in the spinal cord with respect to eGFP and SPRR1A immunohistochemistry
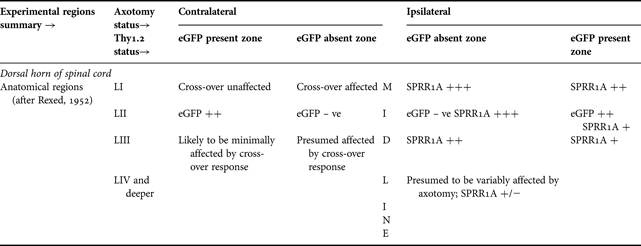
Tabulated regions correlate with anatomical organisation: dorsal to ventral; ipsilateral and contralateral (see also Fig. 1A,B). Axotomy effects, in terms of Thy1.2 eGFP and SPRR1A intensity, are shown where fluorescence intensity was detected. SPRR1A was not detected in contralateral side.
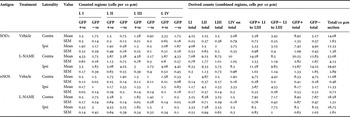
Neuronal cell bodies showing nNOS or SOD1-like immunoreactivity were counted manually and blindly from dorsal horn. All stained cell bodies (ipsi- and contralateral) were counted from three sections (peak denervation) from each of four animals in each treatment group; cell bodies visible per section were averaged by animal to prevent pseudosampling. Cell bodies from the dorsal horn were assigned to either denervated or intact regions on the ipsilateral side, and on the contralateral side to cross-over affected or intact regions, as well as to different laminae (LI, LII, LIII or LIV and deeper). These regions are summarised in Table 1. From dorsal horn, totals of 1073 SOD1+ cell bodies and 669 nNOS+ cell bodies were counted.
To quantify SOD1 staining within the central canal, where manual counts of cell bodies could not be clearly made, region of interests (ROIs) were drawn freehand on ImageJ to select only the lumen and surrounding cells without including grey matter. The mean staining intensity, modal staining intensity, variability of intensity (by standard deviation) and ROI area were compared between L-NAME and vehicle groups by Student's t-test (independent samples).
In DRG, the effect of axotomy was confirmed in all ganglia by SPRR1A staining. DRG neurons were counted as previously described (Thippeswamy et al., Reference Thippeswamy, McKay, Quinn and Morris2005b, Reference Thippeswamy, Haddley, Corness, Howard, McKay and Beaucourt2007). Manual blinded counts of all neurons with visible nuclei were taken from three sections each from four animals per group and, as with spinal cord the counts were pooled animal by animal to prevent pseudosampling. SOD1, nNOS and GFP images from separate channels were stacked so cells were identifiable according to all possible combinations of markers. To assess effects of NO in axotomised DRG, ipsilateral neurons only were assigned to categories as follows: SOD1 only, eGFP only, nNOS only, SOD1 + eGFP, SOD1 + nNOS, eGFP + nNOS, SOD1 + eGFP + nNOS and unstained. Total counts for each marker were calculated from these categories, for example; total SOD1+ cells = (SOD1 only) + (SOD1 + GFP) + (SOD1 + nNOS) + (SOD1 + GFP + nNOS), and expressed as a proportion of total neurons.
Given the total prevalence of each marker, a null hypothesis for random colocalisation rates of SOD1 + GFP and SOD1 + nNOS was generated as a mathematical likelihood of colocalisation predicted from the known incidence of each individual marker. For example, predicted colocalisation SOD1 + nNOS incidence = (total proportion SOD1)×(total proportion nNOS). This predicted rate was expected to be observed only if the molecules under test were randomly assorted between neurons. Any convergence/divergence in observed expression patterns towards/from predicted random assortment was assessed by paired t-test, in which the predicted value for each animal was compared with the observed value, to a confidence level of 95%.
SOD1+ neurons in DRG were further assessed according to cross-sectional area. The two-category approach (Lawson, Reference Lawson1979) was considered to subdivide the neuronal population to provide the minimum computed number of normal distributions contributing towards the observed histogram of cross-sectional area. All SOD1+ neurons counted were further categorised into small and large neurons based on cut-off point of 400 µm2 cell area (Lawson, Reference Lawson1979), inferred during counting from the diameter and shape of neurons on calibrated images.
The effects of axotomy and L-NAME on cell counts were assessed by means of one-way analysis of variance (ANOVA) coupled with downstream least significant difference (LSD) using software (SPSS 17, IBM). Where appropriate, paired t-tests were applied to compare ipsi- and contralateral sides in order to control for inter-animal variance in staining intensity.
Results
SPRR1A versus Thy1.2 eGFP as an axotomy marker
In the dorsal horn, strong SPRR1A immunoreactivity was evident in ipsilateral dorsal laminae which was coincided with the loss of eGFP from lamina II (Fig. 1A,B; Table 1) confirming the effect of axotomy. The greatest extent of SPRR1A within dorsal horn of ipsilateral side coincided with the broadest axotomy-induced gap in eGFP. However, there was also loss of eGFP in contralateral laminae but SPRR1A immunoreactivity was absent confirming the latter as a reliable marker of nerve injury. SPRR1A was also strongly expressed in ipsilateral ventral motor neurons which provided further evidence for axotomy and also served as a marker for the denervated segment of the spinal cord. In ipsilateral L4 and L5 DRG, a clear majority of neurons were strongly SPRR1A+ with an eccentric nucleus, further confirming the effectiveness of the sciatic injury model (Fig. 1C(ii, iv)). SPRR1A staining was cytoplasmic, appeared in all sizes of neuron and colocalisation with Thy1.2 eGFP was low. As expected, SPRR1A remained absent from contralateral DRG neurons.
L-NAME, but not axotomy, increases nNOS+ and SOD1+ neurons in the dorsal laminae of the spinal cord
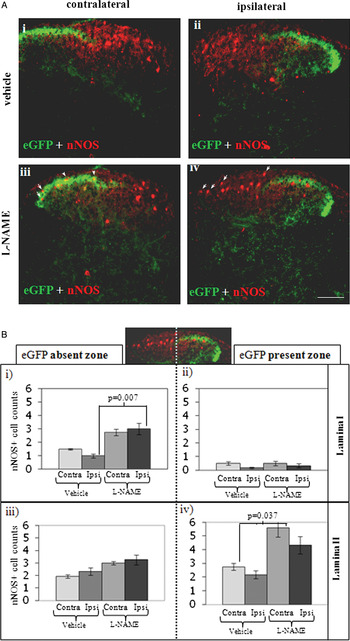
Axotomy alone did not cause significant differences in numbers of nNOS+ neurons between contra- and ipsilateral dorsal horns at the 95% confidence level in a paired t-test (Fig. 2; Table 2). However, treatment with L-NAME caused significant changes in nNOS+ neurons in laminae I and II depending on denervation or crossover effects (Fig. 2B). Within denervated superficial dorsal horn laminae, lamina I (L1) alone contained significantly increased numbers of nNOS+neurons in L-NAME-treated animals when compared with vehicle controls [Fig. 2B(i); P = 0.007]. A similar increase was detected in contralateral LII following L-NAME treatment and was located primarily in the ‘eGFP present zone’ (unaffected by axotomy) [Fig. 2B(iv); P = 0.037] confirming axotomy had no effect on the number of nNOS+ neurons in the superficial dorsal laminae, but L-NAME did. However, deeper laminae showed no such significant increases in nNOS+ neurons following L-NAME treatment.
nNOS in spinal dorsal horn and its modulation by L-NAME. (A) nNOS immunohistochemistry. Transverse sections of L4 spinal dorsal horn from Thy 1.2 eGFP mouse following sciatic nerve axotomy (9 dpo) and treatment with L-NAME (iii, iv) or vehicle control (i, ii). Green: endogenous eGFP. Red: nNOS. L-NAME causes upregulation of nNOS in both axotomised and intact dorsal horn in a region-dependent manner. Increased numbers of nNOS+ cell bodies were detected in L-NAME-treated animals (examples are marked with arrowheads in iii and iv); when compared with similar regions in the vehicle-treated control animals (i, ii). Scale bar 100 µm. (B) Graphs show mean cell counts of nNOS+ cell bodies from ‘eGFP absent zone’ (represents both ipsilateral ‘denervated zone’ and the contralateral ‘cross-over affected zone’) and ‘eGFP present zone’ of the dorsal horn lamina I and II (9 dpo) from L-NAME- and vehicle-treated mice. Error bars, SEM. In lamina I, the denervated area [eGFP absent zone (i), ipsi] showed a significant increase in nNOS+ cells following L-NAME treatment (P = 0.007), while the ‘eGFP present zone’ (ii) showed no such effect. Overall, in ‘eGFP present zone’ of lamina I (ii) there was decreased nNOS+ neurons in both ipsi- and contra-lateral side when compared with ‘eGFP absent zone’ of the same lamina (i) and ‘eGFP present zone’ of lamina II (iv). In lamina II, the denervated area [eGFP absent zone (iii), ipsi] showed no difference in nNOS+ cells, while in the ‘eGFP present zone’ contralaterally (iv, contra), a significant difference was detected between the control and L-NAME-treated groups (P = 0.037).

Mean SOD1+ and nNOS+ cell body counts from the region of peak denervation at the full extent of anatomical resolution available, and in combined regions

Values are cell bodies visible per 10 μm section, expressed as means of 4 animals; actual numbers of cells counted were therefore three times higher per animal and 12 times higher per group (see Methods) in every region. Note: eGFP+/- denotes presence/absence from L II as defined in Table 1 and Fig. 1B.
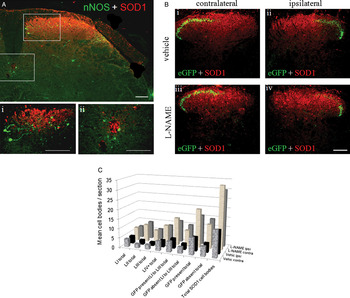
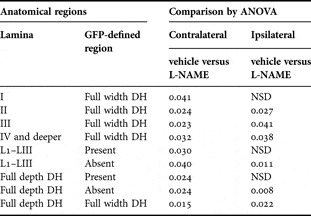
SOD1 was detected primarily in laminae I–III of the dorsal horn, and within eppendymal cells of the central canal (Fig. 3A). It is notable that SOD1 immunostaining shared similar regional distribution to that of nNOS in the superficial dorsal horn, however these two molecules were never seen to colocalise in any spinal neuron. There was no significant difference in SOD1+ cells between ipsilateral and contralateral sides. However, in almost every dorsal horn region, L-NAME caused a significant increase in SOD1+cells when compared with vehicle control (Fig. 3B,C; Tables 2 and 3). In the central canal of axotomised mice, no significant SOD1 differences between vehicle and L-NAME treatments were detected.
SOD1 distribution in spinal cord and its modulation by L-NAME. (A) Mouse spinal cord dorsal horn ipsilateral to sciatic nerve axotomy (9 dpo) from L-NAME-treated mouse, double stained for SOD1 and nNOS. Red: SOD1, in the superficial laminae (i) and eppendymal cells of the central canal (ii). Green: nNOS. Note: nNOS staining in this case was originally identified with anti-sheep biotinylated and streptavidin Marina blue. Images were captured as black and white but later pseudo coloured with green to contrast with red. Therefore, eGFP in the dorsal horn is not shown. Scale bars 100 µm. (B) Representative images showing SOD1 immunoreactivity (red) and eGFP in the dorsal horn following sciatic nerve axotomy (9 dpo). Irrespective of axotomy, there are increased numbers of SOD+ cells in L-NAME-treated groups. See graph C and Tables 2 and 3 for lamina-specific details of cell counts. Scale bar 100 µm. (C) Graph summarises regional quantification of SOD1+ cells from dorsal horn of the spinal cord (see also Tables 2 and 3). Counts from all regions were grouped by lamina and by the presence or absence of eGFP (axotomy effect ipsilaterally/cross-over effect contralaterally) and subjected to statistical analysis by ANOVA. No differences were detected between contra and ipsilateral sides, however L-NAME caused significant increases in SOD1+ cell counts at the 95% confidence level in most groups (see Table 3 for P values).

P values (vehicle versus L-NAME) for SOD1 quantification, by region, from the dorsal horn of the spinal cord (Fig. 3)

Note: NSD = no significant difference at 95% confidence level.
Axotomy and L-NAME have no effect on nNOS+ neurons in DRG
Surprisingly, axotomy did not increase the number of nNOS+ neurons in ipsilateral DRG compared with contralateral, and L-NAME too had no effect on the number of nNOS+ neurons. Out of 5541 DRG neurons counted from ipsilateral DRG, 5.7% were of nNOS+ in vehicle treated and 5.3% in L-NAME treated (Fig. 1C). Ipsilateral DRG stained strongly for neuronal SPRR1A, demonstrating that axotomised ganglia were correctly identified. The nNOS antibody (from same source and batch), when applied to spinal cord sections from the same mice and processed simultaneously in parallel with DRG, showed the expected nNOS distribution (Fig. 2). This suggests that Thy 1.2 eGFP mouse DRG respond to axotomy differently with respect to nNOS compared with other rodent models.
Axotomy and L-NAME have no effect on SOD1+ cell numbers but L-NAME alters its expression in a subset of axotomised DRG neurons
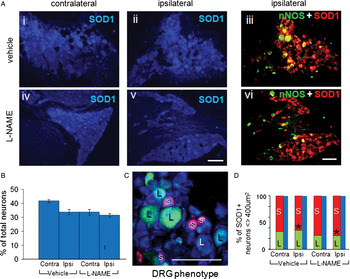
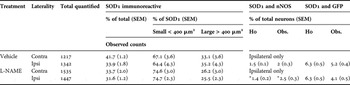
Approximately one-third of DRG neurons were clearly SOD1 immunoreactive, irrespective of axotomy or L-NAME treatment (Fig. 4A,B). SOD1 was detected variably in the cytoplasm and nuclei across all sizes of neuron. Despite the lack of increase in nNOS+ neurons, and resulting low incidence of colocalisation, ipsilateral colocalisation between nNOS and SOD1 in L-NAME-treated mice was significantly greater than random assortment would predict for those two molecules, based on individual staining rates (P = 0.044). Colocalisation of SOD1 with nNOS was at rates indistinguishable from random levels in vehicle-treated mice, as was colocalisation between SOD1 and Thy1.2 in both treatment groups. This is summarised in Table 4. An example of nNOS and SOD1 colocalisation in ipsilateral DRG and the effect of L-NAME are shown in Fig. 4A.
Effects of axotomy and/or L-NAME on SOD1 in DRG. (A) SOD1 immunoreactivity (blue in i, ii, iv and v) was localised mainly in neuronal cytoplasm and nuclei of DRG neurons, irrespective of neuronal subtypes. (iii) and (vi) SOD1 (red) and nNOS (green) in ipsilateral DRG. SOD1 colocalisation with nNOS (yellow) was observed in larger diameter neurons of ipsilateral DRG in vehicle-treated mouse (iii), while in L-NAME-treated mouse it was restricted to small-medium sized neurons (vi). Scale bar 100 µm. (B) SOD1 immunoreactive neurons expressed as a percentage of total neuron number irrespective of DRG neuronal subtypes, i.e. small diameter (<400 µm) and large diameter (>400 µm) neurons. No significant differences were found between the treatment groups in the proportion of neurons expressing SOD1. Neither was significant difference detected within treatment groups comparing ipsilateral with contralateral sides by ANOVA or in a paired t-test. Error bars SEM. (C) An example for DRG neurons phenotypes. SOD1+ neuron (blue) with respect to neuronal size. S (red): small diameter (<400 µm) neurons. L (green): large diameter (>400 µm) neurons. (D) Quantification of SOD1+ neurons based on size criteria as illustrated in (C). Asterisk indicates significant shift in SOD1 expression towards small diameter neurons (P = 0.024) in L-NAME-treated ipsilateral DRG when compared with vehicle-treated group. Contralateral changes are below significance at 95% confidence.

Summary of SOD1 staining in DRG neurons from axotomised and L-NAME or vehicle treated mice at 9 day post-axotomy. Immunoreactivity was quantified in terms of SOD1+ percentages of all neurons stained, sizes of stained neurons, and colocalisation with nNOS and eGFP; see Fig. 4 graphs and sample images. Note: H0 = hypothetical random assortment (see Methods); Obs. = observed colocalisation

*Predicted random colocalisation rate was significantly lower than observed colocalisation rate for SOD1 with nNOS in L-NAME treated ipsilateral DRG, P = 0.044 by paired t-test. Following NO modulation by L-NAME, SOD1 was found to colocalise with nNOS significantly more frequently than at random.
SOD1+ neurons in DRG were found to be a heterogeneous population according to standard criteria of neuronal cell area. Between one-quarter and one-third fell into the large cell size category in both experimental groups (Fig. 4C,D). Ipsilateral DRG showed significant differences between vehicle and L-NAME treatments in SOD1+ neuronal size, with a shift towards the small diameter (presumably nociceptive) neurons, with proportionately fewer large (presumably proprioceptive) neurons expressing SOD1 following L-NAME treatment (Fig 4; P = 0.024).
Conclusions
• SPRR1A is the more reliable marker of neuropathology, while eGFP is capable of revealing contralateral effects of axotomy.
• L-NAME, but not axotomy, increases nNOS+ and SOD1+ neurons in the dorsal laminae of the spinal cord.
• Axotomy and/or L-NAME had no effect on nNOS+neurons in DRG.
• Axotomy and L-NAME had no effect on SOD1+ cell numbers but L-NAME alters its expression in subsets of axotomised DRG neurons.
• Thy 1.2 eGFP transgenic mouse response to axotomy, with respect to NO signalling, is different from the rat model.
Discussion
In the present study, we demonstrate differential effects of axotomy and/or L-NAME on SOD1+ and nNOS+ neurons in the spinal cord–DRG network of Thy1.2 eGFP transgenic mice. Surprisingly, axotomy alone accounted for no significant differences in Thy 1.2 eGFP mouse nNOS expression in DRG in contrast to rat (Verge et al., Reference Verge, Xu, Xu, Wiesenfeld and Hokfelt1992; Shi et al., Reference Shi, Holmberg, Xu, Steinbusch, de Vente and Hokfelt1998; Thippeswamy et al., Reference Thippeswamy, Jain, Mumtaz and Morris2001, Reference Thippeswamy, Haddley, Corness, Howard, McKay and Beaucourt2007) and mouse (Keilhoff et al., Reference Keilhoff, Fansa and Wolf2002). However, NOS inhibition and axotomy are not analogous and, irrespective of axotomy, L-NAME increased nNOS+ neurons in spinal laminae I and II. Interestingly, SOD1+ neurons also increased in response to L-NAME in the spinal cord and their distribution was similar to nNOS+ neurons, although the two molecules were never observed to colocalise in any single neuron. In contrast, in the DRG, higher numbers of small diameter neurons contained SOD1 following axotomy and L-NAME treatment.
NOS inhibitors and rodent models of axotomy
We have previously tested, in rats, the effects of various NOS inhibitors including nNOS-specific inhibitors such as 7-nitroindazole, 1,2-trifluoromethylphenyl imidazole or dominant negative viral vectors targeting either nNOS or sGC in both in vivo and in vitro models of nerve injury (Thippeswamy et al., Reference Thippeswamy, Jain, Mumtaz and Morris2001, Reference Thippeswamy, McKay, Morris, Quinn, Wong and Murphy2005a, Reference Thippeswamy, McKay, Quinn and Morris2005b, Reference Thippeswamy, Haddley, Corness, Howard, McKay and Beaucourt2007). In rat models of nerve injury, we and others (Verge et al., Reference Verge, Xu, Xu, Wiesenfeld and Hokfelt1992; Shi et al., Reference Shi, Holmberg, Xu, Steinbusch, de Vente and Hokfelt1998; Bergman et al., Reference Bergman, Carlsson, Liljeborg, Manders, Hokfelt and Ulfhake1999) have shown a significant increase in the number of nNOS+ neurons in DRG at 7–8 days following injury to their axons. In subsequent years, the role of iNOS and eNOS in nerve injury models began to emerge (Levy et al., Reference Levy, Kubes and Zochodne2001; Sunico et al., Reference Sunico, Portillo, Gonzalez-Forero, Kasparov and Moreno-Lupez2008). We have very recently demonstrated the presence of iNOS-producing immune cells such as CD68+ macrophages in axotomised DRG (Bradman et al., Reference Bradman, Arora, Morris and Thippeswamy2010). L-NAME is considered as a general NOS inhibitor as it targets all three known NOSs to prevent NO production. In view of this, we recently tested the effects of L-NAME also in a rat model of axotomy where L-NAME did not cause degenerative changes in rat DRG neurons (Bradman et al., Reference Bradman, Arora, Morris and Thippeswamy2010) as opposed to nNOS-specific inhibitors (Thippeswamy et al., Reference Thippeswamy, Jain, Mumtaz and Morris2001, Reference Thippeswamy, Haddley, Corness, Howard, McKay and Beaucourt2007). These findings suggest that L-NAME inhibits inflammatory or toxic effects of NO mediated by iNOS and possibly eNOS. Considering these effects of L-NAME in a rat model, we extended this to Thy1.2 eGFP mice in which subpopulations of DRG neurons are selectively marked by eGFP.
nNOS in axotomised DRG: Thy 1.2 eGFP mouse versus rat model
There have been numerous reports detailing increased nNOS protein synthesis in DRG neurons following axotomy in the rat (Fiallos-Estrada et al., Reference Fiallos-Estrada, Kummer, Mayer, Bravo, Zimmermann and Herdegen1993; Shi et al., Reference Shi, Holmberg, Xu, Steinbusch, de Vente and Hokfelt1998; Bergman et al., Reference Bergman, Carlsson, Liljeborg, Manders, Hokfelt and Ulfhake1999; Thippeswamy et al., Reference Thippeswamy, Jain, Mumtaz and Morris2001; Cheng et al., Reference Cheng, Chen, Shi, Gao, Niu and Li2007). There has been only one report so far, however, of a comparable, though smaller, increase in axotomised mouse DRG (in C57Bl/6 wild-type controls to nNOS knockouts) over a similar time course (Keilhoff et al., Reference Keilhoff, Fansa and Wolf2002). We demonstrate here a clear and unexpected difference in C57Bl/6 Thy1.2 eGFP mice, which showed a persistently low incidence of nNOS immunoreactivity in axotomised DRG. In a repeat experiment with a further eight axotomised C57Bl/6 Thy1.2 eGFP mice, this same lack of increase in nNOS above baseline levels was observed by comparison of ipsi- with contralateral DRG. The lack of nNOS increase was clear in spite of robust ipsilateral increases in SPRR1A, an established marker of neuronal injury (Bonilla et al., Reference Bonilla, Tanabe and Strittmatter2002; Starkey et al., Reference Starkey, Davies, Yip, Carter, Wong and McMahon2009).
nNOS signalling in DRG–spinal dorsal horn network
As previously and widely reported, nNOS staining in the spinal cord was detected primarily in cell bodies and processes within the dorsal horn and around the central canal (Terenghi et al., Reference Terenghi, Riveros-Moreno, Hudson, Ibrahim and Polak1993; Kluchova et al., Reference Kluchova, Klimcik and Kloc2002). It is necessary to consider also the possible effects of nNOS from DRG neurons in relation to immunoreactivity reported in the dorsal horn. As well as being locally active within ganglia (Thippeswamy et al., Reference Thippeswamy, Haddley, Corness, Howard, McKay and Beaucourt2007), nNOS may be transported centrally to sensitise dorsal spinal neurons (Ryu et al., Reference Ryu, Jung, Ha, Kwak, Lim and Hong2010) or peripherally to the injured site to promote neuritogenesis (Zochodne et al., Reference Zochodne, Levy, Zwiers, Sun, Rubin, Cheng and Lauritzen1999). These mechanisms are considered as ‘axotomy responses’ to compensate for either lost peripheral trophic support of DRG neurons and/or impaired signalling to spinal neurons. As we report here, axotomy alone had no effect on the number of nNOS+ neurons in the dorsal spinal horn, but L-NAME differentially upregulated its synthesis in ipsilateral L1 and contralateral LII. This is an interesting observation for two reasons: (i) It has been shown that axotomy causes degeneration of DRG neurons' central terminals in the dorsal laminae of the spinal cord (Tajti et al., Reference Tajti, Fischer, Knyiher-Csillik and Csillik1988), possibly due to infiltration of macrophages and microglial cells (Beggs and Salter, Reference Beggs and Salter2007). In the present study, L-NAME appears to induce its own targeted enzyme in dorsal laminae neurons, which may be a homeostatic response to compensate for negative feedback interrupted by L-NAME. Although possible mechanisms are numerous and have yet to be fully elucidated, one plausible explanation is the role of MAP kinases in NO signalling and the control of gene transcription. For example, NOS inhibition reduces p38 activation (Tang et al., Reference Tang, Svensson, Fitzsimmons, Webb, Yaksh and Hua2007), while p38 also controls nNOS transcription (Raoul et al., Reference Raoul, Estevez, Nishimune, Cleveland, DeLapeyriere and Henderson2002). These differences in spinal cord contrasted with the notable absence of the expected DRG response implies that nNOS may be differentially regulated between central and peripheral nervous systems in Thy 1.2 eGFP transgenic mice. (ii) Increased nNOS+ in contralateral LII neurons, in response to L-NAME, could possibly play a role in contralateral sprouting of fibres. We have shown previously that the nNOS-mediated pathway activates the production of neurotrophic factors such as nerve growth factor and neurotrophin 3 by glial cells (Thippeswamy et al., Reference Thippeswamy, McKay, Quinn and Morris2005b) which are known to play important roles in neuritogenesis (Deng et al., Reference Deng, Zhong and Zhou2000).
It is also possible that these results are mediated, at least in part, by off-target and/or downstream direct effects of L-NAME. L-NAME, acting via insulin, has been shown to increase glucose levels in a dose-dependent manner (Browning et al., Reference Browning, Garyu, Dumler and Scorpio2006). This may be expected to contribute to alterations in cell function, especially in glucose-dependent neurons. L-NAME is also known to increase the concentration of haem, which may in turn alter iNOS dimerisation (Albakri and Stuehr, Reference Albakri and Stuehr1996). Furthermore, L-NAME may interact, stereoselectively, with plasma membrane proteins to control availability of intracellular Mg2+ and Ca2+ ions (Das et al., Reference Das, Kravtsov, Ballard and Kwan1999). In contrast to this potential effect, Ca2+ influx has been shown to increase nNOS transcription via the CREB pathway (Sasaki et al., Reference Sasaki, Gonzalez-Zulueta, Huang, Herring, Ahn and Ginty2000). Thus, while L-NAME may have affected nNOS by non-NO-mediated pathways, such off-target effects may be mutually antagonistic. It is parsimonious to assume that effects attributed to L-NAME administration primarily occur following NOS inhibition, and are therefore likely to be NOS-targeted rather than off-target with respect to dorsal laminae of the spinal cord.
SOD1 in spinal dorsal horn
SOD1 was found to exhibit a similar regional distribution to that described for nNOS in the spinal cord, being present in the superficial dorsal laminae and the central canal. The notable absence of cellular colocalisation between nNOS and SOD1 in spinal cord regions where both occur does not necessarily mean that they arise in totally different cell types. Although nNOS is indeed primarily neuronal, this does not preclude the presence of SOD1 in non-nNOS+neurons (as opposed to glia). Indeed, in rat dorsal horn, we have observed SOD1 staining to be closely associated with, and to surround, NeuN+ nuclei (unpublished data).
The lack of nNOS–SOD1 colocalisation in mouse spinal cord is an interesting finding, given that nNOS is incapable of effecting NO production without the presence of low levels of SOD (Schmidt et al., Reference Schmidt, Hofmann, Schindler, Shutenko, Cunningham and Feelisch1996). It has been suggested that SOD1 fulfils this role as reactant (rather than catalyst) in the enzymatic production of NO, possibly by converting from Cu(II)SOD to Cu(I)SOD (Murphy and Sies, Reference Murphy and Sies1991). Similarly, iNOS activity is also enhanced by the addition of SOD (Hobbs et al., Reference Hobbs, Fukuto and Ignarro1994). In view of this, the increase in spinal SOD1 following L-NAME would be commensurate with a homeostatic rebound of NO production (Murphy, Reference Murphy2000). Although nNOS is expressed throughout neuronal cell bodies, it is transported (Rodriguez-Crespo et al., Reference Rodriguez-Crespo, Straub, Gavilanes and Ortiz de Montellano1998) and localised to membranes (Brenman et al., Reference Brenman, Chao, Gee, McGee, Craven and Santillano1996) and may thus be more precisely controlled, becoming active in the presence of SOD. Indeed, SOD2 knockout mice show increased susceptibility to NMDAR-induced neurotoxicity suggesting that nNOS–SOD could mediate neuroprotective effects (Gonzalez-Zulueta et al., Reference Gonzalez-Zulueta, Ensz, Mukhina, Lebovitz, Zwacka and Engelhardt1998). Both SOD1+ and nNOS+ cells increase consistently in ipsilateral and contralateral spinal dorsal horn in response to L-NAME. This implies that in addition to the nNOS–neurotrophic factors mediated pathway (Thippeswamy et al., Reference Thippeswamy, Haddley, Corness, Howard, McKay and Beaucourt2007), SOD1 upregulation could represent another protective mechanism. Recently, it has been shown that in a rat nerve injury model, application of SOD and L-NAME significantly reduces the levels of phosphorylated NR1 subunit of NMDAR (Ryu et al., Reference Ryu, Jung, Ha, Kwak, Lim and Hong2010). This also suggests that NO–SOD interaction at the spinal dorsal horn might prevent sensitisation of spinal dorsal horn neurons (Yu, Reference Yu2002).
SOD1 in DRG
To understand NO–SOD interaction further, we examined axotomised DRG of mice that were treated with L-NAME or vehicle. SOD1 was altered in its expression patterns (both with regard to neuron size and with regard to nNOS expression) when NO production was blocked by L-NAME, suggesting that SOD1 may potentiate protective effects in a subset of DRG neurons while simultaneously limiting excessive NO release from non-neuronal sources (Bradman et al., Reference Bradman, Arora, Morris and Thippeswamy2010). Since NO can diffuse to signal further than the originating cell, the fate of the cell may be determined depending on the ‘redox’ state and the SOD content of the target cell. Importantly, the concentration of NO and the presence or absence of SOD1 will determine the cell function (Culotta et al., Reference Culotta, Yang and O'Halloran2006). Overall these observations suggest that SOD1 and/or NO may differentially modulate proprioceptive (Schuppe et al., Reference Schuppe, Araki, Aonuma, Nagayama and Newland2004; Schuppe and Newland, Reference Schuppe and Newland2004; Chen et al., Reference Chen, Levedakou, Millen, Wollmann, Soliven and Popko2007) and nociceptive (Ridger et al., Reference Ridger, Greenacre, Handy, Halliwell, Moore and Whiteman1997; Little et al., Reference Little, Doyle and Salvemini2010) pathways.
In summary, transgenic mice respond to axotomy differently than in rats with respect to NO signalling. Inhibiting endogenous NO by L-NAME may trigger a compensatory mechanism of cell signalling either by upregulating nNOS and SOD1 in the dorsal laminae of the spinal cord or an altered expression of SOD1 in a subpopulation of DRG neurons which may mediate proprioceptive or nociceptive function.
ACKNOWLEDGEMENTS
We would like to thank Prof. S. Arber for kind provision of the Thy1.2 eGFP transgenic mouse line used in this study. We would like also to thank Dr. P.C. Emson for providing the anti-nNOS antibodies and Dr. M. Sivula for the anti-SPRR1A antibodies. M. Bradman is funded by BBSRC (DTA) CASE studentship supported by Pfizer, UK.
Statement of interest
None.