Voting behavior has been a central focus of political science since the behaviorist turn. It is an important indicator for the well-being of democracies (Schumpeter Reference Schumpeter1976), especially in light of the decline in conventional political participation in democracies since the 1970s (Blais, Gidengil, and Nevitte Reference Blais, Gidengil and Nevitte2004; Blais Reference Blais2006; Kostelka Reference Kostelka2015). This article focuses on measurement of electoral participation and the comparability of electoral-turnout data. There are two main ways to measure voter turnout: (1) as the number of votes cast as a percentage of the voting-age population (VAP turnout), or as the number of votes cast as a percentage of the number of registered voters (RV turnout). Most studies on the determinants of political participation do not explicitly discuss their choice or assume that the variation between RV and VAP turnout is negligible (Geys Reference Geys2006). Yet, this assumption might be erroneous because both measures are suboptimal proxies for “real” turnout. To illustrate, RV turnout might exclude eligible but unregistered voters, whereas VAP might include ineligible residents such as noncitizens.
In this article, we focus on migration flows or, more specifically, the number of foreigners living in a country and the number of nationals living abroad. The twenty-first century has experienced countries with numerous resident noncitizens and citizens living abroad (Castles, De Haas, and Miller Reference Castles, De Haas and Miller2013). The turnout literature (Barreto Reference Barreto2005; Cho Reference Cho1999) has established that, once naturalized, these new citizens vote in fewer numbers than natives. Yet, increasing numbers of resident noncitizens and citizens living abroad also can influence the two conventional turnout measures. We hypothesize that (1) large numbers of resident noncitizens influence VAP turnout because this measurement counts them as part of the voting-age population, despite their ineligibility to vote; and (2) high numbers of nationals living abroad might affect RV turnout if they are still on electoral lists in their country of origin. We test both hypotheses using descriptive and inferential statistics based on a large-scale global dataset (1990–2012) with RV and VAP turnout figures as the dependent variables, the percentage of foreigners living in the country and the percentage of nationals living abroad as the respective independent variables, along with relevant control variables.
HOW MIGRATION COULD BIAS VAP AND RV TURNOUT
Despite efforts to calculate voting-eligible population (VEP) turnout (McDonald and Popkin Reference McDonald and Popkin2001), RV and VAP turnout remain the dominant dependent variables in turnout studies. For example, two recent meta-analyses by Stockemer (Reference Stockemer2017) and Cancela and Geys (Reference Cancela and Geys2016) found that one of the two indicators is used in the vast majority of studies. Whereas both measures use the same numerator (i.e., valid ballots cast), they use different definitions of the population that are vulnerable to different forms of bias, as follows:
 $$RV\,Turnout = {{Number\,of\,votes\,cast} \over {Number\,of\,registered\,voters}} & VAP\,Turnout = {{Number\,of\,votes\,cast} \over {Population\,of\,voting\,age}}$$
Both sources of bias are likely to be exacerbated by migration because migrants may be erroneously included in the denominator. Because RV turnout defines the population as the number of registered voters, and voter registers often are slow to change, citizens who live abroad could introduce a downward bias if they are still counted in their former electoral district. Similarly, because VAP includes all residents of voting age, the presence of ineligible noncitizens could artificially inflate the population and deflate the measured turnout. Thus, high rates of emigration can cause RV turnout to be underreported, as will high numbers of immigrants for VAP turnout.
To demonstrate the first scenario, assume a hypothetical country that has 1 million registered voters, 100,000 of whom have left the country (and do not vote) but still appear on electoral lists. If we further assume that 500,000 votes are cast, we would have an officially reported RV turnout figure of 50%; however, the real turnout figure would be 55.56%, or 10% higher. To demonstrate the potential bias in VAP, we may instead assume 500,000 votes from a voting-age population of 1 million, 100,000 of whom are ineligible noncitizens. From this, we again obtain a VAP turnout of 50%; assuming that all citizens were eligible, we can deduct 100,000 from the denominator and again obtain a real turnout value of 55.56%.
Beyond these hypotheticals, both scenarios actually play out in the real world. For example, for RV turnout, Hill and Huskey’s (Reference Hill and Huskey2015) study of electoral turnout and labor migration in Kyrgyzstan concluded that differences in migration patterns (i.e., one third of southern households emigrated compared to few in the north) created “missing voters” in the south, thus explaining the turnout disparity between these regions, which is approximately 25%.
Beyond these hypotheticals, both scenarios actually play out in the real world. For example, for RV turnout, Hill and Huskey’s (Reference Hill and Huskey2015) study of electoral turnout and labor migration in Kyrgyzstan concluded that differences in migration patterns (i.e., one third of southern households emigrated compared to few in the north) created “missing voters” in the south, thus explaining the turnout disparity between these regions, which is approximately 25%. Similarly, Pearlman (Reference Pearlman2014) estimated that 600,000 to 1 million of Lebanon’s 3.2 million registered voters reside overseas, and few return home to vote. Furthermore, Kostelka (Reference Kostelka2015) found that emigration can explain approximately one tenth of the approximately 25% decline in turnout experienced in 10 post-communist countries following democratization. His analysis found that this includes both an artificial decline caused by outdated registers and a real decline caused by increased costs for emigrants to either return home or go to their embassy to vote. In a VAP example, approximately 25% of Israeli residents were noncitizen Palestinians, making VAP turnout grossly underestimated because it included millions of ineligible residents in its denominator (Norris Reference Norris2002). In the United States, McDonald and Popkin (Reference McDonald and Popkin2001) found that including noncitizen residents and ineligible felons caused VAP turnout numbers to be underestimated by as much as 6 percentage points.
We used these existing case studies as a starting point to determine the degree to which resident noncitizens bias VAP turnout and nationals living abroad bias RV turnout. Is there any systematic effect of migration on either VAP or RV and, if so, how can we remedy this effect?
RESEARCH DESIGN
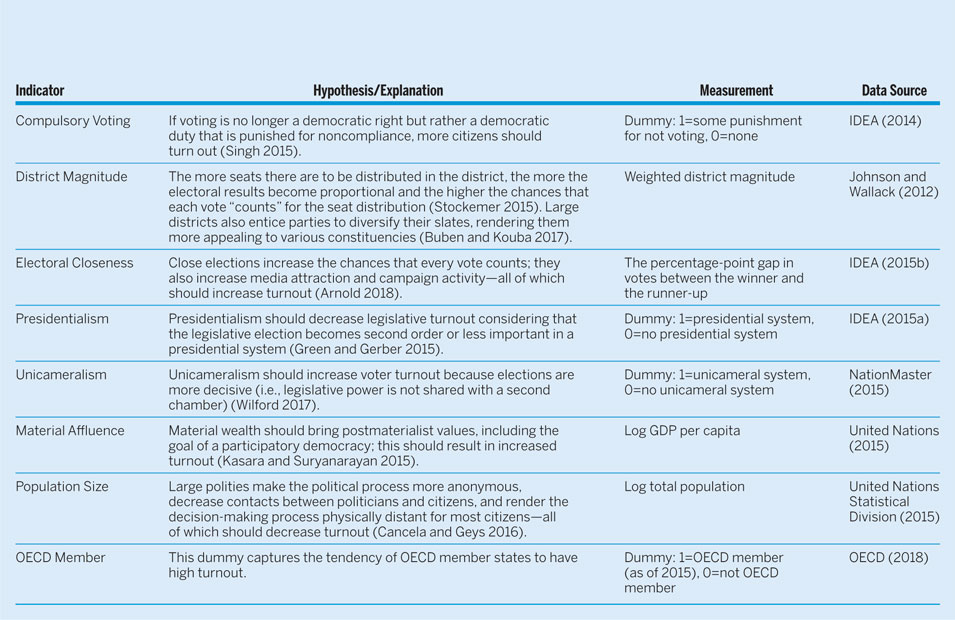
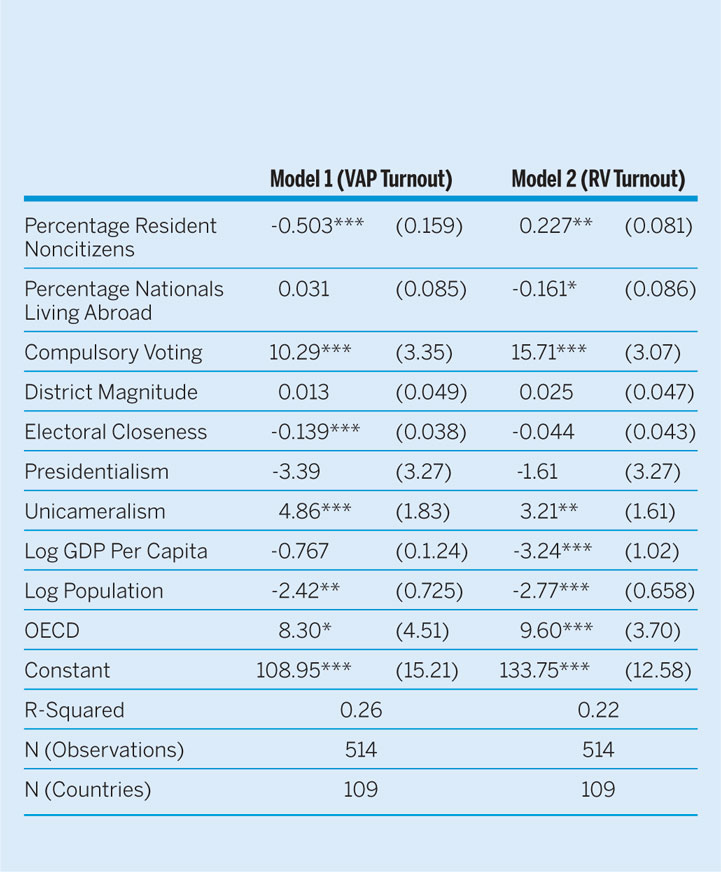
To assess the magnitude of the possible bias of migration on reported turnout, we used measures of VAP and RV turnout retrieved from the International Institute for Democracy and Electoral Assistance (IDEA) (2015b) as our two dependent variables. We regressed these on the percentage of non-nationals residing in a country and the percentage of nationals living abroad. These regressions provided the magnitude of the bias induced by migration flows on turnout. Because data for our two migration proxies were not readily available, we calculated them using data on total population size (United Nations Statistical Division 2015) and the number of resident foreigners and nationals residing abroad (United Nations Division of Economic and Social Affairs 2015). To have a full model, we also included eight institutional and sociodemographic control variables commonly used in turnout studies (table 1).
Measurement and Sourcing of Control Variables

For our analysis, we compiled these indicators into a large-scale dataset covering more than 500 elections held in democracies between 1990 and 2012. We restricted the date range to the fall of the Iron Curtain due to data availability for migration data. The restriction to democratic elections was justified on the basis that they require transparency as well as the respect of rights to speech and assembly in order to be meaningful (Collier and Vicente Reference Collier and Vicente2012). As an inclusion criterion, we used Polity IV rankings and included all country-years of six or higher (Marshall, Gurr, and Jaggers Reference Marshall, Gurr and Jaggers2016). As a result, our dataset covers a 22-year period for established democracies (e.g., Germany and Australia) and a limited period for countries (e.g., Thailand and Mali) that moved in and out of the sample of democracies during the same period. We could not include data for some particularly small countries (e.g., Samoa) because of missing data for all or some indicators.
We used these data for two types of analyses. First, we present univariate and descriptive statistics, which already indicated that some of the turnout decline could be due to measurement error of the two dependent variables. Second, we present the results of a repeated time-series cross-sectional regression—that is, a random-effects generalized least squared model (GLS) with clustered standard errors per country (Kmenta Reference Kmenta1990; White Reference White1980). For robustness checks, we present three additional models in the appendix for each of our two turnout measures. Models 3 and 6 include year dummies; models 4 and 7 exclude high immigrant/emigrant countries with more than 40% foreigners and nationals living abroad, respectively; and models 5 and 8 include year dummies and exclude countries with more than 40% foreigners and nationals living abroad, respectively.
RESULTS
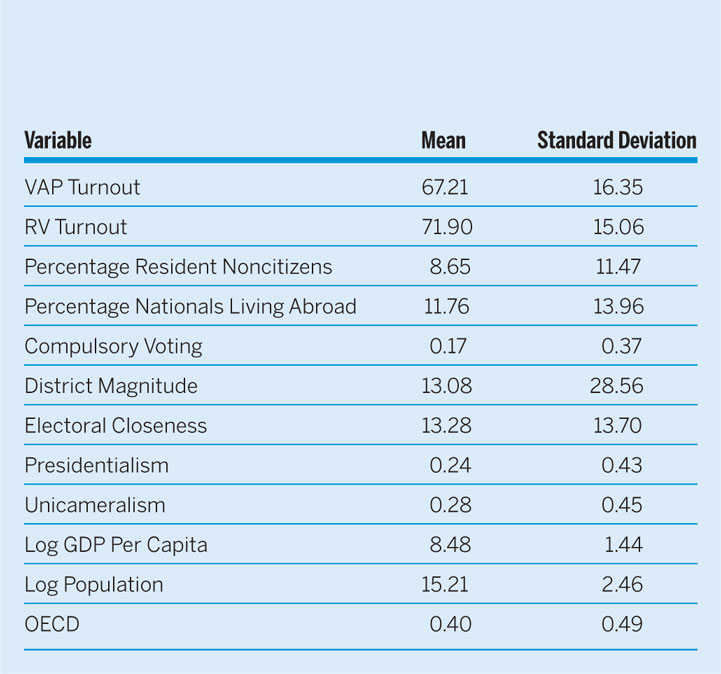
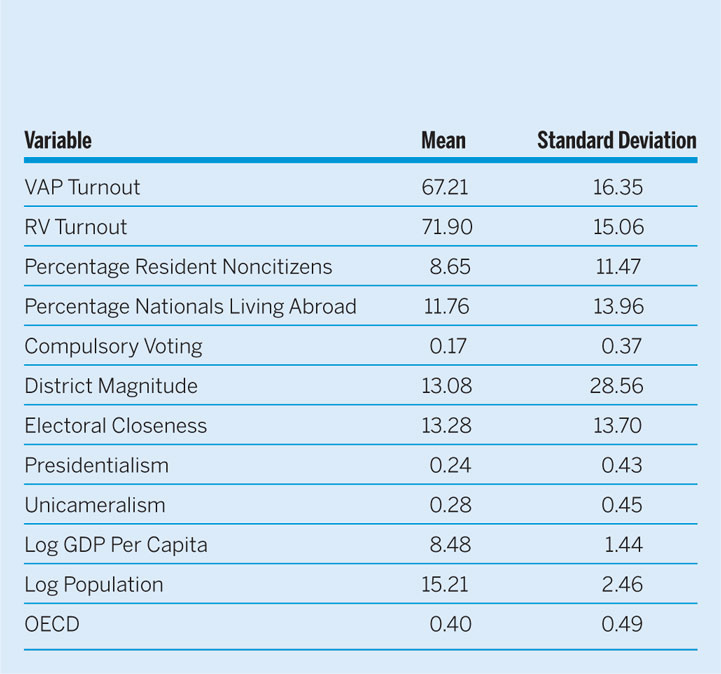
Our univariate statistics highlight that RV turnout is about 4.7 percentage points higher than VAP turnout, illustrating that the two measures have significant differences (table 2). Furthermore, the average percentage of foreigners and nationals living abroad per country is roughly 10%. Hence, there is potential that migration could trigger bias in our two indicators of electoral participation—in particular, in countries with many immigrants or emigrants.
Univariate Statistics
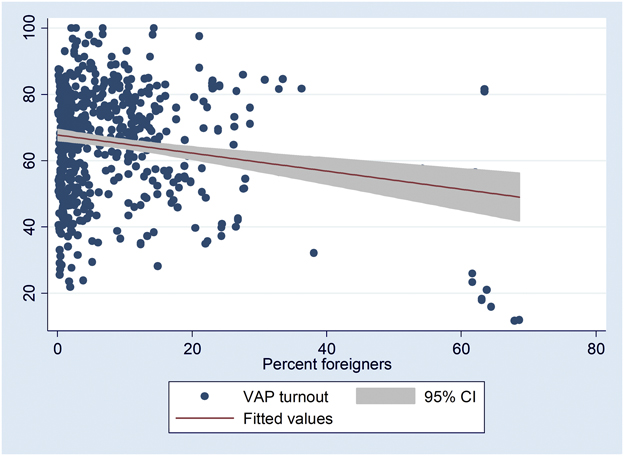
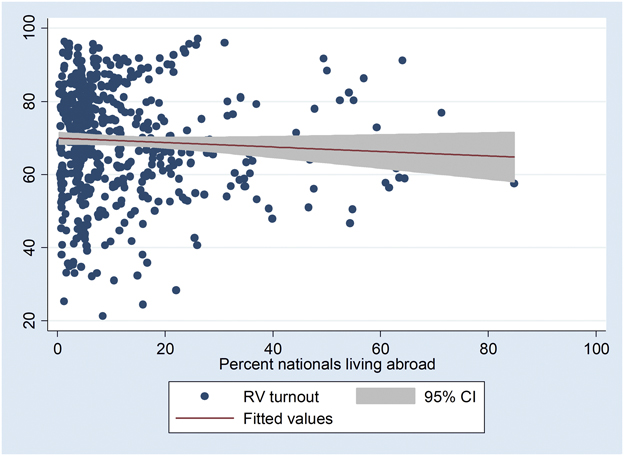
Figures 1 and 2 display the relationship between the percentage of foreigners on VAP turnout and the percentage of nationals living abroad on RV turnout, respectively. The expected relationship is found in figure 1, which displays statistically significant and negative lines, indicating that VAP turnout is lower if migration is high. In contrast, figure 2 reveals a rather flat line, illustrating that the number of nationals living abroad has only a moderate influence on RV turnout, if any. These graphs, however, show migration’s effect on measured turnout only in a bivariate analysis; for a more precise measure with adequate controls, we used two multivariate regression analyses (see table 2).
Relationship between the Percentage of Foreigners Living in a Country and VAP Turnout

Relationship between the Percentage of Nationals Living Abroad and RV Turnout

Model 1 (see table 3) seems to confirm the hypothesis that the percentage of foreigners negatively influences VAP turnout, with the regression weight substantively predicting that VAP turnout decreases by 0.5 percentage point for every 1 percentage point of non-national residents in the respective country. This implies that the reported VAP turnout would be 5 percentage points lower than the actual turnout rate in a country where 10% of residents are noncitizens.Footnote 1 This relationship is robust with the introduction of year dummies (see model 3 in the appendix). Yet, figure 2 illustrates that there are potentially several influential points or outliers (i.e., countries with more than 40% immigrants), which could drive this link between the percentage of foreigners and VAP turnout. To test the degree to which this is the case, we excluded all country-years with 40% or more foreigners (see table 4 in the appendix).Footnote 2 The results are relatively robust. The regression coefficient of the predictor percentage of foreigners remains statistically significant at the 10% level and of moderate strength. That is, the unstandardized coefficient in the model with year dummies is −0.428; in the model with year dummies and the exclusion of countries with more than 40% foreigners, it is −0.372).
We conclude that whereas specific countries, including Eastern European countries (e.g., Macedonia and Poland), may have RV turnout biased by high numbers of nationals living abroad still on the electoral lists, this is probably not a general trend and most countries appear to be accurately removing those nonresident citizens who do not specifically register.
Regression Analyses Measuring the Influence of Migration Flows on TurnoutFootnote 4
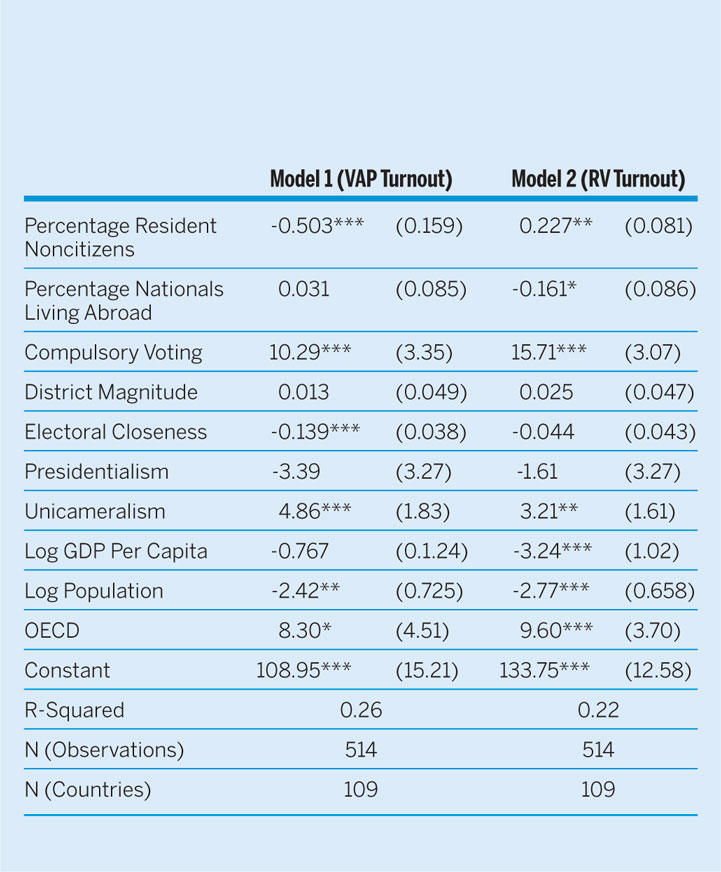
Note: Standard errors in parentheses; *p<0.10, **p<0.05, ***p<0.01 (two-tailed).
In contrast, model 2 indicates that the relationship between the percentage of nationals living abroad and RV turnout is small, with the regression coefficient statistically significant only at the 10% level and predicting a negligible 1.6-percentage-point decrease per 10 percentage points of nationals living abroad. The robustness checks in table 5 in the appendix generally confirm this small association. We conclude that whereas some specific countries, such as some Eastern European countries (e.g., Macedonia and Poland), may have RV turnout biased by high numbers of nationals living abroad still on the electoral lists, this is probably not a general trend and most countries appear to be accurately removing those nonresident citizens who do not specifically register. However, the main model also reports that the percentage of resident noncitizens seems to have a small positive association on RV turnout. The robustness checks in appendix table 5 seem to confirm this tendency.
DISCUSSION
How should we measure turnout in our models on electoral participation? The first question that researchers must ask themselves is which indicator they should use. Both indicators have concerns. If scholars opt for the VAP-turnout measure, they might not obtain comparable data if comparing countries with few and with many foreigners. For example, based on the results of this study, a country in which 20% of residents are noncitizens could underestimate VAP by up to 10 percentage points, compared to a country with no foreigners. At the least, researchers should control for this bias. One way is to add the percentage of foreigners in the voting-age population on the right-hand side in each model. This should indicate the bias induced by foreigners in turnout models, which scholars could control for in subsequent analysis. Alternatively, researchers could calculate an approximation of VEP turnout. To do so, they could deduct the number of non-nationals of voting age from the voting-age population to provide a better estimate of the voting eligible population.Footnote 3
If researchers opt for the RV-turnout measure, there is less bias induced by immigration and emigration, and the deviations induced by foreigners or non-nationals abroad are only minor. This does not exclude that emigration can influence turnout in countries with many expatriates (e.g., Lebanon and North Macedonia); however, this impact is limited overall. Nevertheless, this does not mean that the RV-turnout measure is without problems; it treats countries with automatic voter registration (e.g., Germany) similarly to countries with voluntary registration (e.g., the United States and The Bahamas). For example, in The Bahamas, around 20% of eligible voters are not registered (Brennen Center 2013). Hence, such a measure should control at least for the number of eligible voters who are not on electoral lists in countries where voter registration is not automatic.
CONCLUSION
This article focuses on the measurement of turnout. We show that international migration flows can change the measurement of turnout by introducing a significant bias into commonly used measures of turnout. Whereas the bias of nonresident citizens on RV turnout is minor in all but a few cases, the influence of resident noncitizens on VAP turnout can substantively affect the reported turnout percentage in democracies. Given this bias, the rare availability of VEP turnout figures, and the limitations of RV turnout in comparisons across countries, we offer one solution to the turnout-measurement problem. We suggest using as the denominator the voting-age population minus the number of noncitizens of voting age. Using this approximation of the percentage of eligible voters as a proxy for turnout—which, in similar form, has been calculated in one-country studies focusing on the United States (Holbrook and Heidbreder Reference Holbrook and Heidbreder2010; Wattenberg Reference Wattenberg2005)—would be a better approximation for turnout.
Finally, a word of caution is in order. Certainly, resident noncitizens are a real source of bias for VAP turnout. The same might not be true for nationals living abroad. They might be a real source of bias only if they are not removed from electoral lists at home. However, if they are removed from the list and decide to register in their foreign embassy, they might face higher costs to vote—but they should still count as registered voters. Unfortunately, the current data do not allow us to disentangle these intricacies, which is a call for renewed research on how we measure our core variable in political behavior—that is, turnout. Nevertheless, we show that the measurement of electoral participation is complicated and can induce considerable bias in the operationalization of turnout.
SUPPLEMENTARY MATERIAL
To view supplementary material for this article, please visit https://doi.org/10.1017/S104909651900101X