INTRODUCTION
Morphometric and genetic analysis are frequently used together in studies with marine invertebrates in order to assess population differentiation (e.g. Cuesta & Schubart, Reference Cuesta and Schubart1998; Brian et al., Reference Brian, Fernandes, Ladle and Todd2006; Sousa et al., Reference Sousa, Freire, Rufino, Méndez, Gaspar, Antunes and Guilhermino2007). Morphological analyses have been mostly studied by multivariate methods using sets of variables, usually linear distances or angles obtained from them. However, in the last two decades another morphological approach has been developed: geometric morphometrics (Adams et al., Reference Adams, Rohlf and Slice2004). This technique focuses on the geometry of form, capturing information about the shape of an organism more accurately (Cavalcanti et al., Reference Cavalcanti, Monteiro and Lopes1999). Genetic data have been used in several studies to determine population structure, and cytochrome oxidase I (COI) is a commonly used mitochondrial DNA gene to develop these studies (e.g. Wilding et al., Reference Wilding, Mill and Grahame1999; Mathews et al., Reference Mathews, Schubart, Neigel and Felder2002; Roman & Palumbi, Reference Roman and Palumbi2004).
Several authors have focused on the subject of shape variation in crustaceans, either with geometric morphometrics, or with the traditional biometrical analyses (e.g. Cadrin, Reference Cadrin1995; Rosenberg, Reference Rosenberg1997; Clark et al., Reference Clark, Neale and Rainbow2001; Rufino et al., Reference Rufino, Abelló and Yule2004, Reference Rufino, Abelló and Yule2006a). These studies addressed mainly species and gender differentiation as well as geographical differences. To test these shape differences, several body parts can be analysed, such as the carapace (Clark et al., Reference Clark, Neale and Rainbow2001; Rufino et al., Reference Rufino, Abelló and Yule2006a), chelipeds (Rosenberg, Reference Rosenberg1997) or mouthparts (Skilleter & Anderson, Reference Skilleter and Anderson1986). In fact, chelate appendages are amongst the most conspicuous and characteristic anatomical features of decapod crustaceans, and several aspects have already been studied: biomechanics of chelipeds in some decapod crustaceans, such as cancrid crabs (Taylor et al., Reference Taylor, Palmer and Barton2000) and portunid, grapsid, xanthid and ocypodid crabs (Brown et al., Reference Brown, Cassuto and Loos1979; Lee, Reference Lee1995); development of asymmetry and claw shape variation in several species of ocypodids (Ahmed, Reference Ahmed1978; Weissburg, Reference Weissburg1991; Levinton et al., Reference Levinton, Judge and Kurdziel1995; Rosenberg, Reference Rosenberg2002) and heterochely and handedness in portunids (Abby-Kalio & Warner, Reference Abby-Kalio and Warner1989; Smith, Reference Smith2004) and ocypodids (Barnwell, Reference Barnwell1982); feeding behaviour and manipulation of diet (Smith & Palmer, Reference Smith and Palmer1994; Smith, Reference Smith2004); and agonistic interactions (Keiser et al., Reference Kaiser, Hughes and Reid1990; Lee, Reference Lee1995).
Heterochely, i.e. the two chelae differ in size and/or in shape (being thus referred to as major and minor chelae), is common in the Brachyura (Hartnoll, Reference Hartnoll and Abele1982). Usually both sexes show heterochely, and generally the difference between chelae is more exaggerated in the male. This gender body asymmetry has its extreme in the males of all fiddler crabs (genus Uca), which have a small slender claw used for feeding and a large major claw employed in waving display and in agonistic interactions (Crane, Reference Crane1975). Furthermore, in most crabs the major chela is located on the right-hand side (Ng & Tan, Reference Ng and Tan1985; Abby-Kalio & Warner, Reference Abby-Kalio and Warner1989; Abello et al., Reference Abelló, Pertierra and Reid1990; Yamaguchi & Tokunaga, Reference Yamaguchi and Tokunaga1995). However, right-handedness crabs co-exist with a minority of left-handed specimens, and it is thought to be due to the reversal of handedness following the loss of the major chela from the right-hand side (Abby-Kalio & Warner, Reference Abby-Kalio and Warner1989). Callinectes sapidus (Hamilton et al., Reference Hamilton, Nishimoto and Halusky1976), Carcinus maenas (Abby-Kalio & Warner, Reference Abby-Kalio and Warner1989) Pilumnus hirtellus (Abby-Kalio & Warner, Reference Abby-Kalio and Warner1989), Uca vocans and Uca tetragonon (Barnwell, Reference Barnwell1982) are examples of species that have right-handedness, in a proportion of approximately 80/20. The opposite also occurs, with the species Ocypode gaudichaudii presenting 95% of individuals left-handed (Trott, Reference Trott1987). Xantho exaratus (Abby-Kalio & Warner, Reference Abby-Kalio and Warner1989), Ocypode quadrata (Haley, Reference Haley1969) and most species of the genus Uca (Rosenberg, Reference Rosenberg2001) have equal numbers of right- and left-handed males. Homochely also occurs in several brachyuran crabs. In this case, chelipeds are monomorphic, both left and right claws being identical in size and structure. Pachygrapsus crassipes (Brown et al., Reference Brown, Cassuto and Loos1979), Leptograpsus variegatus (Skilleter & Anderson, Reference Skilleter and Anderson1986) and Sesarma ayatum (Schubart et al., Reference Schubart, Reimer and Diesel1998) are typical examples showing this morphology.
Still, crab chela shape and size are highly plastic and change according to diet (Smith & Palmer, Reference Smith and Palmer1994) and parasitism (Hartnoll, Reference Hartnoll and Abele1982), for example. The study undertaken by Smith & Palmer (Reference Smith and Palmer1994) showed that manipulation of the diet of Cancer productus resulted in a differential development of the chela (crabs fed with shelled mussels developed significantly larger and stronger chelae than crabs fed with unshelled mussels). These findings suggest that chela size and shape are phenotypically plastic, and that this plasticity towards such use-induced effects or other environmental factors could be inheritable, influencing the evolution of cheliped size and structure (Lee, Reference Lee1995). Also, prey size selection plays an important role in claw mechanics and shape, as generalist crabs possess slender claws with fine denticles and specialist crabs possess at least one powerful claw with broad molars (Yamada & Boulding, Reference Yamada and Boulding1998).
Geometric morphometrics is a technique that allows a precise analysis of the differences and resemblances described above. Small morphometric variations can actually be determined with high accuracy, and thus it permits to detect differences not found by classic morphometry (e.g. Rufino et al., Reference Rufino, Gaspar, Pereira and Vasconcelos2006b). Due to the selective pressures that morphological characters are under, it is important to investigate which chela is the most suitable to use in these morphometric studies, when the goal is to determine population differentiation.
It is important to understand if patterns of differentiation have a genetic basis, or if they are of phenotypic nature. Thus, it can be deduced if differences are due to barriers in gene flux or to ecological pressures. Furthermore, in some cases, trophic morphology is considered to be under strong genetic control (Carrol & Dingle, Reference Carrol and Dingle1996), while in other instances trophic variation results from diet-induced phenotypic plasticity (Smith, Reference Smith2004).
Thus, the purpose of the present work was to investigate which chela is the most suitable to use in a population differentiation study of brachyuran crabs, using geometric morphometric methods (landmark and sliding landmark analyses). To corroborate the results achieved with the geometric morphometrics a genetic analysis of the data was made, using the mitochondrial DNA gene COI as a marker.
Two species were used as models for the present study: Carcinus maenas, with heterochely and sexual dimorphism (Abby-Kalio & Warner, Reference Abby-Kalio and Warner1989), and Pachygrapsus marmoratus, a homochelous species (Cannicci et al., Reference Cannicci, Gomei, Boddi and Vannini2002).
MATERIALS AND METHODS
Model organisms
Carcinus maenas (Portunidae) is the most common crab in European estuaries, widely distributed in intertidal and subtidal shallow environments (Paula et al., Reference Paula, Silva, Francisco and Flores2006) on both hard and soft-bottom substrata. From its original distribution along the Atlantic coast of Europe and northern Africa, from north Norway and Iceland to Mauritania (Clark, Reference Clark1986), the species has established populations in South Africa (Le Roux et al., Reference Le Roux, Branch and Joska1990), Australia and Tasmania (Zeidler, Reference Zeidler1978), Japan and both coasts of North America (Grosholtz & Ruiz, Reference Grosholz and Ruiz1995; Roman & Palumbi, Reference Roman and Palumbi2004). Carcinus maenas is an omnivorous crab and, as it grows, the composition of its diet shifts from primarily plants and soft-shelled prey to mainly hard-shelled bivalves and gastropods (Elner, Reference Elner1981; Smith, Reference Smith2004). Along the Portuguese coast, C. maenas has a discontinuous distribution, being mainly associated to estuarine ecosystems.
Pachygrapsus marmoratus (Grapsidae) exhibits semi-terrestrial habits and inhabits the intertidal rocky shores of southern Europe. It is reported from the Black Sea, the Mediterranean, the Moroccan Atlantic, the Islands of Canaries, Madeira and Azores, from the Atlantic coast of Portugal, Spain and France and has been reported in southern coastal waters of the British Isles (Ingle & Clark, Reference Ingle and Clark2006). Cannicci et al. (Reference Cannicci, Gomei, Boddi and Vannini2002) showed that P. marmoratus is an omnivorous species, but cannot be considered an opportunistic feeder. Algal (filamentous and calcareous algae, and corticated macroalgae) and animal (limpets, mussels and conspecific crabs) components were almost equally found in its diet. Pachygrapsus marmoratus is present in high densities along the Portuguese coast and has a continuous distribution along its latitudinal gradient in association with rocky coasts.
Study sites and collection methods
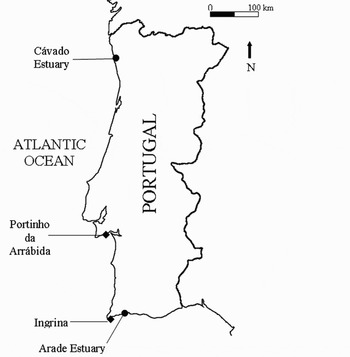
Specimens of Pachygrapsus marmoratus were collected from the mid-to-upper intertidal zone of two wave-protected rocky sites from Portugal: the central coast at Portinho da Arrábida (38º 28′ 33.96″ N; 8º 59′ 04.63″ W), and the Algarve at Ingrina (37º 02′ 48.59″ N; 8º 52′ 47.18 ″ W) (Figure 1). Since P. marmoratus is mainly active at night (Cannicci et al., Reference Cannicci, Paula and Vannini1999) collections at both sites were made by hand during nocturnal spring low tides. From Portinho da Arrábida 82 males and 64 females were collected and 57 males and 44 females at Ingrina.
Map of Portugal showing collection sites of Carcinus maenas (•) and Pachygrapsus marmoratus (♦).

Collections of Carcinus maenas were made in two Portuguese estuaries. On the north coast, samples were collected in the Cávado Estuary (41º 31′37.44″ N; 8º 46′ 49.29″ W; Figure 1), using baited traps, during diurnal neap high tides. In the south coast, specimens were collected in creeks of the Arade Estuary (37º 08′43.66″ N; 8º 30′ 52.14″ W; Figure 1) using bottom nets trawled during the diurnal low tide, in a spring tide event.
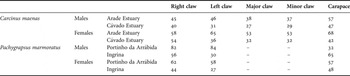
After collection, specimens were transported to the laboratory where they were frozen for preservation. Specimens were separated by sex, labelled and the chelae analysed in order to eliminate those that were not fit (regenerated and/or broken claws) for the study. The number of specimens analysed is presented in Table 1. For C. maenas the following characters were used: the left side of the carapace, and the right, left, major and minor claws of both genders. In P. marmoratus it was the left side of the carapace, the right and left claws of both sexes. In the latter species, claws were not analysed as major and minor, due to the lack of size differences in between.
Number of specimens analysed from each location.

For the genetic analysis, specimens were preserved in liquid nitrogen, immediately after collection, and in the laboratory all material was kept at –80ºC until the analyses were performed.
Geometric morphometric analysis
Claw shape was analysed using landmark-based geometric morphometric methods (Rohlf & Marcus, Reference Rohlf and Marcus1993). Claws were digitized using a Canon Power Shot A85 digital camera with a resolution of 4.0 megapixels, always with the specimens in the same position. Photographs were taken in a camera stand with a base board with a printed fine grid. This base had a graduated arm, with an adjustable camera holder. Images were also taken with a scale, with the same focal distance and using the optical zoom to avoid possible distortions. To facilitate claw digitization, all chelipeds were severed between the propodal and carpal segments. Males and females of both species in the study were analysed separately.
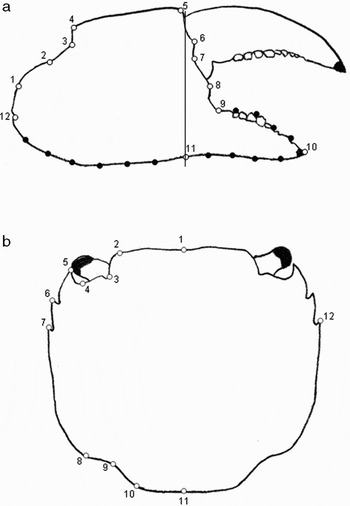
Pachygrapsus marmoratus claw shape variables were obtained using 12 landmarks, as shown in Figure 2. To capture shape differences in zones of the chela where it was not possible to define homologous landmarks, a series of 14 sliding semi-landmarks were digitized in the upper margin of the pollex and in the ventral margin of the chela. The approximate locations of these semi-landmarks are presented in Figure 2A. Sliding semi-landmarks are not true landmarks, as they only exist in the context of a group average, but provide anyway a richer description of shape (Adams et al., Reference Adams, Rohlf and Slice2004; Zelditch et al., Reference Zelditch, Swiderski, Sheets and Fink2004; Macholán, Reference Macholán2006). To fully evaluate the possible significance of cheliped shape variation, carapace form was also analysed. Figure 2B also shows the location of the 12 landmarks selected for the carapace. Only one side of the carapace (the left) was used to avoid duplication of equivalent landmarks and computation problems (Rufino et al., Reference Rufino, Abelló and Yule2004).
Landmarks (○) and semi-landmarks (•) used in this study to evaluate shape variation in (A) claws and (B) carapace of Pachygrapsus marmoratus.

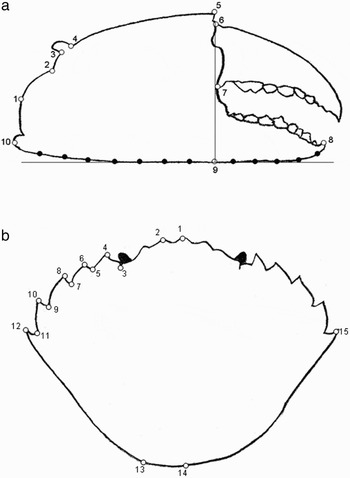
Figure 3A shows the locations of the 10 landmarks identified for the geometric morphometric analysis of Carcinus maenas. Twelve semi-landmarks were also digitized to better capture possible shape variations between specimens (Figure 3A). With the same goal defined for P. marmoratus, the shape of the carapace in C. maenas was also studied. From the digitized images of each carapace, x and y coordinates of 15 landmarks were recorded (Figure 3B). Again, only the left side of the carapace was used to mark the landmarks.
Landmarks (○) and semi-landmarks (•) used in this study to evaluate shape variation in (A) claws and (B) carapace of Carcinus maenas.

As suggested by Rosenberg (Reference Rosenberg2002), all the previous landmarks were chosen for their easy identification and homology in all specimens and the suitability of the landmarks to capture the general shape of the chela. Landmarks x and y coordinates of each photograph were digitized using the program TpsDig2 (Rohlf, Reference Rohlf2006a).
Landmarks were aligned using the Generalized Procrustes Analysis (GPA) procedure to remove non-shape variation in the landmark coordinates, by scaling all specimens to unit size, translating them to a common location, and rotating them so that their corresponding landmarks line up as closely as possible (Rohlf & Slice, Reference Rohlf and Slice1990; Kassam et al., Reference Kassam, Adams, Hori and Yamaoka2003). As a result of this alignment a mean landmark configuration was obtained (consensus). From the aligned specimens, partial warp scores (non-uniform component) and uniform components were estimated. A relative warp analysis (similar to a principal component analysis) was made to the non-uniform component, thus generating a new set of shape variables. In order to weight all landmarks equally the scaling option α = 0 was used. The uniform and non-uniform components were than used in the statistical analyses to compare shape change within and between populations. The above analysis was done using TpsRelw (Rohlf, Reference Rohlf2006b). More details on the procedures of geometric morphometrics can be found in Adams et al. (Reference Adams, Rohlf and Slice2004).
Multiple regression analysis was performed with TpsRegr (Rohlf, Reference Rohlf2005) to detect allometry. This method for removing size effects involves the regression of each shape variable (the relative warps) against a measure of body size and estimating residual shape variation. These residual values are thus obtained from the multiple regression equation. The measure of body size used was the centroid size, which is defined as the square-root of the sum of the squared distances between each landmark and the centroid of the landmark configuration.
To access the degree of morphometric differentiation between populations, a multivariate analysis of variance (MANOVA) was performed on the relative warp scores together with the uniform component. For both species, the variance of each shape variable and subsequently of each chela was calculated to determine which claw presents less variation within populations. For this analysis the Carcinus maenas population from the Arade Estuary (CARA) and the Pachygrapsus marmoratus population from Portinho da Arrábida (PPOR) were used. Shape variations along the first and second axes were described using thin-plate spline deformation grids, generated with TpsRelw (Rohlf, Reference Rohlf2006b).
Genetic analysis
Total genomic DNA was extracted from the muscle of the 5th pereopod of 10 specimens of each species in the study, following the standard SDS-proteinase K/phenol-chloroform protocol (Hillis et al., Reference Hillis, Mable, Larson, Davis, Zimmer, Hillis, Moritz and Mable1996). Amplification of a 675 basepair fragments from the cytochrome oxidase subunit I (COI) gene for Pachygrapsus marmoratus was accomplished by polymerase chain reaction (35 cycles of 1 minute at 94ºC, 1 minute at 50ºC and 2 minutes at 72ºC). The PCR mixture in 25 µl of final volume contained: 2.5 µl 10x reaction buffer, 3.0 mM MgCl2, 0.2 mM dNTPs, 5 µl betaine, 0.2 unit Taq DNA polymerase and 0.5 mM of each primer (LCO1490 5′-GGT CAA CAA ATC ATA AAG ATA TTG G-3′, HCO2198 5′-TAA ACT TCA GGG TGA CCA AAA AAT CA-3′, developed by Folmer et al., Reference Folmer, Black, Hoeh, Lutz and Vrijenhoek1994). Primers internal to those produced by Folmer et al. (Reference Folmer, Black, Hoeh, Lutz and Vrijenhoek1994) were designed by Roman & Palumbi (Reference Roman and Palumbi2004) for Carcinus maenas and used in this study (5′-GCT TGA GCT GGC ATA GTA GG-3′, 5′-GAA TGA GGT GTT TAG ATT TCG-3′). According to Roman & Palumbi (Reference Roman and Palumbi2004) reaction mix included 2.5 µl 10x buffer, 1.5 mM MgCl2, 0.5 mM dNTPs, 0.4 unit Taq DNA polymerase, and 1 µM of each primer. Conditions for selective amplification of this 502-basepair fragment of the mitochondrial COI gene were: 30 cycles of 1 minute at 94ºC, 1 minute at 50ºC and 1 minute at 72ºC. PCR products were purified using the GFXTM PCR kit (Amersham DNA and Gel Band Purification kit). Samples were sequenced in the forward and reverse direction using an ABI PRISM 3700 DNA analyser at Macrogen (www.macrogen.com).
Sequences were aligned using the software BioEdit, version 5.0.9.1 (Hall, Reference Hall1999). Haplotype (h) and nucleotide diversity (π) (Nei, Reference Nei1987) were calculated from the sequences. A minimum spanning network (MSN) was constructed using the number of substitutions between haplotypes (Excoffier & Smouse, Reference Excoffier and Smouse1994). A hierarchical analysis of molecular variance (AMOVA; Excoffier et al., Reference Excoffier, Smouse and Quattro1992) was made to access possible patterns of genetic differentiation between populations. Significance of the variance components and associated F st statistics were tested using 1000 non-parametric random permutations.
ARLEQUIN v.2.0.1.1 (Schneider et al., Reference Schneider, Roessli and Excoffier2000) was used to perform all numerical analyses.
RESULTS
Shape variation analysis within a population
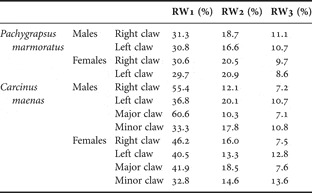
Table 2 presents the percentage of variation accounted for relative warps 1, 2 and 3 (RW1, RW2 and RW3). In Pachygrapsus marmoratus, for both males and females, these first three axes explained a higher amount of shape variation in the right claw. This same pattern was encountered in the females of Carcinus maenas, whereas in the males, it was the major claw that exhibited a higher percentage of shape variation explained by RW1, RW2 and RW3.
Percentage of variance explained by the fist three relative warps.

Variances of each shape variable were determined to access variation within a population and also to backup the results from the PCA. For both genders of P. marmoratus the right chela presented lower values of variance (0.001918 for females and 0.001623 for males). For males of C. maenas, it was the major chela that presented the lowest variance (0.001805), whilst in the females it was the right chela (0.001920).
Shape variation analysis between populations
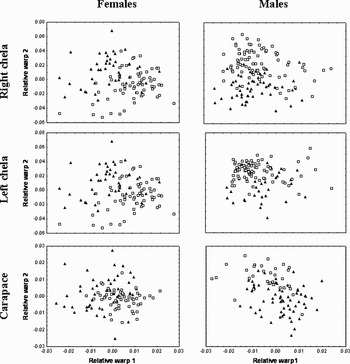
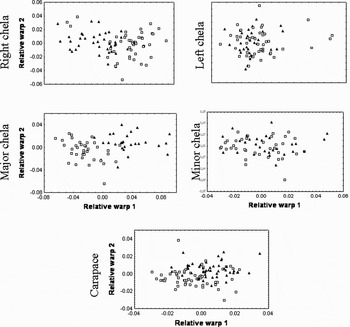
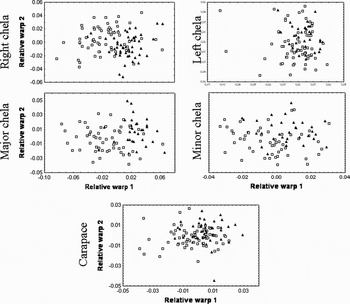
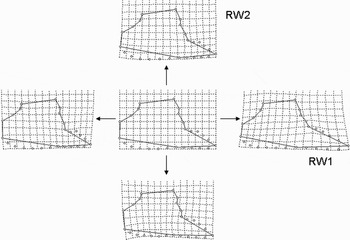
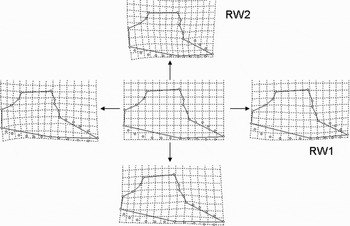
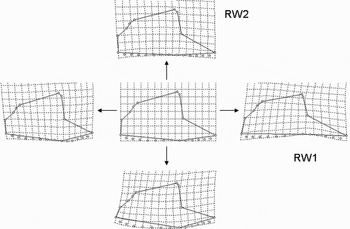
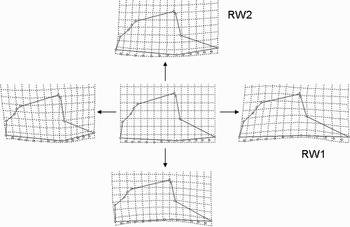
A MANOVA revealed significant differences among populations for both chelae in Pachygrapsus marmoratus (males right chela: Wilks' λ = 0.2807, P < 0.0001; males left chela: Wilks' λ = 0.2274, P < 0.0001; females right chela: Wilks' λ = 0.2761, P < 0.0001; females left chela: Wilks' λ = 0.1371, P < 0.0001). These differences were also encountered when comparing the shape variation of the carapace (Wilks' λ = 0.3946, P < 0.0001). The same analysis was performed for Carcinus maenas, and significant differences between populations were found in the right and major chelae and in the carapace of both genders (males right chela: Wilks' λ = 0.1390, P < 0.0001; males major chela: Wilks' λ = 0.1243, P < 0.0001; males carapace: Wilks' λ = 0.6808, P < 0.0001; females right chela: Wilks' λ = 0.2006, P < 0.0001; females major chela: Wilks' λ = 0.1599, P < 0.0001; females carapace: Wilks' λ = 0.4624, P < 0.0001). These differences among populations are illustrated in Figures 4, 5 & 6. To visualize shape variation between populations, TPS deformation grids were generated (Figures 7, 8, 9 & 10). From the deformation grids, PPOR right chelae were found to have a broader manus, whereas in PING population it seems to be narrower. CESP female right chelae have a wider polex and the ventral margin of the chela is less concave when comparing with CARA female right chelae. CESP and CARA male major chelae also exhibited this pattern of shape differences.
Pachygrapsus marmoratus. Scatterplots of individual scores from the relative warp analysis (RW1 × RW2) for right and left chelae from both sexes. ▴ PING, Ingrina Beach; □ PPOR, Portinho da Arrábida.

Carcinus maenas males. Scatterplots of individual scores from the relative warp analysis (RW1 × RW2) for right and left chelae from both sexes.▴ CESP, Cávado Estuary; □ CARA, Arade Estuary.

Carcinus maenas females. Scatterplots of individual scores from the relative warp analysis (RW1 x RW2) for right and left chelae from both sexes. ▴ CESP, Cávado Estuary; CARA, □ Arade Estuary.

Pachygrapsus marmoratus males. Relative warps 1 and 2 for the species means of the right chela. The centre configuration illustrates the mean right chela shape, the other configurations illustrate the shape change along each axis in the direction indicated by the arrows.

Pachygrapsus marmoratus females. Relative warps 1 and 2 for the species means of the right chela. The centre configuration illustrates the mean right chela shape, the other configurations illustrate the shape change along each axis in the direction indicated by the arrows.

Carcinus maenas males. Relative warps 1 and 2 for the species means of the major chela. The centre configuration illustrates the mean major chela shape, the other configurations illustrate the shape change along each axis in the direction indicated by the arrows.

Carcinus maenas females. Relative warps 1 and 2 for the species means of the right chela. The centre configuration illustrates the mean right chela shape, the other configurations illustrate the shape change along each axis in the direction indicated by the arrows.

Genetic analysis
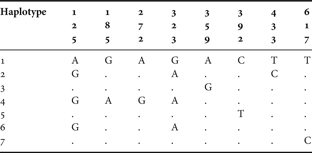
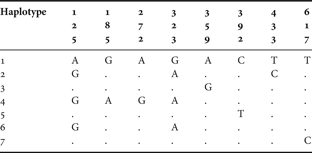
Segments of COI were successfully sequenced in all specimens from the four populations of both species in the study (40 specimens in total). For Pachygrapsus marmoratus, the nucleotide composition was biased, with a deficit of cytosine and guanine (20.68% and 18.02%, respectively) when compared to adenosine (24.99%) and thymine (36.31%). Sequences comprised 8 variable positions as shown in Table 3, revealing 7 haplotypes. Overall haplotype diversity (h ± SE) was estimated in 0.578 ± 0.101. The centre population revealed a higher number of haplotypes (Reference Barnwell6), thus presenting a higher value of haplotype diversity (h ± SE = 0.778 ± 0.137). The southern population showed a lower number of haplotypes (Reference Adams, Rohlf and Slice3), thus resulting in a haplotype diversity of 0.378 ± 0.181. Haplotypes differed by 1 to 5 substitutions, leading to estimates of pairwise divergence from 0.15% to 0.74%. Low nucleotide diversity between the 20 sequences (π ± SE = 0.0025 ± 0.0018) reveals a high similarity between them.
Pachygrapsus marmoratus. Variable nucleotide sites of the COI mitochondrial DNA gene sequence in 10 specimens.
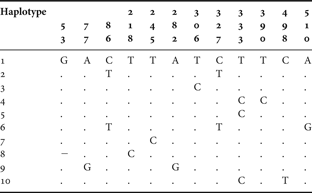
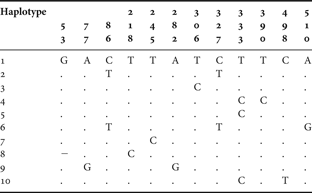
The same biased nucleotide composition was found in the populations of Carcinus maenas: 16.83% of cytosine, 19.62% of guanine, 27.13% of adenosine and 36.42% of thymine. The analysis of 20 sequences of the mitochondrial gene COI from 2 populations revealed the existence of 10 haplotypes and a high haplotype diversity of 0.856 ± 0.1. The northern population showed a higher number of haplotypes (Reference Brian, Fernandes, Ladle and Todd7) and, therefore, a higher haplotypic diversity (h = 0.933 ± 0.062). The southern population presented 5 haplotypes, which resulted in a haplotypic diversity of 0.778 ± 0.137. Only haplotypes 1, 2 and 3 are shared by the two populations. Haplotypes 4, 5, 6 and 7 correspond to unique haplotypes from the northern populations, whilst haplotypes 8, 9 and 10 were only found in the southern population.
The northern population was characterized by higher nucleotide diversity (0.00447 ± 0.00293 versus 0.00280 ± 0.00205), reflecting higher number of mutations between haplotypes. Sequence divergence between haplotypes is not higher than 1%, ranging from 0.2% to 1%, since 3 of 10 haplotypes vary with respect to haplotype 1 by one substitution (Table 4).
Carcinus maenas. Variable nucleotide sites of the COI mitochondrial DNA gene sequence in 10 specimens.
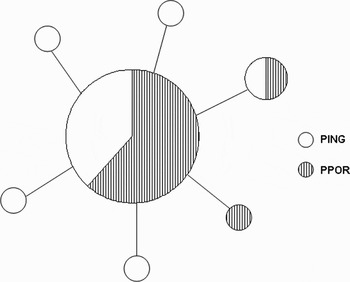
A minimum spanning network was constructed connecting all haplotypes on the basis of the least number of substitutions for both species in this study (Figures 11 & 12). The obtained networks show a star-like shape, with most haplotypes being connected by few mutation steps. Both species were characterized by one frequent haplotype, shared among population samples, and from several rare ones, present in one individual in a specific population. AMOVA revealed a low correlation between haplotypes of each population when compared with the overall group of haplotypes (P. marmoratus: Fst = 0.0207, P = 0.2101 ± 0.0126; C. maenas: Fst = 0.0166, P = 0.3206 ± 0.014). This suggests an absence of population differentiation, and statistically supports the pattern presented by the minimum spanning networks.
Pachygrapsus marmoratus. One of the possible minimum spanning networks presenting the relationships between haplotypes determined from a fragment of the COI mitochondrial DNA gene. Circles represent haplotypes and its area represents haplotypic frequency. The line connecting haplotypes indicates that a single substitution separates haplotypes. If more than 1 substitution separates two haplotypes, the number is given by the number of vertical bars on the line.

Carcinus maenas. One of the possible minimum spanning networks presenting the relationships between haplotypes determined from a fragment of the COI mitochondrial DNA gene. Circles represent haplotypes and its area represents haplotypic frequency. The line connecting haplotypes indicates that a single substitution separates haplotypes. If more than 1 substitution separates two haplotypes, the number is given by the number of vertical bars on the line.

DISCUSSION
The combination of morphometric methods with molecular data showed to be useful for the present study, contributing to the clarification of the causes of claw shape variation, and its morphological structure when analysing right, left, minor or major claws.
When conducting morphological studies on chelae of decapod crustaceans it is difficult to decide which to use. According to the literature, decapods can be homochelous or heterochelous. In this last case, the major chela can be the right or the left, and this difference might be also influenced by the gender.
Pachygrapsus marmoratus is a homochelous crab, the claws being approximately the same size in both sexes. According to this study, for both sexes, the differences in the shape of right and left chelae discriminate two populations that are 170 km apart. The results of the principal component analysis performed on the data and the study on the variance of the shape variables (size-adjusted relative warps) showed that the right claw is probably more suitable to use when the goal of the study is to compare samples. This can be stated because the first three axes of the relative warp analysis explained a slightly higher percentage of variation, and also because this chela presented a smaller variance within a sample (population). Thus, the distances between specimens of the same population due to shape differences is shorter. However, these differences are slender, probably because of the homochely of this species. Pachygrapsus marmoratus has claws with spoon-like tips typical of many herbivorous species of its family and other algae-grazing crabs (Coen, Reference Coen1988). These spoon-tipped claws are also considered to be good tools for scraping algal matter from hard substrata (Coen, Reference Coen1988). Both claws are used in foraging and manipulation of potential animal preys (Cannicci et al., Reference Cannicci, Gomei, Boddi and Vannini2002), and in Leptograpsus variegatus, a species from the same family, it was observed both chelae passing the plucked food material to the mouthparts (Skilleter & Anderson, Reference Skilleter and Anderson1986). Previous studies have shown that body form is often correlated with diet-foraging behaviour (Cavalcanti et al., Reference Cavalcanti, Monteiro and Lopes1999; Trapani, Reference Trapani2003). Thus, both claws are used for the same aim and with the same frequency, and that is probably why there are no major differences between them.
Carcinus maenas is a different case. Since it presents heterochely, the approach on what claw to use in morphometric studies is more complex. In many heterochelous crab species it has been found that the major chela is usually on the right-hand side. Normally both sexes of heterochelous species show heterochely, but sexual dimorphism of the chelae—in which males have overall larger chelae than equivalent sized females—is also usually present (e.g. in C. maenas) (Abby-Kalio & Warner, Reference Abby-Kalio and Warner1989). This is somehow corroborated by our results, since different patterns were achieved for males and females. Both male and female left and minor claws did not show sufficient shape variation to differentiate two populations that are approximately 620 km apart. However, shape of the right and major chelae of both sexes was different in these two populations. Male major chela presented the highest percentage of explained variation in the first three axes of the relative warp analysis and also a smaller variance within populations. The higher proportion of right-handed individuals (80%) found by Abby-Kalio & Warner (Reference Abby-Kalio and Warner1989) in their study about heterochely and handedness in C. maenas, associated with our own results, can lead to the conclusion that it is not correct to use the right or the left chelae in differentiation studies. If studies are only focused on the right chela, there is a high probability of mixing minor and major claws, which have considerable shape differences (Hartnoll, Reference Hartnoll and Abele1982). Thus, differences found in a population differentiation study that uses the right or the left claw as the object of shape variation, can be due to this erroneous comparison of major and minor claws.
According to our morphometric results, it is possible to say that the male major chela is the more suitable to use in studies of population differentiation. It was this chela that best separated the populations sampled, and that presented less intrapopulation variation. The same results would be expected for the females, but it was the right chela which presented them. In fact, females have a less pronounced differentiation between major and minor chelae (Abby-Kalio & Warner, Reference Abby-Kalio and Warner1989), and this, added to a possible biased sample towards right-handed specimens, can explain the results.
Heterochely in C. maenas is related to the different functions of major and minor claws. One of the functions of the minor chela is to manipulate food (Abby-Kalio & Warner, Reference Abby-Kalio and Warner1989), whereas the major claw is specialized in a larger, more powerful crusher tool for breaking shells of bivalves and gastropods, common components of its diet (Elner, Reference Elner1981). Shell-breaking ability is directly correlated to claw closing force, which varies among species as a function of the size, leverage properties and dentition of the claw, and the type and angle of pinnation of the claw's closer muscle fibres (Schenk & Wainwright, Reference Schenk and Wainwright2001; Smith, Reference Smith2004). Thus, claw size and strength can be developmentally sensitive to diet (Smith & Palmer, Reference Smith and Palmer1994). In fact, Smith (Reference Smith2004) observed in his study that differences in claw size were limited to the major crusher claw in both sexes, and the size of the minor cutter claw did not differ between regions. He related this geographical variation in major claw size with diet-induced plasticity, corresponding to a latitudinal cline in breakage resistance of Littorina obtusata (the difference in manus volume between two populations of C. maenas was consistent with the diet-induced differences observed). The same pattern was found in our study: the shape variation of the minor chela was not sufficient to separate the two populations, and, on the other hand, the analysis performed on the major chela was capable to detect significant differences between both populations. The major claw showed more conservative results, since it presented the smallest intrapopulation variation. Thus, the major chela can best differentiate populations by shape variation, but the patterns of this variation can be due to trophic responses.
Size and shape of chelae can also be affected by parasitism (Hartnoll, Reference Hartnoll and Abele1982). Rhizocephalan barnacles (e.g. Sacculina spp.) have marked effects on the relative growth of secondary sexual characters, such as the cheliped, probably related to the general suppression of sexual expression, or even castration, of the host (Lee, Reference Lee1995). As it was studied by Lee (Reference Lee1995), the impact of infection by Sacculina sp. on the sexual expression in the portunid Liocarcinus holsatus can be seen in the significantly smaller height of the master chela in infected males compared with that of the uninfected population.
The results of the genetic analysis corroborate the importance of the environmental interactions. The lack of interpopulational genetic differentiation is somehow expected in P. marmoratus due to its continuous distribution along the coast and for having a dispersive planktonic larval phase (Hines, Reference Hines1986). This kind of distribution and dispersion favours gene flow (Cook et al., Reference Cook, Bunn and Hughes2002), and promotes genetic homogenization between populations. Similar results were obtained for several marine invertebrate species with continuous distributions along a geographical gradient (Andrade et al., Reference Andrade, Magalhães and Solferini2003; Sotka et al., Reference Sotka, Wares, Barth, Grosberg and Palumbi2004). Divergences detected between haplotypes of both populations of P. marmoratus (0.15%–0.74%) resemble those found, for the same COI gene, in Penaeus chinensis (0.12%–0.36%), a decapod crustacean with a continuous wide range distribution and high migration rates (Quan et al., Reference Quan, Lü, Zhuang, Dai, Deng and Zhang2001). Hunt (Reference Hunt1993) considers that dispersion of planktonic larvae among populations of several marine species is responsible for low levels of genetic variation between them. The absence of genetic structure between populations of marine species can thus be explained by high dispersion potentials, which allow a sufficient migration level to prevent interpopulational divergence (Neigel, Reference Neigel1994).
No differentiation could also be determined in C. maenas populations when analysing COI sequences. As P. marmoratus larvae, shore crab larvae disperse in the plankton for up to 50 days (Tresher et al., Reference Tresher, Proctor, Ruiz, Gurney, MacKinnon, Walton, Rodriguez and Bax2003), which should distribute the larvae throughout the region, and the lack of genetic differences can thus be explained. As it can be seen in Figure 12, minimum spanning networks have a star-like shape and haplotypes within each population are closely related and cluster together. Star-like shape suggests the absence of population structure, where both populations share one common haplotype, and several unique haplotypes from each population diverge in few nucleotide substitutions.
A combination of limited nucleotide diversity and higher haplotypic diversity, as found in our survey, occurs in Scylla serrata mtDNA variation (Fratini & Vannini, Reference Fratini and Vannini2002) and in many other marine invertebrate species with high reproductive potential, and has been interpreted as a reflection of high maternal effective population size (Lavery et al., Reference Lavery, Moritz and Fielder1996).
Along the Portuguese coast, C. maenas has a discontinuous distribution, being associated to estuarine ecosystems and neighbouring rocky shore environments. Thus, despite its long larval phase duration, some interpopulational differentiation could be expected. Several marine organisms that inhabit estuaries show genetic differentiation among populations (e.g. Schizas et al., Reference Schizas, Street and Coull1999). Roman & Palumbi (Reference Roman and Palumbi2004), using a fragment of the COI gene, detected a slight structure of C. maenas on the west and north European coasts. These authors explained these results with the current circulation patterns in the North Sea, historical events, selective forces and isolation by distance. Nevertheless, no population differentiation was detected in the Portuguese coast samples. Although C. maenas has a discontinuous distribution along the Portuguese coast, the lack of genetic structure could be interpreted by a high effective population size, which requires a low migration level to avoid genetic divergence (Neigel, Reference Neigel1994). Thus, possible resemblances among C. maenas populations geographically apart can be due to a homing process undertaken by a group of larvae (Queiroga, Reference Queiroga1996), while the other group with the same origin recruits in another estuary, thus in another population. This way, migration between estuaries along a coast can be enough to genetically homogenize populations.
Considering the significant shape differences found in the chelae of P. marmoratus and C. maenas, it would be interesting to better understand if they are just ecophenotypic responses to trophic pressures. In order to better discriminate possible causes of these shape variations, other genetic markers more sensitive to population differences (e.g. microsatellites) should be used. Nevertheless, the use of chelae to differentiate populations should be done with caution, and ideally associated with local prey availability and parasite presence.
ACKNOWLEDGEMENTS
This investigation was part of the project ‘GeneDif—Genetic and morphological differentiation in estuarine organisms with contrasting dispersal modes along a geographical gradient’, financed by Fundação para a Ciência e Tecnologia (FCT), Portugal, contract No. POCTI/BSE/45672/2002. I.C.S. acknowledges a PhD grant by FCT, reference SFRH/BD/14325/2003. The authors thank S. Pedro, S. Silva, V. Carmo, G. Penha-Lopes, H. Queiroga, J. Gonçalves and C.D. Schubart for their help with field work. The authors are also indebted to H. Queiroga and H. Cabral for their support in the statistical analysis, to M.J. Alves and C.D. Schubart for their help in the genetic analysis and to R.N. Mendes for his help in processing the photographs.