The Keynote Article by Sterba and Bauer (Reference Sterba and Bauer2010 [this issue]) has brought attention to a distinction between theory and methods in a person-oriented approach (Bergman & Magnusson, Reference Bergman and Magnusson1997) and raised an interesting question whether several latent variable models for longitudinal data can empirically evaluate principles of the person-oriented theory. To answer this question, Sterba and Bauer contrast several latent variable models for longitudinal data that differ in the way that intraindividual change over time and interindividual differences in intraindividual change are conceptualized along the quantitative and qualitative dimension. In addition, Sterba and Bauer describe two single-subject methods (p-technique and dynamic factor analysis) as underutilized methods of choice for person-oriented research. Their article extends the existing efforts to better match analytical tools with theoretical concepts, especially regarding the concept of qualitative versus quantitative individual differences in intraindividual change (see also Feldman, Masyn, & Conger, Reference Feldman, Masyn and Conger2009; Muthén, Reference Muthén, Collins and Sayer2001) and raises cautions about inferences made from analysis that examines latent class, population heterogeneity, or mixture distribution (see also Bauer & Curran, Reference Bauer and Curran2003, Reference Bauer and Curran2004; Sampson & Laub, Reference Sampson and Laub2005; von Eye & Bergman, Reference von Eye and Bergman2003).
Sterba and Bauer's article prompted a few observations. Although Sterba and Bauer provide some clarity regarding match and lack of match between person-oriented methods and theory, it still remains arbitrary to determine which of the person-oriented principles are testable and which are not because there can be many variations that defy a simple distinction within each analytic approach. One consideration is the role of a priori known information in the form of variables in person-oriented methods. For example, as Sterba and Bauer point out, the principle of complex interactions may conditionally be testable by including these complex interaction terms in the fitted models, assuming that a researcher knows which interaction terms to include. Similarly, one can argue that the pattern-parsimony principle may be evaluated by including a priori defined grouping variables in the fitted models and then examining parameters and comparing fit statistics. One can ask, for example, whether patterns of intraindividual change differ across different groups of individuals that are a priori defined.
Consideration of the individual specificity principle, also presents a dilemma: how does one determine if the individual specificity principle is met when there exist other equivalent and well-fitting structural equation models (see Tomarken & Waller, Reference Tomarken and Waller2003) or when higher order slope variance elements (e.g., quadratic slope variance) are constrained to be nonexistent to stabilize the estimation? In actuality, typical long-term longitudinal data exhibit great individual differences; a nonzero intercept variance element (individual specificity) is, in all practicality, not falsifiable. Similarly, a significant linear slope variance (interindividual differences/intraindividual change) is more a norm than an exception.
With regard to the assumption of population heterogeneity, analytic models utilizing latent classes or statuses only approximate the observed data and the true population state is never known in reality (Cudeck & Henly, Reference Cudeck and Henly2003). Thus, rather than focusing on whether a population is really or really not composed of heterogeneous subpopulations with different developmental pathways, it may be important to ask, instead, whether data-driven, hypothesis-generating analysis has brought any new useful understanding into light. This criterion may be difficult to evaluate immediately, and an affirmative answer may be warranted for some but not all such studies. Given that a majority of person-oriented methods are geared toward discovering unknown causal structures in data more effortlessly compared to variable-oriented methods, deciding one's analytic approach may depend on the judgmental outcome of weighing relative risk and potential gain in a trade-off between false positive (i.e., finding unhelpful [or nonexistent] subgroups) and false negative (i.e., erroneously not looking at potentially useful subgroups) risk.
Therefore, the field may become more knowledgeable by pursuing what is unknown above and beyond what is known (or could be tested based on what is known) and by attempting to find novel solutions to a problem that remain elusive. To close the gap between person-oriented theory and methods, it may be more fruitful to move beyond the methodological dualism between person-oriented and variable-oriented methods and instead embrace methodological pluralism and discovery-oriented methods as originally advocated by Richters (Reference Richters1997). We now discuss how the person-oriented and the variable-oriented perspectives could be complementary for research in developmental psychopathology.
Challenges and Opportunities for Research in Developmental Psychopathology
Developmental psychopathology is an integrative discipline that is concerned with both normal and abnormal developmental processes. It transcends disciplinary boundaries by focusing on integrated analysis of multilevel influences across systems including biological and contextual influences, and translates new scientific findings into clinical practices (Cicchetti, Reference Cicchetti, Cicchetti and Cohen2006; Cicchetti & Toth, Reference Cicchetti and Toth2009). This “big tent” approach (Cicchetti, Reference Cicchetti, Cicchetti and Cohen2006) to research in developmental psychopathology presents considerable challenges, including a multiple levels of analysis approach that goes across scales across multiple systems (Cicchetti & Toth, Reference Cicchetti and Toth2009).
Integration
Emerging behavioral data collection approaches (e.g., Web-based daily diary, ecological momentary assessment) offer both an opportunity and a challenge to examine rhythmical nonlinear dynamic processes of continuity and change over time, and to connect dots between interconnected systems across multiple levels. For example, Chow, Ram, Boker, Fujita, and Clore (Reference Chow, Ram, Boker, Fujita and Clore2005) utilized a damped oscillator model (a fourth-order latent differential structural equation modeling approach) to approximate an individual's daily self-reports of emotions over 52 days. Dynamic parameters such as intensity, frequency, and damping of weekly oscillatory cycles for six emotions (love, joy, sadness, fear, shame, and anger) were estimated separately for each emotion over time and then individual differences in these estimates were examined in relation to gender and personality characteristics. They found that all six emotions had approximately weekly cycles without much damping and, on average, women reported a shorter frequency of sadness compared to men.
For multivariate time-series data, a nonlinear dynamic analytic tool such as recurrence quantification analysis that examines repeating patterns of the dynamical signals for complexity, can be combined with principal component analysis to examine the complex relationships of an aggregated pattern (see Webber & Zbilut, Reference Webber, Zbilut, Riley and Van Orden2005). For example, one may successfully reduce the dimension of highly correlated multivariate time series data observed in kicking behavior among infants before studying its dynamic system and qualitatively different phase transitions. These examples illustrate the point that high dimensional, intraindividual data such as neuroimaging and genomic DNA are increasingly accessible, and will require integrated analysis across different measurement and time scales. This will require both person-oriented methods and variable-oriented methods. Thus, a two-stage approach based on person-specific ideographic analysis, followed by analysis of different individuals as advocated by Molenaar (Reference Molenaar2008) may be a promising direction for a multiple levels of analysis approach. A data example will be presented to illustrate some of these concepts later in this Commentary.
Mechanisms of change
In providing evidence of efficacy of prevention or intervention programs, it is increasingly important to identify mechanisms of change, not only treatment versus control group differences in a randomized clinical trial. To identify mechanisms of change, a person-oriented perspective is needed to conceptualize mediators and moderators within appropriate study designs. To demonstrate support for a mediator, it needs to be established that (a) a change mechanism can be manipulated in principle, (b) a change in a mediator can be attributed specifically to an intervention (e.g., reduced positive alcohol expectancies among intervention students but not control students), and (c) a change in an outcome variable can be attributed specifically to change in a mediating variable. Thus, mediation is a malleable change process within an individual that is a target intervention mechanism. In contrast, a moderator is a variable related to differences in the change process that (a) could not be manipulated (e.g., age or ethnicity) or (b) could be potentially susceptible to change but is independent of an intervention. In other words, mediation can be viewed as a process related to intraindividual change before, during or following an intervention, whereas moderation can be viewed as interindividual differences in the intraindividual change process that are known to be salient across subgroups and settings, or empirically identified using pattern-oriented classification methods. These concepts can be applied also to nonrandomized longitudinal studies where a quasiexperimental treatment effect is the target of an investigation. A person-oriented perspective in searching for mechanisms of change is needed to accompany the advances made in analytic methods for testing mediation from a more variable-oriented perspective (e.g., Bauer, Preacher, & Gil, Reference Bauer, Preacher and Gil2006; MacKinnon, Reference MacKinnon2008; Preacher & Hayes, Reference Preacher and Hayes2008).
As pointed out by others (e.g., Magnusson, Reference Magnusson, Cairns, Bergman and Kagan1998), evidence of the relationships between variables in a cross-sectional study using regression analysis or structural equation modeling analysis is conceptually inadequate for demonstrating mechanisms of change (or any mediation). Well-planned longitudinal analysis offers some safeguards to assure that empirical evidence of mediation effects is because of change within an individual not to individual differences. Latent growth curve modeling or its extension such as growth mixture modeling can be a very useful tool to identify whether intraindividual change occurs during and following an intervention, whether some individuals change more than others, or whether some individuals traverse pathways that are distinctively different not only in trajectories of the targeted behavior, but also in other domains of life. Other more discovery-oriented analytic tools such as configural frequency analysis (see von Eye, Reference von Eye2010 [this issue]), tree models (classification/regression trees), and cluster analysis (Mun, von Eye, Bates, & Vaschillo, Reference Mun, von Eye, Bates and Vaschillo2008; Mun, Windle, & Schainker, Reference Mun, Windle and Schainker2008) are available tools to uncover hidden patterns that may not be easily detected using more variable-oriented methods.
Evaluation
Another challenge involved in translating new scientific knowledge to clinical practices is how to assess whether the cost of interventions outweighs benefits, and how to communicate practical and economical implications to policy makers and the public. McCartney and Rosenthal (Reference McCartney and Rosenthal2000) illustrated that the practical importance of a finding can be very different from a statistical effect size estimate such as Cohen's d (Reference Cohen1988) that is assessed in units of a variable. A statistically significant finding and its effect size are important for researchers to consider, but they suggested that the binomial effect size display (BESD) originally developed by Rosenthal and Rubin (Reference Rosenthal and Rubin1982), may be more accessible for the public to understand the effect size of a given finding. The BESD is a 2 × 2 table to display an effect size that dichotomizes individuals (i.e., treatment cases) based on their predictor (or treatment exposure levels; below average vs. above average) and outcome (below average vs. above average outcome) values, and displays their differential outcome patterns. Thus, an outcome finding (e.g., treatment success) is defined at the level of individuals. For clinicians in the field, policy makers, and the public who deal with persons not variables, this approach may be more intuitive than an effect size defined at the level of variables.
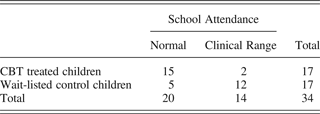
For example, after a 4-week cognitive behavioral treatment for children refusing to go to school, a treatment success was evaluated in terms of how many treated children reported school attendance within the normal, nonclinical range (defined as 90% attendance), compared to nontreated wait-listed children (King et al., Reference King, Tonge, Heyne, Pritchard, Rollings and Young1998). Based on the reported data, we reconstructed Table 1 as a BESD example. The effect size shown in Table 1 is large with r = .60 (r = .1, .3, and .5 for small, medium, and large effect sizes, respectively; Cohen, Reference Cohen1988) and one can easily see the difference in success rates for the treated versus wait-listed groups. This person-oriented approach to an effect size can easily be extended to include different treatment success rates across different settings in a 2 × 2 × k BESD.
Table 1.Binomial effect size display (r = .60) from the school attendance data at posttreatment assessment following a 4-week cognitive–behavioral treatment (CBT) for children refusing to go to school
Similarly, Foster, Dodge, and Jones (Reference Foster, Dodge and Jones2003) observed that many prevention and treatment studies are conducted from a variable-oriented perspective (i.e., group differences measured in d or r). Although this approach allows one to measure cost effectiveness per one unit improvement in a single outcome measure; this approach is disadvantageous when outcome variables are related in complex and nonlinear ways and when not all outcome measures are accessible for evaluation. Given that many problem behaviors tend to co-occur, Foster and colleagues suggested that a person-oriented outcome may be useful as a global measure of cost effectiveness for prevention research. In other words, a global measure of cost effectiveness may be determined at the level of individuals (e.g., individuals with adaptive pathways vs. individuals with compromised adaptation), not at the level of variable units.
In sum, both variable-oriented and person-oriented methods have unique roles in developmental psychopathology as discussed in relation to the three important issues. The gap that exists between person-oriented theory and the methods is more likely to become narrow with a clearer conceptual and analytical focus. Given this backdrop, Sterba and Bauer (Reference Sterba and Bauer2010) have done a service to the field by highlighting the distinction between theoretical concepts and analytical methods, and by critically evaluating the fit between the principles and methods of the person-oriented approach. In what follows, we return to the issue of integration for a multiple levels of analysis approach.
Discovery-Oriented Translational Alcohol Research: A Data Example
Here we illustrate how graphic and descriptive dynamic data analysis of rhythmical nonlinear processes over short time series (data series) might be used to propel new understanding of the systems implicated in drinking behavior control mechanisms. The goal is to inform translational research on efficacious treatment strategies to change unhealthy drinking behavior. The data came from an experiment examining intraindividual regulatory adaptability and flexibility in response to external and internal stimuli under conditions in which central cognitive control is intact (control), degraded by pharmacological challenge (alcohol), and cognitively manipulated (placebo). Heart rate variability (HRV) was measured as a noninvasive index of the cardiovascular system's dynamic adjustment (i.e., autonomic regulation) of sympathetic (excitatory) and parasympathetic (inhibitory) influences on heart rate (HR; Appelhans & Luecken, Reference Appelhans and Luecken2006). HRV is thought to reflect the adaptive capacity and flexibility of an individual to self-regulate in response to internal and external stimulation (e.g., stressors).
Experimental procedures
Healthy participants between the ages of 21 and 25 were randomly assigned to one of three conditions, and each condition consisted of completing two sessions that were 1 week apart: alcohol/placebo, alcohol/control, and placebo/control conditions. All participants consumed three volume-controlled drinks in each session that were either 100% mixer (told no alcohol = control), placebo (mixer with 100 µl of ethanol float per each cup and other olfactory cues), or mixer plus 95% ethanol dose to produce a target blood alcohol concentration of 80 mg/dl. Participants completed a low cognitive demand task (“plain vanilla”; Jennings, Kamarck, Stewart, Eddy, & Johnson, Reference Jennings, Kamarck, Stewart, Eddy and Johnson1992) for pre- and postdrinking baselines (B1 and B2, respectively), and then began cue exposure when a blood alcohol concentration of ~60 mg/dl was reached (or after 10 min in placebo and control sessions). Emotionally valenced picture cue stimuli (i.e., positive emotional, negative emotional, neutral) were from the International Affective Picture System (Lang, Bradley, & Cuthbert, Reference Lang, Bradley and Cuthbert1999). Alcohol cues were from the Normative Appetitive Picture System (Stritzke, Patrick, & Lang, 2004) and additional stimuli developed for this study. Emotionally valenced and alcohol picture cues were presented in 5-min blocks in which each cue appeared for 5 s then disappeared for 5 s. In addition, all participants completed a 5-min paced breathing task wherein they completed every breath (inhalation–exhalation cycle) for 10 s with the use of a visual pacer.
Descriptive graphic illustration of intraindividual dynamic HRV responses
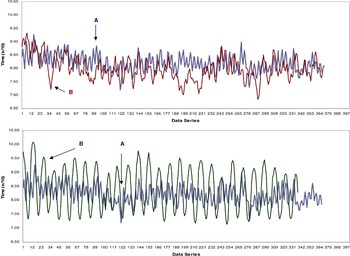
Figure 1 shows a sequence of beat to beat R–R intervals (RRIs) of the electrocardiogram (ECG) observed from a single individual following the placebo condition. RRI data in response to the low cognitive demand baseline task (B1) are overlaid with RRI data in response to the negative-emotional cues and the paced breathing task. Higher numbers on the Y axis indicate longer RRI (slower HR), whereas lower numbers indicate shorter RRI (faster HR). Note that the RRI oscillation patterns in response to the negative-emotional cues and paced breathing look different from the B1 responses and from one another in terms of regularity (highs and lows) and frequency of oscillations. The temporal RRI oscillations in response to the paced breathing procedure show a typical relaxation oscillatory pattern, and the RRI oscillations in response to the baseline and negative-emotional cues manifest the characteristics of a self-organizing system and strong affinity for approximately a 0.8-s interbeat interval during perturbation.
Figure 1.The R–R intervals (RRIs) data series during B1 baseline (A in both top and bottom figures), negative picture cue exposure (B in top figure), and paced breathing (B in bottom figure) conditions from a placebo session. Mean RRIs (SD) during baseline, negative picture cue exposure, and paced breathing were 8.20 (0.32), 7.99 (0.44), and 8.41 (0.75), respectively. [A color version of this figure can be viewed online at journals.cambridge.org/dpp]
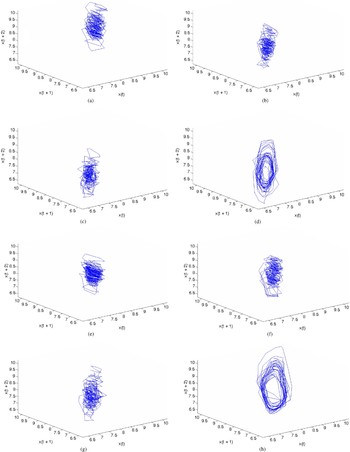
Figure 2 shows the RRI data from the same subject in reconstructed phase space during both placebo and alcohol conditions. This graphical approach is used to understand the nature of the nonlinear dynamic system by unfolding the system into the higher and appropriate number of dimensions using time-delayed copies of the series (Shockley, Reference Shockley, Riley and Van Orden2005). A few interesting observations from this illustration: first, the dynamic attractor state during paced breathing may be different from the one in response to baseline or emotionally valenced negative picture cues. Although the RRI oscillation patterns during B1, B2, and negative picture cue presentation appear to show noisy fluctuations around a fixed point, the RRI oscillations during paced breathing appear to have a limit cycle attractor (e.g., a swinging pendulum) that sets an orbit through the state space. Second, acute alcohol consumption degraded RRI responses to both low cognitive demand baselines and to negative emotional cues. Reduced variability in RRI oscillations indicates decreased capacity of neurocardiologic systems to cope with disturbance during intoxication. Third, compared to the RRI responses to baseline, the RRI oscillations to emotionally negative picture cues were relatively unstable because of perturbing the system through strongly valenced visual stimuli. Although the moment to moment RRI oscillations during both baseline and negative picture cue presentation exhibited fluctuations around their mean or preferred state reflecting the noisiness of the components, the RRI oscillations during negative picture cue presentation were more variable and unstable than the RRI oscillations during baseline.
Figure 2.A three-dimensional reconstruction of the R–R interval (RRI) signal extracted from the continuous electrocardiogram signals in phase space for a single individual (A) under various external and internal stimulation conditions: (a) baseline (B1) RRI before alcohol administration, (b) baseline (B2) RRI after alcohol administration, (c) negative picture cue exposure after alcohol administration, (d) paced breathing after alcohol administration, (e) baseline (B1) RRI before placebo drink administration, (f) baseline (B2) RRI after placebo drink administration, (g) negative picture cue exposure after placebo drink administration, and (h) paced breathing after placebo drink administration. Phase space data were plotted with a delay parameter of 1 so that no data points were skipped (Webber & Zbilut, Reference Webber, Zbilut, Riley and Van Orden2005) and with an embedding dimension parameter of 4 (3 for paced breathing). [A color version of this figure can be viewed online at journals.cambridge.org/dpp]
The graphical approach tentatively suggests that the beverage and emotional cue manipulations successfully perturbed the cardiovascular system, yet this individual had a highly stable self-regulating control system. These perturbations might have been within the ranges of the control parameter, and consequently, the system maintained its preferred state despite increased fluctuations and unstable oscillation patterns. In contrast, the system appeared to generate qualitatively different patterns during paced breathing in a phase shift or phase transition. The source of this new form in reconstructed phase space was controlled breathing in which the subject inhaled (accelerated HR) and exhaled (decelerated HR) at 0.1 Hz through the use of a visual pacer, resulting in strongly synchronized respiratory sinus arrhythmia at the cardiovascular system's resonance frequency (i.e., six breaths/min or 0.1 Hz; see Vaschillo, Vaschillo, & Lehrer, Reference Vaschillo, Vaschillo and Lehrer2006). This insight, if shown repeatedly from different individuals with diverse health backgrounds, may play a key role in gauging clinical treatment implications for paced breathing and paced picture cue presentation paradigms, as they are closely related to HRV biofeedback, which has been associated with chronic therapeutic actions in clinical populations (e.g., Lehrer et al., Reference Lehrer, Vaschillo, Vaschillo, Lu, Eckberg and Edelberg2003).
Interindividual differences in intraindividual dynamic HRV responses
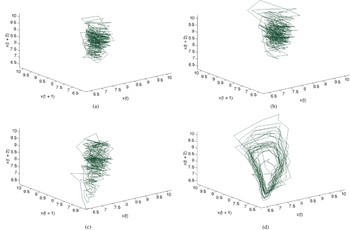
Figure 3 shows RRI oscillations in reconstructed phase space observed from a different individual during the control (no alcohol) session. This individual, like the other individual whose data are shown in Figures 1 and 2, was generally healthy and exhibited RRI oscillations that were slightly more elevated (lower mean HR) and more variable (greater HRV) when plotted. We then examined the data more quantitatively using recurrence quantification analysis to quantify the properties of the repeating patterns without requiring the stationary assumption (no increasing or decreasing trend in means and standard deviations over time; see Webber & Zbilut, Reference Webber, Zbilut, Riley and Van Orden2005).
Figure 3.A three-dimensional reconstruction of the R–R interval (RRI) signal extracted from the continuous electrocardiogram signals in phase space for a different individual (B) under various external and internal stimulation conditions: (a) baseline (B1) RRI before control drink administration, (b) baseline (B2) RRI after control drink administration, (c) negative picture cue exposure after control drink administration, and (d) paced breathing after control drink administration. Phase space data were plotted with a delay parameter of 1 and embedding dimension parameters of 3 (B2 baseline), 4 (B1 baseline and negative picture cue exposure), and 5 (paced breathing). [A color version of this figure can be viewed online at journals.cambridge.org/dpp]
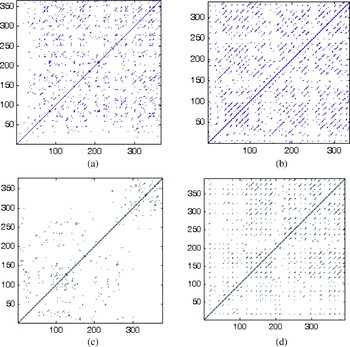
Figure 4 illustrates the data from two individuals A and B during the placebo and control sessions, respectively, in recurrence plots. The percentage of recurrent points falling within the specified radius is measured by percentage of recurrence and the deterministic characteristic in the observed dynamic is quantified by percentage of determinism. Given that more complex systems tend to exhibit less frequent recurrences, Figure 4 and quantitative parameters suggest that the RRI oscillations during cue exposure had less repeating patterns and were less deterministic than the ones during paced breathing for both individuals. Figure 4 also shows that Individual A appeared to exhibit more repeating response patterns, indicating less complexity, compared to Individual B during negative cue exposure. Such person-specific analysis could be the first stage of investigations aimed to identify mechanisms of behavior change by assessing whether different patterns in physiological control systems signal greater risk for unhealthy alcohol use, and to introduce change in systems that may be related to motivation to change and change in drinking behavior.
Figure 4.Recurrence plots of the R–R interval data shown in Figure 3. For individual A, the data were plotted with a delay parameter of 1, embedding dimension parameters of 3 (paced breathing) and 4, and radius parameters of 4% (paced breathing) and 5%: (a) negative picture cue exposure, percentage of recurrence (%REC) = 1.34, percentage of determinism (%DET) = 58.57; (b) paced breathing, %REC = 2.17, %DET = 81.44. For individual B, the data were plotted with a delay parameter of 1, embedding dimension parameters of 4 and 5 (paced breathing), and a radius of 4%: (c) negative picture cue exposure, %REC = 0.40, %DET = 61.43; (d) paced breathing, %REC = 1.21, %DET = 82.24. [A color version of this figure can be viewed online at journals.cambridge.org/dpp]
Conclusion
It may be helpful to bring attention to the six research strategies that have been identified for developmental psychologists interested in analysis of dynamic systems (Thelen & Smith, Reference Thelen and Smith1994) as summarized in Granic and Hollenstein (Reference Granic and Hollenstein2003): (a) identify the collective variable of interest, (b) describe the attractors for that system, (c) map the individual developmental trajectories of the collective variables, (d) identify phase transitions in development, (e) identify control parameters (for an example, see Molenaar's Commentary, Reference Molenaar2010 [this issue]), and (f) manipulate control parameters to experimentally generate phase transitions. In this present Commentary, we illustrated concepts of attractors, phase transitions, and control parameters using perturbed cardiac rhythms as an example of nonlinear dynamics in the context of translational alcohol research.
There is an unmet need to better understand the systems being investigated using appropriate person-specific tools prior to studying differences across individuals. Pattern-oriented and person-oriented methods can be useful analytic tools for discovery-oriented research that often requires integrated knowledge across multiple levels within an individual and across different individuals. Likewise, variable-oriented methods such as regression analysis or structural equation modeling can be useful tools in sorting out different dynamic or nondynamic patterns across different individuals (e.g., alcohol abusers or social drinkers). Thus, we argue that variable-oriented and person-oriented methods, when thoughtfully used within appropriate study designs, have complementary roles in pursuit of new understanding from a multiple levels of analysis approach for research in developmental psychopathology. It is not the individual analytic methods per se, but how studies are implemented as a whole, from design to analysis and discussion, that constitutes the person-oriented approach and its significance.





 You have
Access
The Keynote Article by Sterba and Bauer (Reference Sterba and Bauer2010 [this issue]) has brought attention to a distinction between theory and methods in a person-oriented approach (Bergman & Magnusson, Reference Bergman and Magnusson1997) and raised an interesting question whether several latent variable models for longitudinal data can empirically evaluate principles of the person-oriented theory. To answer this question, Sterba and Bauer contrast several latent variable models for longitudinal data that differ in the way that intraindividual change over time and interindividual differences in intraindividual change are conceptualized along the quantitative and qualitative dimension. In addition, Sterba and Bauer describe two single-subject methods (p-technique and dynamic factor analysis) as underutilized methods of choice for person-oriented research. Their article extends the existing efforts to better match analytical tools with theoretical concepts, especially regarding the concept of qualitative versus quantitative individual differences in intraindividual change (see also Feldman, Masyn, & Conger, Reference Feldman, Masyn and Conger2009; Muthén, Reference Muthén, Collins and Sayer2001) and raises cautions about inferences made from analysis that examines latent class, population heterogeneity, or mixture distribution (see also Bauer & Curran, Reference Bauer and Curran2003, Reference Bauer and Curran2004; Sampson & Laub, Reference Sampson and Laub2005; von Eye & Bergman, Reference von Eye and Bergman2003).
Sterba and Bauer's article prompted a few observations. Although Sterba and Bauer provide some clarity regarding match and lack of match between person-oriented methods and theory, it still remains arbitrary to determine which of the person-oriented principles are testable and which are not because there can be many variations that defy a simple distinction within each analytic approach. One consideration is the role of a priori known information in the form of variables in person-oriented methods. For example, as Sterba and Bauer point out, the principle of complex interactions may conditionally be testable by including these complex interaction terms in the fitted models, assuming that a researcher knows which interaction terms to include. Similarly, one can argue that the pattern-parsimony principle may be evaluated by including a priori defined grouping variables in the fitted models and then examining parameters and comparing fit statistics. One can ask, for example, whether patterns of intraindividual change differ across different groups of individuals that are a priori defined.
Consideration of the individual specificity principle, also presents a dilemma: how does one determine if the individual specificity principle is met when there exist other equivalent and well-fitting structural equation models (see Tomarken & Waller, Reference Tomarken and Waller2003) or when higher order slope variance elements (e.g., quadratic slope variance) are constrained to be nonexistent to stabilize the estimation? In actuality, typical long-term longitudinal data exhibit great individual differences; a nonzero intercept variance element (individual specificity) is, in all practicality, not falsifiable. Similarly, a significant linear slope variance (interindividual differences/intraindividual change) is more a norm than an exception.
With regard to the assumption of population heterogeneity, analytic models utilizing latent classes or statuses only approximate the observed data and the true population state is never known in reality (Cudeck & Henly, Reference Cudeck and Henly2003). Thus, rather than focusing on whether a population is really or really not composed of heterogeneous subpopulations with different developmental pathways, it may be important to ask, instead, whether data-driven, hypothesis-generating analysis has brought any new useful understanding into light. This criterion may be difficult to evaluate immediately, and an affirmative answer may be warranted for some but not all such studies. Given that a majority of person-oriented methods are geared toward discovering unknown causal structures in data more effortlessly compared to variable-oriented methods, deciding one's analytic approach may depend on the judgmental outcome of weighing relative risk and potential gain in a trade-off between false positive (i.e., finding unhelpful [or nonexistent] subgroups) and false negative (i.e., erroneously not looking at potentially useful subgroups) risk.
Therefore, the field may become more knowledgeable by pursuing what is unknown above and beyond what is known (or could be tested based on what is known) and by attempting to find novel solutions to a problem that remain elusive. To close the gap between person-oriented theory and methods, it may be more fruitful to move beyond the methodological dualism between person-oriented and variable-oriented methods and instead embrace methodological pluralism and discovery-oriented methods as originally advocated by Richters (Reference Richters1997). We now discuss how the person-oriented and the variable-oriented perspectives could be complementary for research in developmental psychopathology.
Challenges and Opportunities for Research in Developmental Psychopathology
Developmental psychopathology is an integrative discipline that is concerned with both normal and abnormal developmental processes. It transcends disciplinary boundaries by focusing on integrated analysis of multilevel influences across systems including biological and contextual influences, and translates new scientific findings into clinical practices (Cicchetti, Reference Cicchetti, Cicchetti and Cohen2006; Cicchetti & Toth, Reference Cicchetti and Toth2009). This “big tent” approach (Cicchetti, Reference Cicchetti, Cicchetti and Cohen2006) to research in developmental psychopathology presents considerable challenges, including a multiple levels of analysis approach that goes across scales across multiple systems (Cicchetti & Toth, Reference Cicchetti and Toth2009).
Integration
Emerging behavioral data collection approaches (e.g., Web-based daily diary, ecological momentary assessment) offer both an opportunity and a challenge to examine rhythmical nonlinear dynamic processes of continuity and change over time, and to connect dots between interconnected systems across multiple levels. For example, Chow, Ram, Boker, Fujita, and Clore (Reference Chow, Ram, Boker, Fujita and Clore2005) utilized a damped oscillator model (a fourth-order latent differential structural equation modeling approach) to approximate an individual's daily self-reports of emotions over 52 days. Dynamic parameters such as intensity, frequency, and damping of weekly oscillatory cycles for six emotions (love, joy, sadness, fear, shame, and anger) were estimated separately for each emotion over time and then individual differences in these estimates were examined in relation to gender and personality characteristics. They found that all six emotions had approximately weekly cycles without much damping and, on average, women reported a shorter frequency of sadness compared to men.
For multivariate time-series data, a nonlinear dynamic analytic tool such as recurrence quantification analysis that examines repeating patterns of the dynamical signals for complexity, can be combined with principal component analysis to examine the complex relationships of an aggregated pattern (see Webber & Zbilut, Reference Webber, Zbilut, Riley and Van Orden2005). For example, one may successfully reduce the dimension of highly correlated multivariate time series data observed in kicking behavior among infants before studying its dynamic system and qualitatively different phase transitions. These examples illustrate the point that high dimensional, intraindividual data such as neuroimaging and genomic DNA are increasingly accessible, and will require integrated analysis across different measurement and time scales. This will require both person-oriented methods and variable-oriented methods. Thus, a two-stage approach based on person-specific ideographic analysis, followed by analysis of different individuals as advocated by Molenaar (Reference Molenaar2008) may be a promising direction for a multiple levels of analysis approach. A data example will be presented to illustrate some of these concepts later in this Commentary.
Mechanisms of change
In providing evidence of efficacy of prevention or intervention programs, it is increasingly important to identify mechanisms of change, not only treatment versus control group differences in a randomized clinical trial. To identify mechanisms of change, a person-oriented perspective is needed to conceptualize mediators and moderators within appropriate study designs. To demonstrate support for a mediator, it needs to be established that (a) a change mechanism can be manipulated in principle, (b) a change in a mediator can be attributed specifically to an intervention (e.g., reduced positive alcohol expectancies among intervention students but not control students), and (c) a change in an outcome variable can be attributed specifically to change in a mediating variable. Thus, mediation is a malleable change process within an individual that is a target intervention mechanism. In contrast, a moderator is a variable related to differences in the change process that (a) could not be manipulated (e.g., age or ethnicity) or (b) could be potentially susceptible to change but is independent of an intervention. In other words, mediation can be viewed as a process related to intraindividual change before, during or following an intervention, whereas moderation can be viewed as interindividual differences in the intraindividual change process that are known to be salient across subgroups and settings, or empirically identified using pattern-oriented classification methods. These concepts can be applied also to nonrandomized longitudinal studies where a quasiexperimental treatment effect is the target of an investigation. A person-oriented perspective in searching for mechanisms of change is needed to accompany the advances made in analytic methods for testing mediation from a more variable-oriented perspective (e.g., Bauer, Preacher, & Gil, Reference Bauer, Preacher and Gil2006; MacKinnon, Reference MacKinnon2008; Preacher & Hayes, Reference Preacher and Hayes2008).
As pointed out by others (e.g., Magnusson, Reference Magnusson, Cairns, Bergman and Kagan1998), evidence of the relationships between variables in a cross-sectional study using regression analysis or structural equation modeling analysis is conceptually inadequate for demonstrating mechanisms of change (or any mediation). Well-planned longitudinal analysis offers some safeguards to assure that empirical evidence of mediation effects is because of change within an individual not to individual differences. Latent growth curve modeling or its extension such as growth mixture modeling can be a very useful tool to identify whether intraindividual change occurs during and following an intervention, whether some individuals change more than others, or whether some individuals traverse pathways that are distinctively different not only in trajectories of the targeted behavior, but also in other domains of life. Other more discovery-oriented analytic tools such as configural frequency analysis (see von Eye, Reference von Eye2010 [this issue]), tree models (classification/regression trees), and cluster analysis (Mun, von Eye, Bates, & Vaschillo, Reference Mun, von Eye, Bates and Vaschillo2008; Mun, Windle, & Schainker, Reference Mun, Windle and Schainker2008) are available tools to uncover hidden patterns that may not be easily detected using more variable-oriented methods.
Evaluation
Another challenge involved in translating new scientific knowledge to clinical practices is how to assess whether the cost of interventions outweighs benefits, and how to communicate practical and economical implications to policy makers and the public. McCartney and Rosenthal (Reference McCartney and Rosenthal2000) illustrated that the practical importance of a finding can be very different from a statistical effect size estimate such as Cohen's d (Reference Cohen1988) that is assessed in units of a variable. A statistically significant finding and its effect size are important for researchers to consider, but they suggested that the binomial effect size display (BESD) originally developed by Rosenthal and Rubin (Reference Rosenthal and Rubin1982), may be more accessible for the public to understand the effect size of a given finding. The BESD is a 2 × 2 table to display an effect size that dichotomizes individuals (i.e., treatment cases) based on their predictor (or treatment exposure levels; below average vs. above average) and outcome (below average vs. above average outcome) values, and displays their differential outcome patterns. Thus, an outcome finding (e.g., treatment success) is defined at the level of individuals. For clinicians in the field, policy makers, and the public who deal with persons not variables, this approach may be more intuitive than an effect size defined at the level of variables.
For example, after a 4-week cognitive behavioral treatment for children refusing to go to school, a treatment success was evaluated in terms of how many treated children reported school attendance within the normal, nonclinical range (defined as 90% attendance), compared to nontreated wait-listed children (King et al., Reference King, Tonge, Heyne, Pritchard, Rollings and Young1998). Based on the reported data, we reconstructed Table 1 as a BESD example. The effect size shown in Table 1 is large with r = .60 (r = .1, .3, and .5 for small, medium, and large effect sizes, respectively; Cohen, Reference Cohen1988) and one can easily see the difference in success rates for the treated versus wait-listed groups. This person-oriented approach to an effect size can easily be extended to include different treatment success rates across different settings in a 2 × 2 × k BESD.
Binomial effect size display (r = .60) from the school attendance data at posttreatment assessment following a 4-week cognitive–behavioral treatment (CBT) for children refusing to go to school
Note: The data are according to King et al. (Reference King, Tonge, Heyne, Pritchard, Rollings and Young1998).
Similarly, Foster, Dodge, and Jones (Reference Foster, Dodge and Jones2003) observed that many prevention and treatment studies are conducted from a variable-oriented perspective (i.e., group differences measured in d or r). Although this approach allows one to measure cost effectiveness per one unit improvement in a single outcome measure; this approach is disadvantageous when outcome variables are related in complex and nonlinear ways and when not all outcome measures are accessible for evaluation. Given that many problem behaviors tend to co-occur, Foster and colleagues suggested that a person-oriented outcome may be useful as a global measure of cost effectiveness for prevention research. In other words, a global measure of cost effectiveness may be determined at the level of individuals (e.g., individuals with adaptive pathways vs. individuals with compromised adaptation), not at the level of variable units.
In sum, both variable-oriented and person-oriented methods have unique roles in developmental psychopathology as discussed in relation to the three important issues. The gap that exists between person-oriented theory and the methods is more likely to become narrow with a clearer conceptual and analytical focus. Given this backdrop, Sterba and Bauer (Reference Sterba and Bauer2010) have done a service to the field by highlighting the distinction between theoretical concepts and analytical methods, and by critically evaluating the fit between the principles and methods of the person-oriented approach. In what follows, we return to the issue of integration for a multiple levels of analysis approach.
Discovery-Oriented Translational Alcohol Research: A Data Example
Here we illustrate how graphic and descriptive dynamic data analysis of rhythmical nonlinear processes over short time series (data series) might be used to propel new understanding of the systems implicated in drinking behavior control mechanisms. The goal is to inform translational research on efficacious treatment strategies to change unhealthy drinking behavior. The data came from an experiment examining intraindividual regulatory adaptability and flexibility in response to external and internal stimuli under conditions in which central cognitive control is intact (control), degraded by pharmacological challenge (alcohol), and cognitively manipulated (placebo). Heart rate variability (HRV) was measured as a noninvasive index of the cardiovascular system's dynamic adjustment (i.e., autonomic regulation) of sympathetic (excitatory) and parasympathetic (inhibitory) influences on heart rate (HR; Appelhans & Luecken, Reference Appelhans and Luecken2006). HRV is thought to reflect the adaptive capacity and flexibility of an individual to self-regulate in response to internal and external stimulation (e.g., stressors).
Experimental procedures
Healthy participants between the ages of 21 and 25 were randomly assigned to one of three conditions, and each condition consisted of completing two sessions that were 1 week apart: alcohol/placebo, alcohol/control, and placebo/control conditions. All participants consumed three volume-controlled drinks in each session that were either 100% mixer (told no alcohol = control), placebo (mixer with 100 µl of ethanol float per each cup and other olfactory cues), or mixer plus 95% ethanol dose to produce a target blood alcohol concentration of 80 mg/dl. Participants completed a low cognitive demand task (“plain vanilla”; Jennings, Kamarck, Stewart, Eddy, & Johnson, Reference Jennings, Kamarck, Stewart, Eddy and Johnson1992) for pre- and postdrinking baselines (B1 and B2, respectively), and then began cue exposure when a blood alcohol concentration of ~60 mg/dl was reached (or after 10 min in placebo and control sessions). Emotionally valenced picture cue stimuli (i.e., positive emotional, negative emotional, neutral) were from the International Affective Picture System (Lang, Bradley, & Cuthbert, Reference Lang, Bradley and Cuthbert1999). Alcohol cues were from the Normative Appetitive Picture System (Stritzke, Patrick, & Lang, 2004) and additional stimuli developed for this study. Emotionally valenced and alcohol picture cues were presented in 5-min blocks in which each cue appeared for 5 s then disappeared for 5 s. In addition, all participants completed a 5-min paced breathing task wherein they completed every breath (inhalation–exhalation cycle) for 10 s with the use of a visual pacer.
Descriptive graphic illustration of intraindividual dynamic HRV responses
Figure 1 shows a sequence of beat to beat R–R intervals (RRIs) of the electrocardiogram (ECG) observed from a single individual following the placebo condition. RRI data in response to the low cognitive demand baseline task (B1) are overlaid with RRI data in response to the negative-emotional cues and the paced breathing task. Higher numbers on the Y axis indicate longer RRI (slower HR), whereas lower numbers indicate shorter RRI (faster HR). Note that the RRI oscillation patterns in response to the negative-emotional cues and paced breathing look different from the B1 responses and from one another in terms of regularity (highs and lows) and frequency of oscillations. The temporal RRI oscillations in response to the paced breathing procedure show a typical relaxation oscillatory pattern, and the RRI oscillations in response to the baseline and negative-emotional cues manifest the characteristics of a self-organizing system and strong affinity for approximately a 0.8-s interbeat interval during perturbation.
The R–R intervals (RRIs) data series during B1 baseline (A in both top and bottom figures), negative picture cue exposure (B in top figure), and paced breathing (B in bottom figure) conditions from a placebo session. Mean RRIs (SD) during baseline, negative picture cue exposure, and paced breathing were 8.20 (0.32), 7.99 (0.44), and 8.41 (0.75), respectively. [A color version of this figure can be viewed online at journals.cambridge.org/dpp]
Figure 2 shows the RRI data from the same subject in reconstructed phase space during both placebo and alcohol conditions. This graphical approach is used to understand the nature of the nonlinear dynamic system by unfolding the system into the higher and appropriate number of dimensions using time-delayed copies of the series (Shockley, Reference Shockley, Riley and Van Orden2005). A few interesting observations from this illustration: first, the dynamic attractor state during paced breathing may be different from the one in response to baseline or emotionally valenced negative picture cues. Although the RRI oscillation patterns during B1, B2, and negative picture cue presentation appear to show noisy fluctuations around a fixed point, the RRI oscillations during paced breathing appear to have a limit cycle attractor (e.g., a swinging pendulum) that sets an orbit through the state space. Second, acute alcohol consumption degraded RRI responses to both low cognitive demand baselines and to negative emotional cues. Reduced variability in RRI oscillations indicates decreased capacity of neurocardiologic systems to cope with disturbance during intoxication. Third, compared to the RRI responses to baseline, the RRI oscillations to emotionally negative picture cues were relatively unstable because of perturbing the system through strongly valenced visual stimuli. Although the moment to moment RRI oscillations during both baseline and negative picture cue presentation exhibited fluctuations around their mean or preferred state reflecting the noisiness of the components, the RRI oscillations during negative picture cue presentation were more variable and unstable than the RRI oscillations during baseline.
A three-dimensional reconstruction of the R–R interval (RRI) signal extracted from the continuous electrocardiogram signals in phase space for a single individual (A) under various external and internal stimulation conditions: (a) baseline (B1) RRI before alcohol administration, (b) baseline (B2) RRI after alcohol administration, (c) negative picture cue exposure after alcohol administration, (d) paced breathing after alcohol administration, (e) baseline (B1) RRI before placebo drink administration, (f) baseline (B2) RRI after placebo drink administration, (g) negative picture cue exposure after placebo drink administration, and (h) paced breathing after placebo drink administration. Phase space data were plotted with a delay parameter of 1 so that no data points were skipped (Webber & Zbilut, Reference Webber, Zbilut, Riley and Van Orden2005) and with an embedding dimension parameter of 4 (3 for paced breathing). [A color version of this figure can be viewed online at journals.cambridge.org/dpp]
The graphical approach tentatively suggests that the beverage and emotional cue manipulations successfully perturbed the cardiovascular system, yet this individual had a highly stable self-regulating control system. These perturbations might have been within the ranges of the control parameter, and consequently, the system maintained its preferred state despite increased fluctuations and unstable oscillation patterns. In contrast, the system appeared to generate qualitatively different patterns during paced breathing in a phase shift or phase transition. The source of this new form in reconstructed phase space was controlled breathing in which the subject inhaled (accelerated HR) and exhaled (decelerated HR) at 0.1 Hz through the use of a visual pacer, resulting in strongly synchronized respiratory sinus arrhythmia at the cardiovascular system's resonance frequency (i.e., six breaths/min or 0.1 Hz; see Vaschillo, Vaschillo, & Lehrer, Reference Vaschillo, Vaschillo and Lehrer2006). This insight, if shown repeatedly from different individuals with diverse health backgrounds, may play a key role in gauging clinical treatment implications for paced breathing and paced picture cue presentation paradigms, as they are closely related to HRV biofeedback, which has been associated with chronic therapeutic actions in clinical populations (e.g., Lehrer et al., Reference Lehrer, Vaschillo, Vaschillo, Lu, Eckberg and Edelberg2003).
Interindividual differences in intraindividual dynamic HRV responses
Figure 3 shows RRI oscillations in reconstructed phase space observed from a different individual during the control (no alcohol) session. This individual, like the other individual whose data are shown in Figures 1 and 2, was generally healthy and exhibited RRI oscillations that were slightly more elevated (lower mean HR) and more variable (greater HRV) when plotted. We then examined the data more quantitatively using recurrence quantification analysis to quantify the properties of the repeating patterns without requiring the stationary assumption (no increasing or decreasing trend in means and standard deviations over time; see Webber & Zbilut, Reference Webber, Zbilut, Riley and Van Orden2005).
A three-dimensional reconstruction of the R–R interval (RRI) signal extracted from the continuous electrocardiogram signals in phase space for a different individual (B) under various external and internal stimulation conditions: (a) baseline (B1) RRI before control drink administration, (b) baseline (B2) RRI after control drink administration, (c) negative picture cue exposure after control drink administration, and (d) paced breathing after control drink administration. Phase space data were plotted with a delay parameter of 1 and embedding dimension parameters of 3 (B2 baseline), 4 (B1 baseline and negative picture cue exposure), and 5 (paced breathing). [A color version of this figure can be viewed online at journals.cambridge.org/dpp]
Figure 4 illustrates the data from two individuals A and B during the placebo and control sessions, respectively, in recurrence plots. The percentage of recurrent points falling within the specified radius is measured by percentage of recurrence and the deterministic characteristic in the observed dynamic is quantified by percentage of determinism. Given that more complex systems tend to exhibit less frequent recurrences, Figure 4 and quantitative parameters suggest that the RRI oscillations during cue exposure had less repeating patterns and were less deterministic than the ones during paced breathing for both individuals. Figure 4 also shows that Individual A appeared to exhibit more repeating response patterns, indicating less complexity, compared to Individual B during negative cue exposure. Such person-specific analysis could be the first stage of investigations aimed to identify mechanisms of behavior change by assessing whether different patterns in physiological control systems signal greater risk for unhealthy alcohol use, and to introduce change in systems that may be related to motivation to change and change in drinking behavior.
Recurrence plots of the R–R interval data shown in Figure 3. For individual A, the data were plotted with a delay parameter of 1, embedding dimension parameters of 3 (paced breathing) and 4, and radius parameters of 4% (paced breathing) and 5%: (a) negative picture cue exposure, percentage of recurrence (%REC) = 1.34, percentage of determinism (%DET) = 58.57; (b) paced breathing, %REC = 2.17, %DET = 81.44. For individual B, the data were plotted with a delay parameter of 1, embedding dimension parameters of 4 and 5 (paced breathing), and a radius of 4%: (c) negative picture cue exposure, %REC = 0.40, %DET = 61.43; (d) paced breathing, %REC = 1.21, %DET = 82.24. [A color version of this figure can be viewed online at journals.cambridge.org/dpp]
Conclusion
It may be helpful to bring attention to the six research strategies that have been identified for developmental psychologists interested in analysis of dynamic systems (Thelen & Smith, Reference Thelen and Smith1994) as summarized in Granic and Hollenstein (Reference Granic and Hollenstein2003): (a) identify the collective variable of interest, (b) describe the attractors for that system, (c) map the individual developmental trajectories of the collective variables, (d) identify phase transitions in development, (e) identify control parameters (for an example, see Molenaar's Commentary, Reference Molenaar2010 [this issue]), and (f) manipulate control parameters to experimentally generate phase transitions. In this present Commentary, we illustrated concepts of attractors, phase transitions, and control parameters using perturbed cardiac rhythms as an example of nonlinear dynamics in the context of translational alcohol research.
There is an unmet need to better understand the systems being investigated using appropriate person-specific tools prior to studying differences across individuals. Pattern-oriented and person-oriented methods can be useful analytic tools for discovery-oriented research that often requires integrated knowledge across multiple levels within an individual and across different individuals. Likewise, variable-oriented methods such as regression analysis or structural equation modeling can be useful tools in sorting out different dynamic or nondynamic patterns across different individuals (e.g., alcohol abusers or social drinkers). Thus, we argue that variable-oriented and person-oriented methods, when thoughtfully used within appropriate study designs, have complementary roles in pursuit of new understanding from a multiple levels of analysis approach for research in developmental psychopathology. It is not the individual analytic methods per se, but how studies are implemented as a whole, from design to analysis and discussion, that constitutes the person-oriented approach and its significance.