Introduction
The glaciers of the eastern Brooks Range, Alaska, USA, where McCall Glacier is located (69˚18’N, 143˚48’ W; Fig. 1), have been losing mass since at least the late 19th century. McCall Glacier is separated from the Arctic Ocean by about 100 km of tundra and foothills and is located in a steep-sided, generally north-facing valley. The glacier is about 7.5 km long, up to 240 m thick, spans 1400– 2400m a.s.l., and has a mean annual air temperature of about –12˚C near the equilibrium line (Nolan, unpublished data), which ranges from 2000 to 2400 m. These physical characteristics are common for many of the larger glaciers in this region, which was once covered by 390 km2 of ice, based on maps from 1956. Photographic (Reference LeffingwellLeffingwell, 1919) and lichenometric (Reference Calkin and EvisonCalkin and Evison, 1996) data suggest that the last major advance of the glaciers here ended by about 1890, and most have large, recent and clearly recognizable moraines that are commonly attributed to this Little Ice Age (LIA) advance. In nearly all cases, these LIA moraines are the most extended moraines for at least several thousand years and possibly since the last major glaciation in the Northern Hemisphere (Reference KeelerKeeler, 1959).
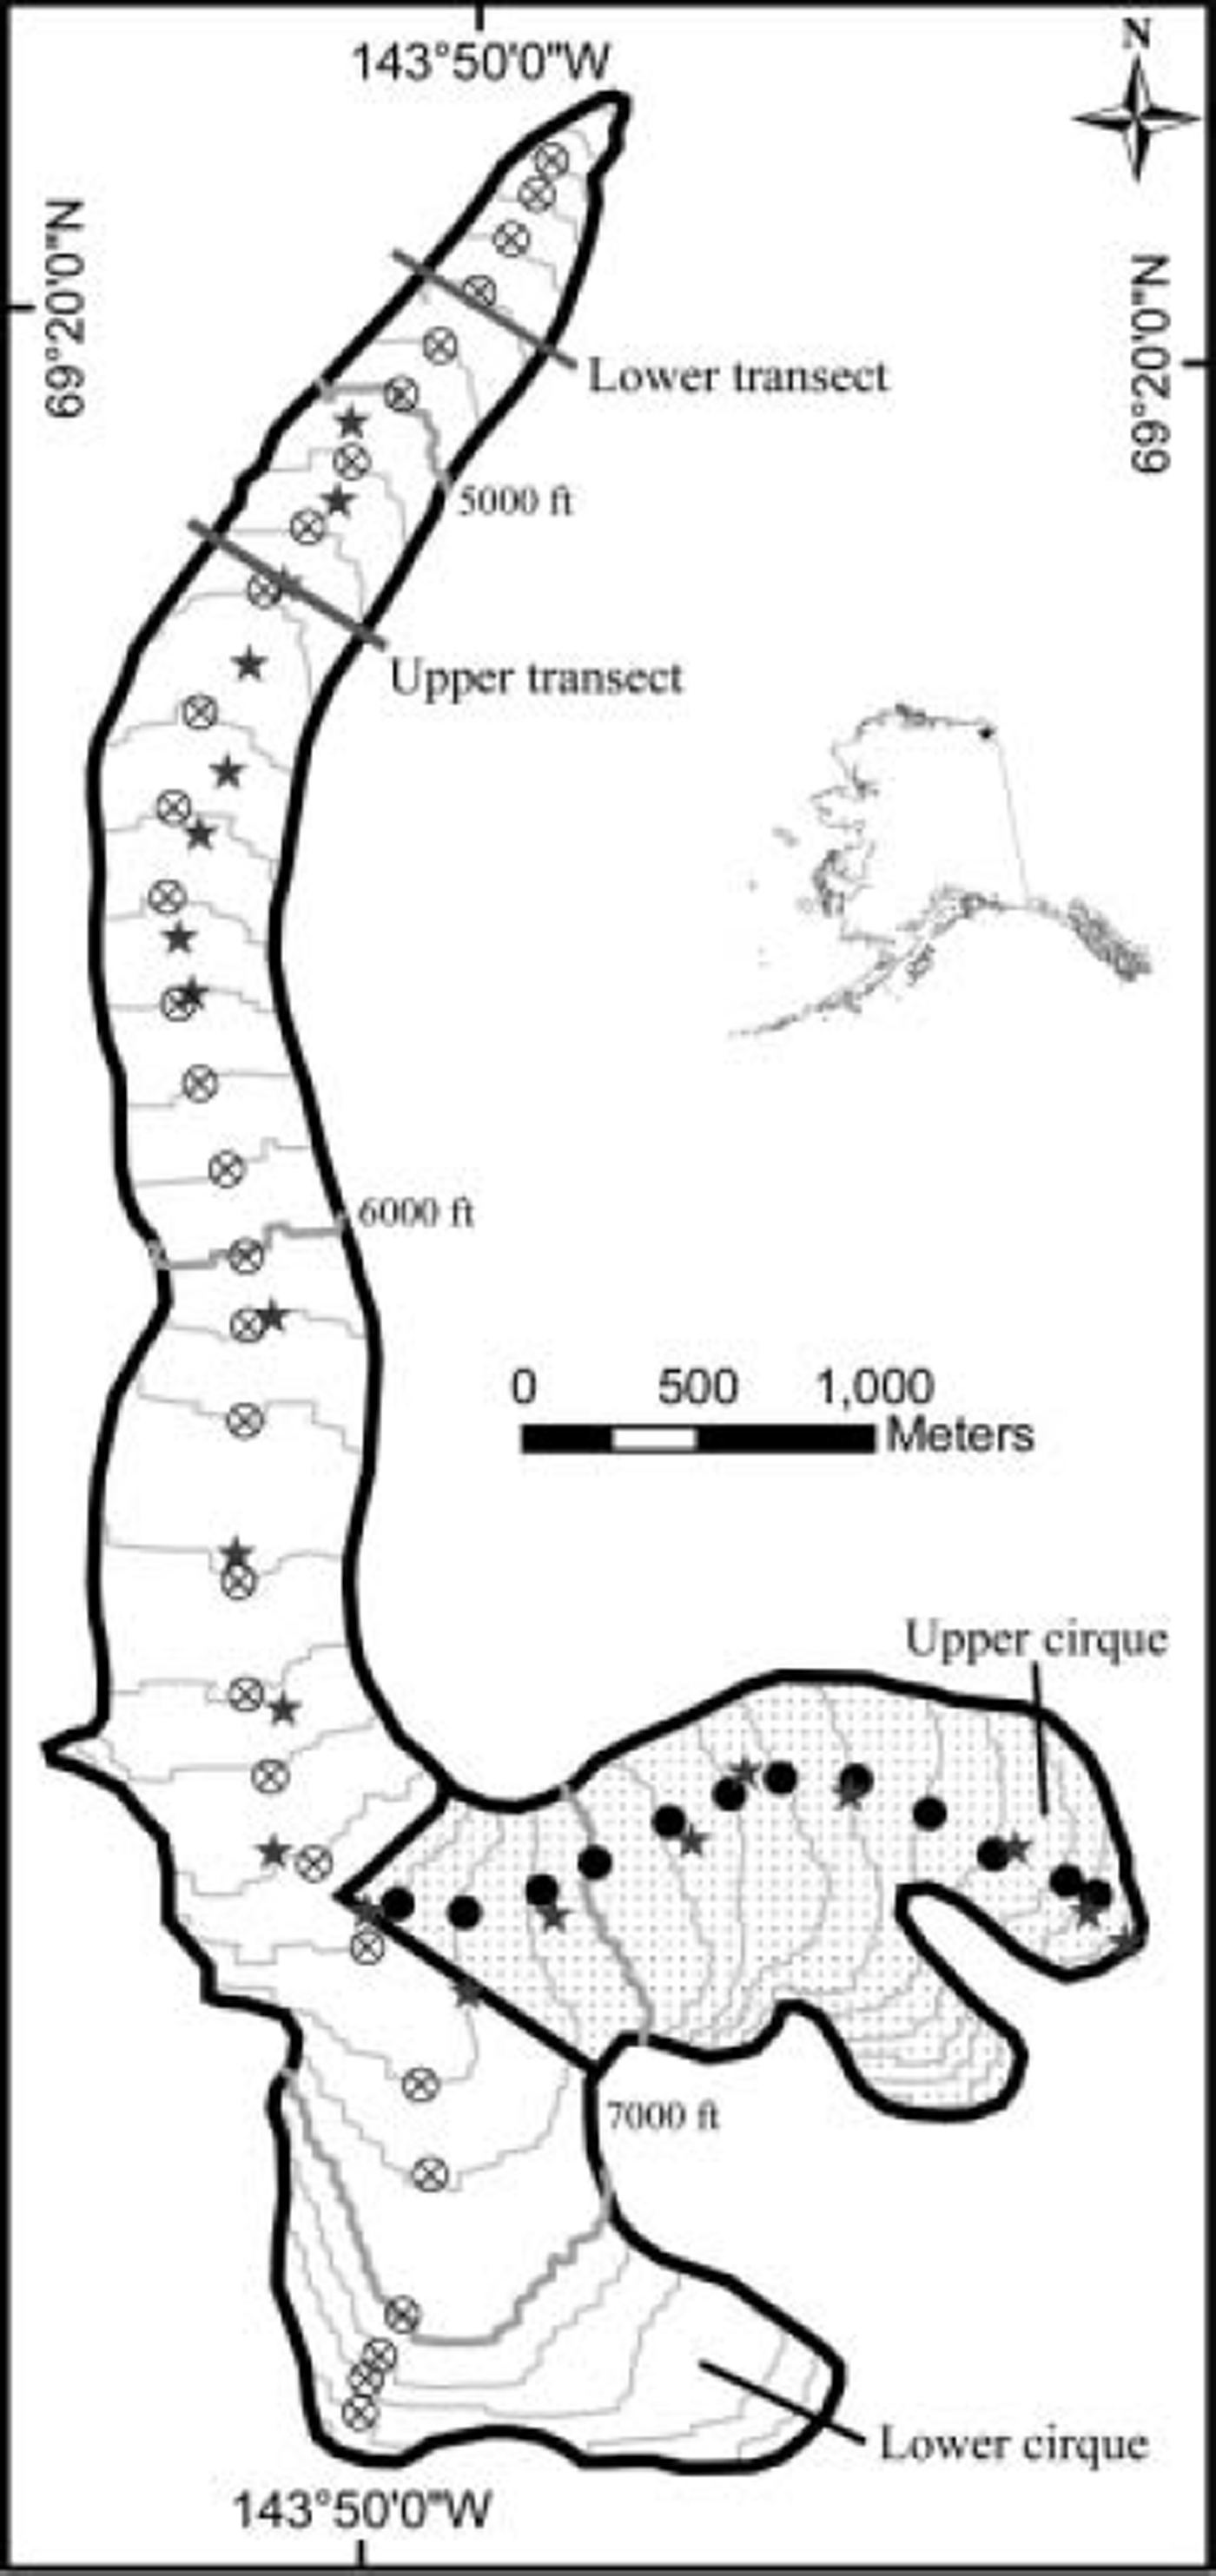
Location map. Contour intervals are 100 ft (1 ft = 0.305 m), as these were the elevational bins used in the volume-change calculation; contours were recreated from the DEM based on the 1956 USGS map. Circles are locations of the airborne laser profile points used in the volume-change calculations; the two laser profiles used were treated separately, as indicated by the shaded area and filled circles. Stars represent survey-pole locations.
McCall Glacier has the longest history of research of any US Arctic glacier, beginning with the International Geophysical Year (IGY) 1957–58 (Reference MasonMason, 1959; Reference SaterSater, 1959). Research here was resumed during part of the International Hydrological Decade (1969–72) (Reference Wendler and IshikawaWendler and Ishikawa, 1974) and again during the mid-1990s (1993–97) (Reference Rabus, Echelmeyer, Trabant and BensonRabus and others, 1995; Reference Rabus and EchelmeyerRabus and Echelmeyer, 1997, Reference Rabus and Echelmeyer1998, Reference Rabus and Echelmeyer2002). Research continues today (2003–08) with a project funded by the US National Science Foundation’s (NSF) Arctic System Science Program’s Freshwater Initiative. The overarching theme of this initiative is to understand how fresh-water inputs to the Arctic Ocean have changed since the end of the LIA, and to understand how this may affect the dynamics of the ocean–climate system. Our work on McCall Glacier is largely designed to quantify the impacts of the climate change in this region and to improve our understanding of the dynamics of polythermal glaciers. This paper documents volume change of McCall Glacier from 1956 to 2003; future work will relate these changes to climate through local measurements of meteorological conditions, ice temperatures, surface mass balance and ice velocities. We also plan to extract a deep ice core to investigate climate changes across the end of the LIA transition. At present, there are no instrumental or similar paleo-environmental records for several hundred kilometers surrounding the glacier; the nearest station was the Barter Island US National Oceanic and Atmospheric Administration (NOAA) weather station 90 km away, which has temperature and precipitation records from 1949 to 1988 and experiences substantially different weather patterns due to coastal influences.
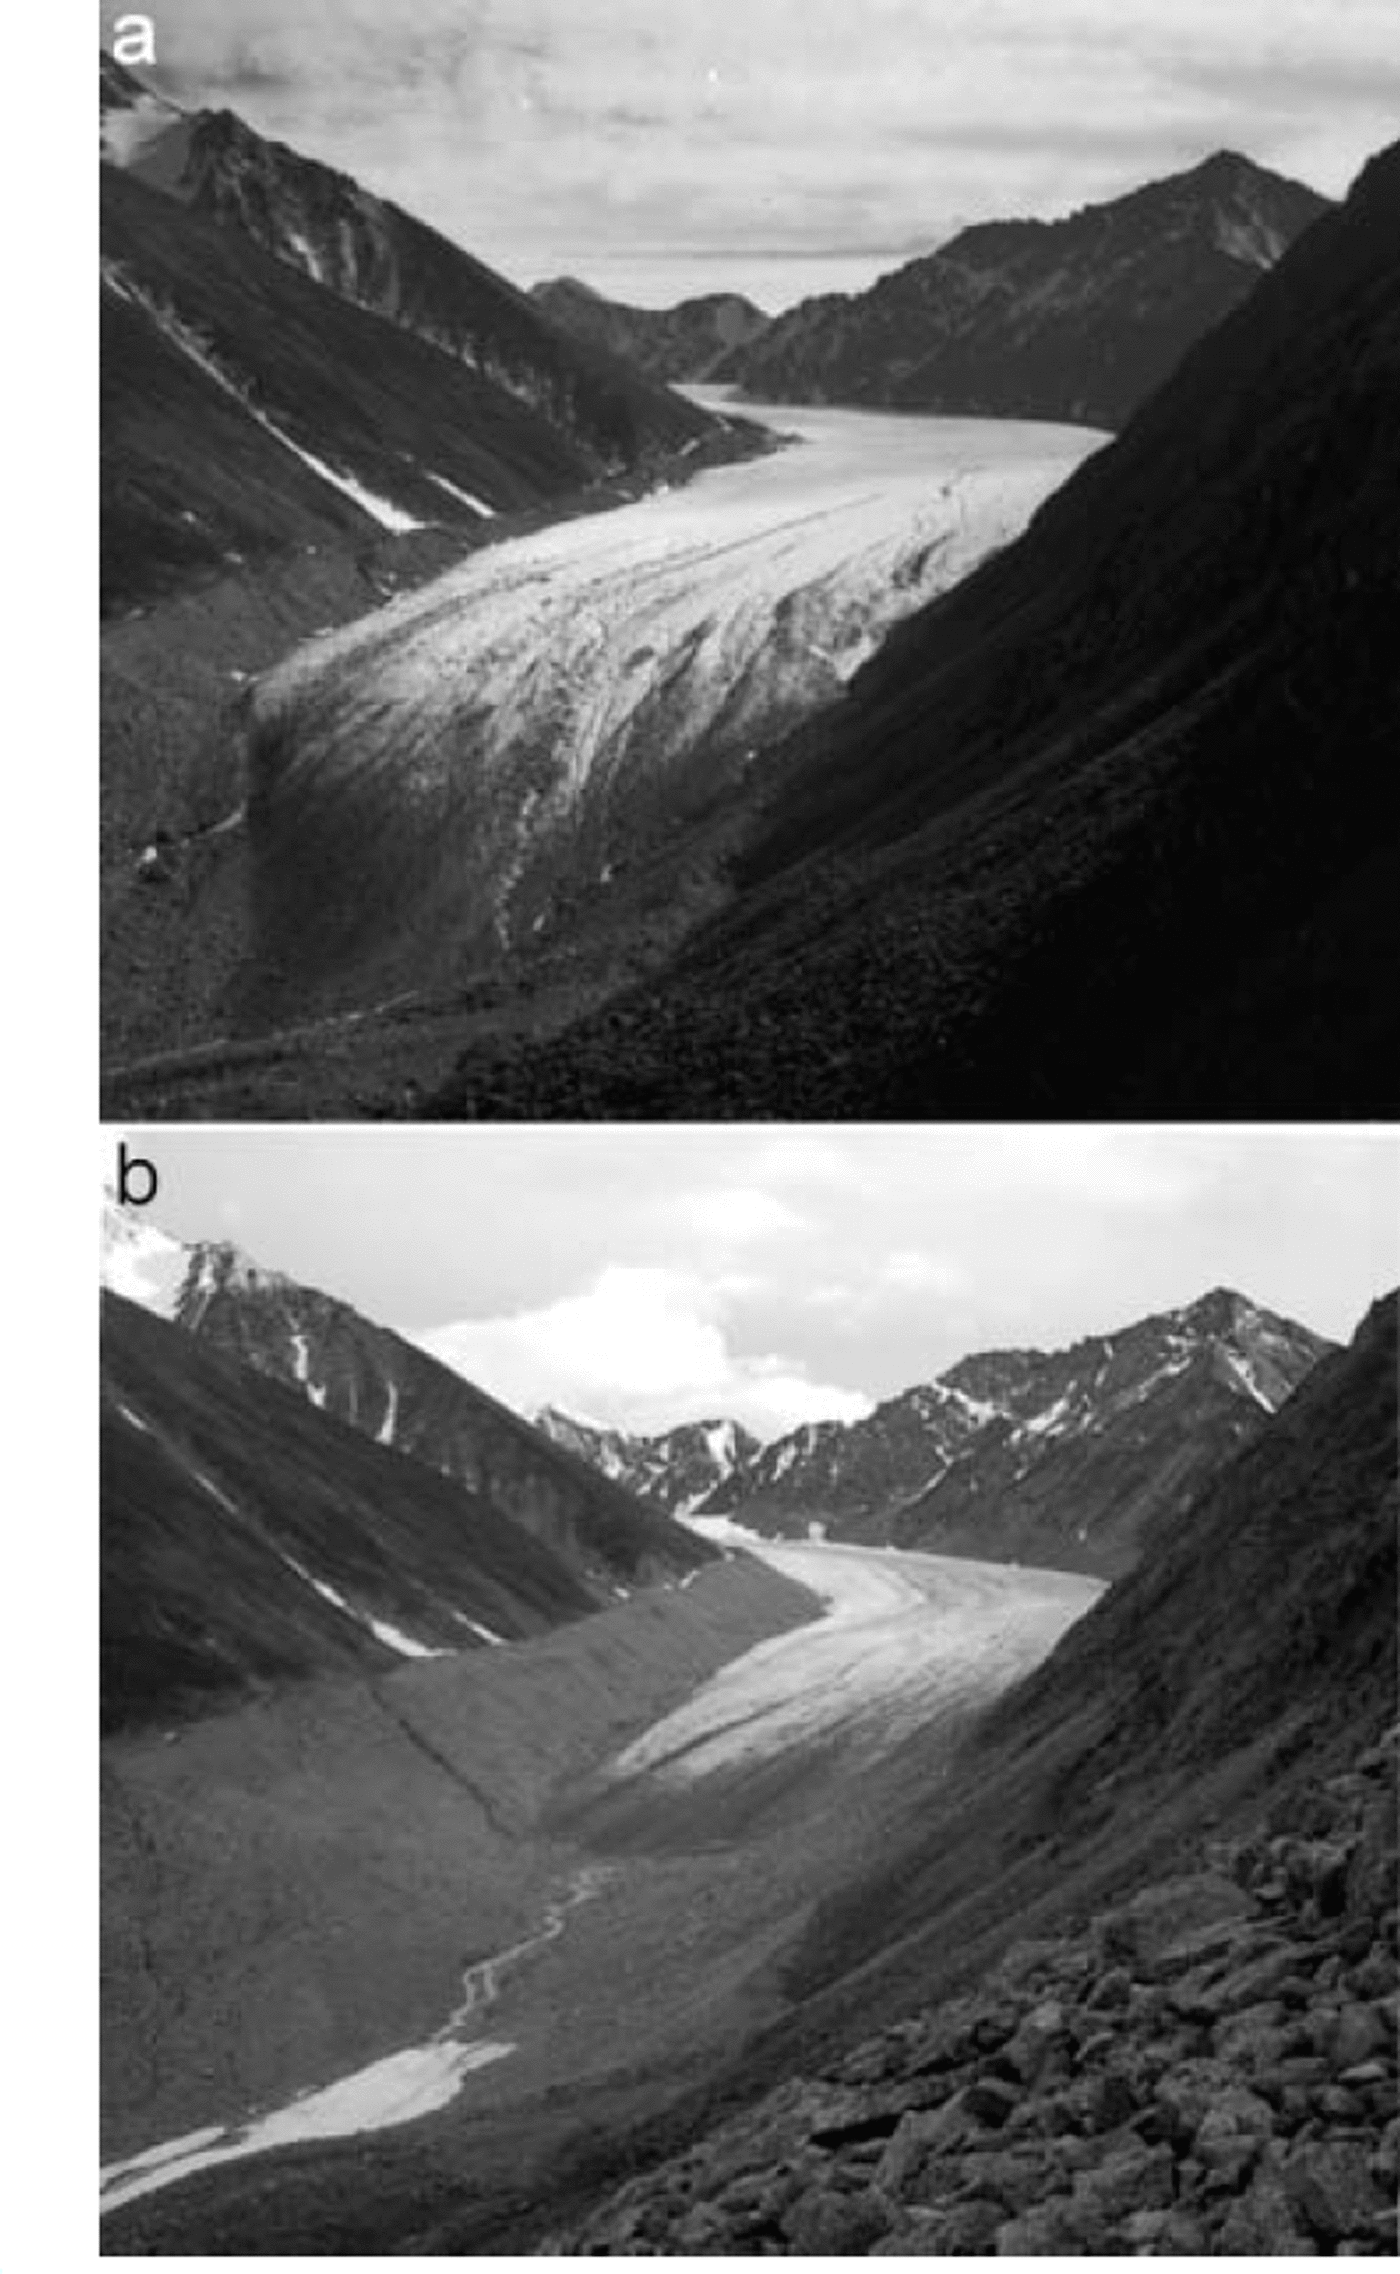
Figure 2 qualitatively illustrates the magnitude of volume change experienced by McCall Glacier over the past 50 years. Surveying shows that the recently deglacierized lateral moraines now extend >100 m above the valley floor and that there has been >800m of ice retreat from the terminal moraine since the LIA. The changes seen here are characteristic of most of the glaciers in the area, which have also clearly retreated from large moraines of similar age; none of these glaciers are known to be surge-type or have tidewater influences. Thus this photo comparison unambiguously indicates that climate has changed in this region over the past 50–100 years, and it is the resulting change in volume that we wish to quantify in this paper.
Photo comparison of the McCall Glacier terminus, 1958 (a) and August 2003 (b). Photo credits: A. Post and M. Nolan, respectively; 1958 photo was probably taken in July. About 850m of retreat has occurred since 1890, leaving exposed a lateral moraine that is >100 m above the valley floor. The lower transect (Fig. 5a) is located a few meters downhill of the 2003 terminus.
Measurements of Surface Elevation Since 1956
In this study, we analyze three independent time series for quantitative measurement of surface elevation change, described in detail below after a discussion of errors. The first is a time series based on a 1993 airborne laser altimeter profile (Reference Rabus and EchelmeyerRabus and Echelmeyer, 1998) down the center line of the glacier, which we compare to repeat measurements in 2003 and a 1956 topographic contour map. These are the measurements we use later to calculate volume change, as they form the most complete longitudinal transect available. Next we present a time series of surface elevations measured at mass-balance pole locations in 1972, 1993 and 2003. We did not use these measurements for calculation of volume change, as they do not represent the terminus region well, but these data independently lend credibility to the volume-change calculation involving the 1956 map. Finally we present a time series of surface elevations at two cross-flow transects on the lower glacier, measured in 1969, 1970, 1972, 1987, 1993 and 2003. We use these transects to validate the assumption that a center-line measurement of surface change is representative of changes across the width of the glacier at that elevation. Below we quantify elevation measurement errors; we discuss volume-change calculations and their associated errors in a later section.
Elevation measurement techniques and errors
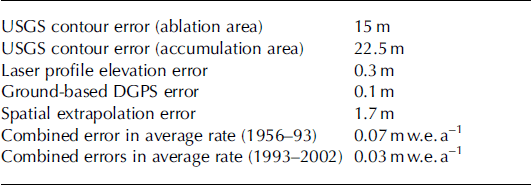
The elevation measurements we present here cover a wide range of techniques, each with different errors (Table 1). All measurements prior to 1993 were made with T2 theodolites with accuracies better than 0.3 m. These elevation measurements were made either in late summer or in early spring and corrected for snow depth to represent the previous late-summer surface. Ground measurements of stakes and profiles in 1993 also used T2 theodolites with the same accuracy. An airborne laser altimetry profile also acquired in 1993 has an accuracy of 0.3m (details of the system, methods and errors can be found in Reference Arendt, Echelmeyer, Harrison, Lingle and ValentineArendt and others, 2002). Measurements in 2003 were made exclusively on foot or ski with differential global positioning system (DGPS) using Trimble 4000 and 4700 receivers with nominal accuracies on the order of 0.02 m. Real-time kinematic (RTK) methods allowed us to navigate to prior survey locations to within 0.02 m. Typically the distance from antenna to ski bottom (or to boot bottom) was assumed constant, and the depth from ski bottom to ice surface was measured when snow was present to calculate the antenna height above ice. Considering errors in antenna-to-ski distance and snow-depth measurements together with the global positioning system (GPS) errors, we estimate the total error in our 2003 measurements to be 0.1 m. In the field we established protocols for resurveying bedrock points during each survey to eliminate mistakes caused by use of improper datums or projections within the GPS receiver. We report the May 2003 surveys as end-of-summer 2002 measurements for direct comparisons with prior data measured in late summer; though ice deformation changed the ice surface over the intervening winter, our volume-change calculations are integrated over the length of the glacier and thus are not greatly affected. Here we use 15 August plus or minus two weeks as the end-of-summer date in 2002, based on prior experience; this uncertainty has a negligible effect on errors in the volume-change calculation, described later, when averaged over the 9 year measurement interval.
Summary of errors in areally averaged volume-change calculations
Topographic mapping errors
In the subsections below, we compare each of our three time series of elevation measurements to a 1 :63360 scale United States Geological Survey (USGS) topographic map, derived from 1956 aerial photos. As is well known, many of these USGS maps were poorly controlled in Alaska and suffer from photogrammetric inaccuracies, especially on snow-covered regions of glaciers where contrast is low (Reference Rabus and EchelmeyerRabus and Echelmeyer, 1998). Nominal accuracy is plus or minus half of one contour interval, or roughly 15 m, but it is quite possible that true vertical accuracy is worse than this in glacierized regions. Reference Rabus and EchelmeyerRabus and Echelmeyer (1998) compared map elevations of bedrock with corresponding airborne laser-altimetry data and found that the map sheet on which McCall Glacier is located (Demarcation Point (B-5), Alaska 1956, scale 1:63360) is at most only 1 m higher than actual; an adjacent map sheet was found to be 20m higher than actual. However, we suspect the accuracy on the glacier surface may be worse due to the photogrammetric contrast problem mentioned above. Survey measurements from the IGY period exist (Reference SaterSater, 1958), but we cannot use these data for map control due to insufficient information on the local survey networks. Another paper contour map, at 1:10000 scale, was made using 1957 photos (Reference BrandenbergerBrandenberger, 1959), but this map suffers from a variety of errors (Reference Rabus, Echelmeyer, Trabant and BensonRabus and others, 1995), the largest of which was apparently due to lost camera-lens calibrations for the photos used (personal communication from H. Brecher, 1993). Therefore, for our map comparisons to the 1950s, we only use the USGS paper map and the digital elevation models (DEMs) that the USGS derived from them in their National Elevation Dataset (NED); the native spatial resolution of this DEM is 45 m. In the following sections we place further constraints on the accuracy of the USGS map using our elevation measurements from later years.
Results of longitudinal profile comparisons
Here we used three airborne laser altimeter profiles acquired on 27 July 1993: profiles 2081A (a segment of the upper cirque), 2082 (from upper cirque to terminus) and 2083 (from lower cirque to terminus), where numbers refer to archival identification. For the period 1956–93, we selected the laser altimeter point from each profile closest to each contour on the 1956 paper map, following prior methods (Reference EchelmeyerEchelmeyer and others, 1996; Reference Arendt, Echelmeyer, Harrison, Lingle and ValentineArendt and others, 2002). Where these profiles overlapped, they were generally <10 m apart laterally and we averaged the elevation changes determined from their individual contour crossing points; these points are shown in Figure 1. For the ground-based repeat measurements in 2002–1993 we resurveyed altimetry points of the entire profile 2082 every 100 m along the 1993 ground track and the upper portion of 2083 (lower cirque), as shown in Figure 1. Our use of different subsets of the original 1993 laser altimetry profile should not affect the accuracy of our elevation-change comparisons; we provide evidence of this in a later section where we compare methods of calculating volume change.
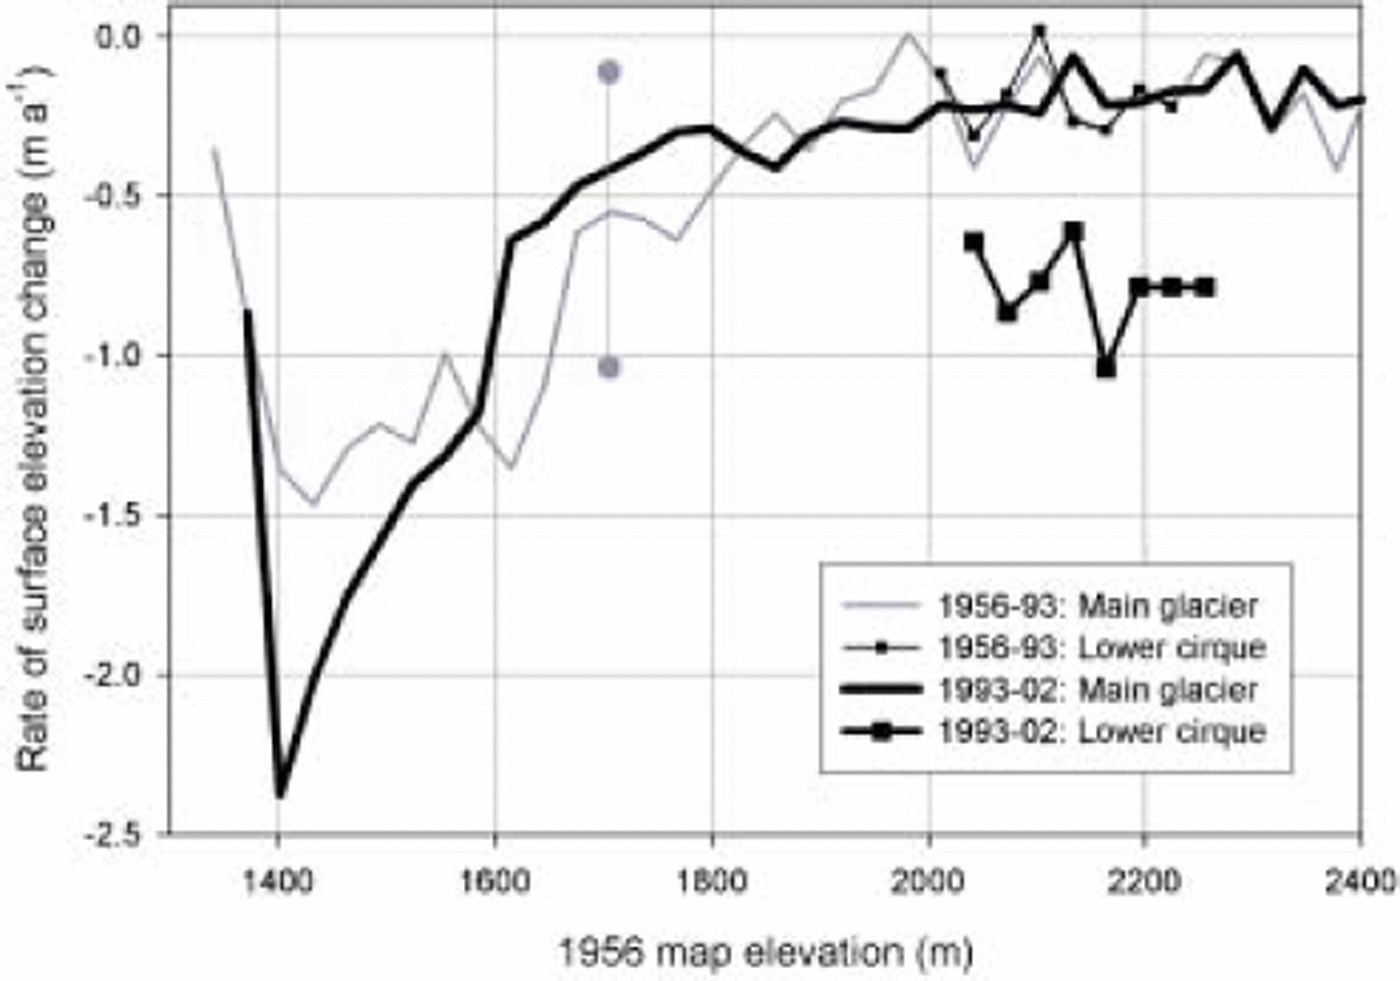
Elevation changes determined from the airborne laser altimetry profile (Fig. 3) show that the rate of surface lowering has increased over time, especially in the lower cirque and terminus regions. Thinning rates are similar in the upper cirque between the time periods, but are well within the nominal map errors. Changes in thinning rates in the lower cirque, however, are beyond the map errors and support the suggestion by Reference Rabus and EchelmeyerRabus and Echelmeyer (1998) that the lower cirque changed from an accumulation area to an ablation area due to an upward shift in the equilibrium line between the 1970s and 1990s. This increase in rate is supported by other measurements of survey stakes, not shown here. The rate of thinning appears to have decreased in the mid-ablation area (1600–1800 m) since 1993. However, because the 1956–93 comparison uses the 1956 map data and therefore has large error estimates, we use other datasets to confirm these general results.
Rate of surface elevation change determined along centerline profiles originally acquired by airborne laser altimetry. An error bar is shown for measurements involving the 1956 USGS map; errors for the later period are approximately the thickness of the line. Two different transects are shown for each time period, as indicated by the legend and described in Figure 1. Note that the region between 1600 and 1800m elevation appears to have decreased its rate of thinning.
Results of survey-pole elevation comparisons
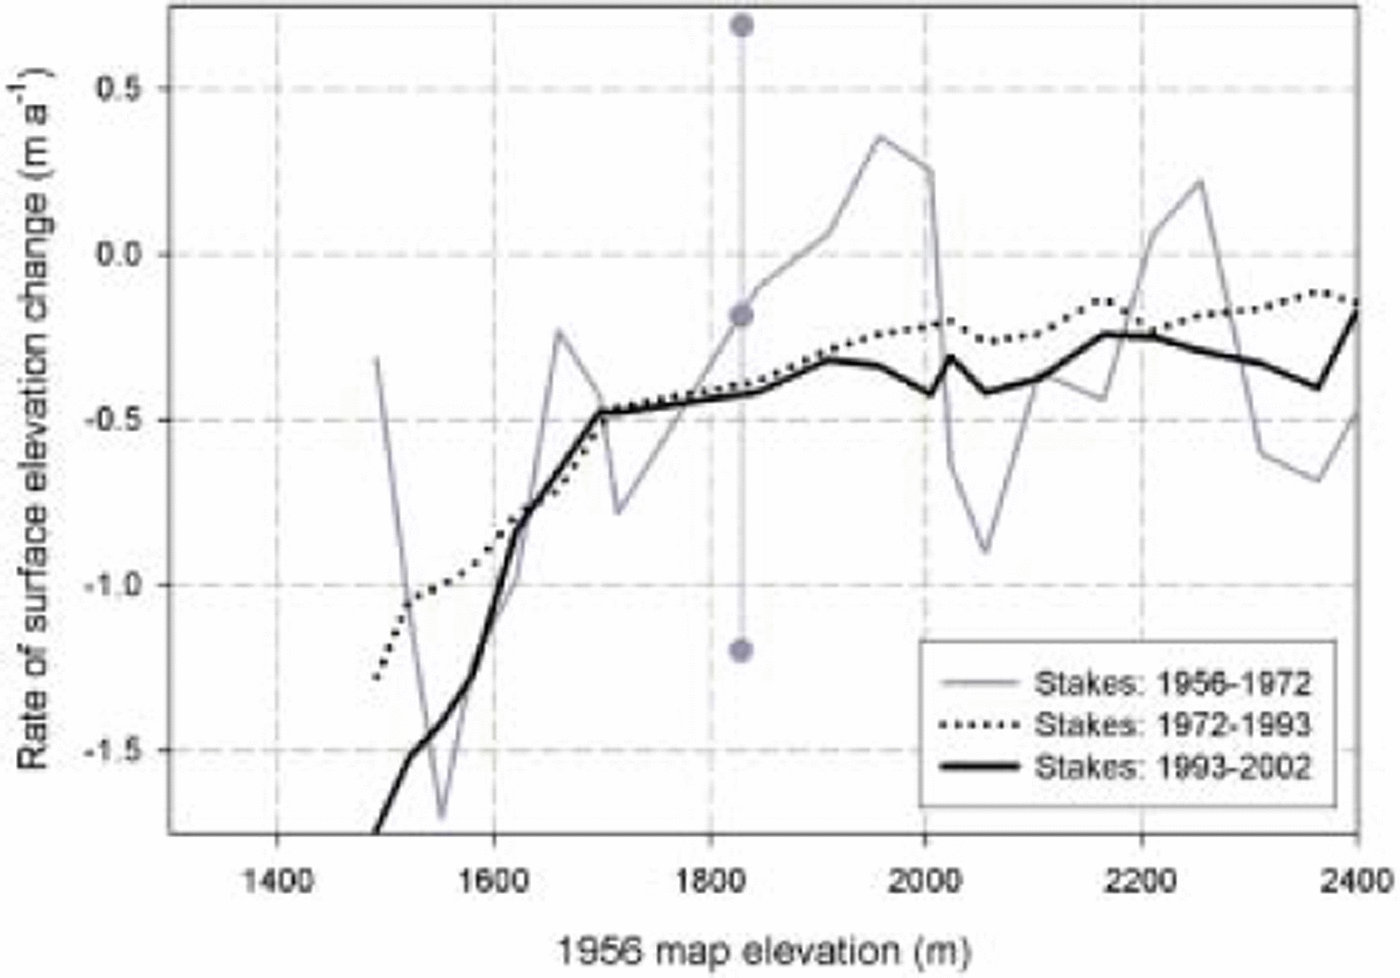
Here we confirm the general results of the laser profile comparisons using a time series of survey-pole locations that is independent of the 1956 map data. Shown in Figure 4 is surface elevation change of 20 pole locations that form a center-line longitudinal transect through the upper cirque (shown as stars in Fig. 1), a subset of the full network of 65 poles that dates back to 1969-72. Note that these are not the elevations of actual survey poles in 2003, but the ice elevations at the locations where poles were initially installed between 1969 and 1972. We also used the 45 m resolution USGS DEM to obtain 1956 elevations for comparison with the survey elevations by sampling the DEM for the gridcell nearest to each survey point. In doing so, we assume that the DEM accurately represents the 1956 elevation of the glacier even at locations other than the map contour lines; we validate this assumption in a later section. Thickness changes between 1956 and 1972 show that some localized thickening may have occurred, but this result should be regarded with caution as nearly all of the change indicated by this curve is within the large error bounds (±0.9 m a-1) created by the high contouring error and shorter time-span. Regardless of the dynamics of this early period, however, comparison of the 1972-93 and 1993-2002 periods (where the data are much more accurate as they do not involve the DEM) indicates that the rate of thinning has increased along most of the glacier’s length, except for one region within the mid-ablation area (16001800 m elevation), agreeing with the results of the laser profile comparisons. Thus these pole data independently confirm that the trends revealed by the 1956-93 laser profile time series are real, and suggest that the map errors are likely within the nominal accuracy and thus suitable for use in volume-change calculations. The only assumption left to verify before calculating volume change is that our centerline measurements are representative of changes across the width of the glacier.
Rate of surface elevation change determined from measurements of poles located near the glacier center line. An error bar is shown for measurements involving the 1956 USGS map; errors for the later period are approximately the thickness of the line. Benchmark elevations of the two cross-flow transects are also shown; note that the ice surface elevation is 80–100m below these benchmark elevations, as shown in Figure 5a and b. Note that while most of the glacier appears to have increased the rate of thinning between 1972 and 2002, the same region seen in Figure 3 (1600– 1800 m) seems to not follow this trend as strongly.
Results of cross-flow transect comparisons
The two cross-flow transects (Fig. 5a and b) indicate that the shape of the ice surface has remained remarkably consistent from 1969 to 2003 despite a surface lowering of nearly 40 m. At the lower transect (Fig. 5a; between local monuments B26 and B27), the ice has now disappeared completely due to the terminus retreating past the transect between 1993 and 2003; thus the 2003 measurements were on ground and lateral moraine only and have a different shape. The slope of the exposed lateral moraines is also remarkably consistent; part of this may be due to much of these lateral moraines being ice-cored, with rock slides and the melting of exposed ice interacting to maintain a uniform slope. We estimate the error in spatial extrapolations of center-line data as 1.7 m, found by calculating the standard deviation of the mean elevation of the 2003 cross-flow transect shown in Figure 5b. Thus these cross-flow transects confirm that center-line measurements are generally representative of changes across the width of the glacier, at least in the ablation area where most of the volume change is occurring. It is not clear whether the increased roughness in the upper transect (Fig. 5b; between local monuments B1 and B2) in 2003 is real or a function of increased surveying resolution, but this does not affect the conclusion on spatial extrapolations.
Surface elevation changes at the lower and upper transects. An error bar is shown for the 1956 DEM data; errors in other years are less than the symbol size. (a) The terminus retreated past this transect between 1993 and 2003, so the 2003 measurement is on ground moraine. Elevation difference is measured from local benchmark B27, place in bedrock; the top of the lateral moraine on the east side is located at about –14 m. Distance is measured from the west side (B27). (b) Surface elevation change at the upper transect. The elevation difference is measured from local benchmark B2 anchored in bedrock, and the top of the lateral moraines on the east side is at about –8m. Distance is measured from the west side (B2). (c) Mean ice-surface elevation change at the upper transect. The mean ice surfaces from Figure 3b are plotted as a function of time; the ‘1890’ elevation is based on moraine height. Note the increasing thinning rate. Mean elevation difference is measured from benchmark B2, anchored in bedrock, as in (b).
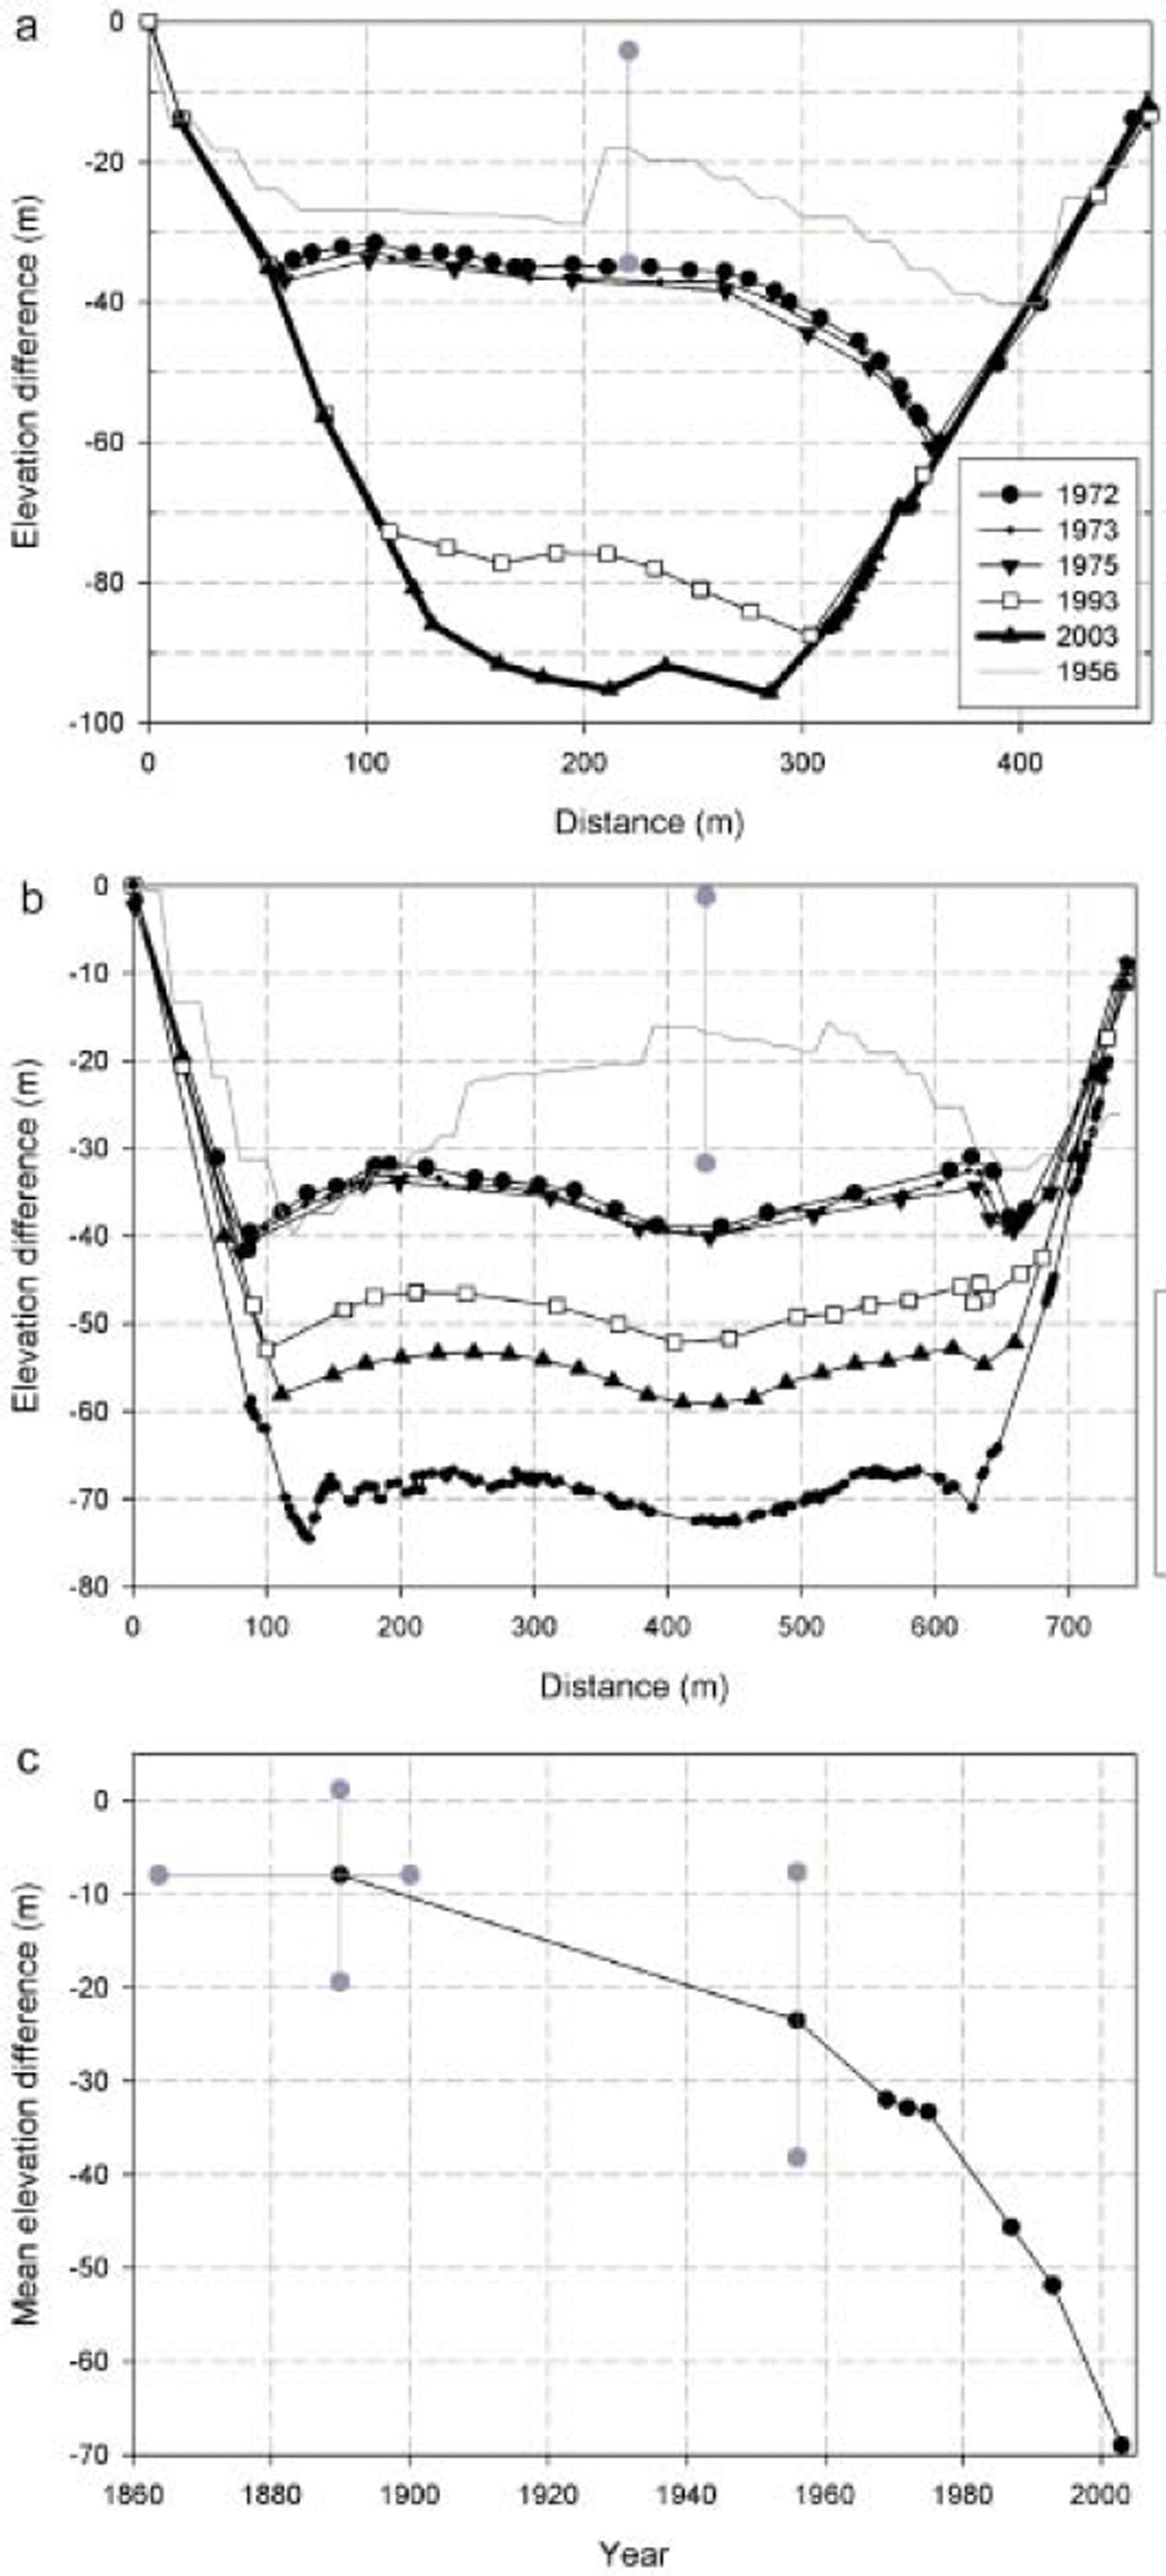
It is likely that the glacier surface shape did not change as radically as indicated between 1956 and 1969 in Figure 5a and b. At both the lower and upper transects, the shapes of the USGS elevation profiles show large discontinuities near the center line that do not match the shape of the surveyed elevations. The consistency of the surveyed profile shapes and our prior indications of the poor quality of this map lead us to believe that these discontinuities reflect errors in the USGS DEM and the map it was derived from. This conclusion suggests that a minor difference in the location of a center-line transect could yield major differences in USGS map comparisons, but we note that long time intervals between comparisons help to reduce the impact of such map errors on volume-change calculations.
In Figure 5c we reformat the same data shown in Figure 5b as the mean ice surface elevation at the upper transect as a function of time, to make it easier to visualize the increasing rate of change at the upper transect and further assess map accuracy. Also included in this figure is an estimate of the glacier elevation in 1890 based on the lateral moraines at the upper transect, noting that these may be time-transgressive and including large error bars on both the date and elevation. From Figure 5c it appears that the rate of thinning at this transect has increased steadily over time since 1890; we discuss the applicability of this to the entire glacier in a later section. This result is physically consistent with prior research indicating negative annual mass balances in every year measured since the IGY (Reference Rabus and EchelmeyerRabus and Echelmeyer, 1998), and the general warming of the Arctic found here and elsewhere (Reference Rabus and EchelmeyerRabus and Echelmeyer, 2002). That the 1956 map is consistent with this long-term trend lends further support that it is accurate enough for reliable volume-change calculations.
Summary of elevation change measurements
Thus three independent datasets (laser altimetry, survey-pole location and cross-flow transect) all point towards the same conclusion: that most of McCall Glacier is thinning at a rate that appears to be increasing with time. The two longitudinal datasets further document that one region of the ablation area is not following this trend. The pole and cross-flow transect data also confirm that though the USGS map does have significant transverse errors, most errors are likely within the nominal map errors and are therefore suitable for volume-change calculations, especially when long time intervals are used to minimize the impact of these errors on the result.
Volume-Change Calculations and Errors
Here we use the center-line laser profile described above to calculate volume change for the periods 1956-93 and 1993-2002. Our primary method for calculating volume change was the same as that of prior research on many Alaskan glaciers using similar laser altimeter profiles (Reference EchelmeyerEchelmeyer and others, 1996; Aðalgeirsdόttir and others, 1998; Reference Rabus and EchelmeyerRabus and Echelmeyer, 1998; Reference Sapiano, Harrison and EchelmeyerSapiano and others, 1998; Reference Arendt, Echelmeyer, Harrison, Lingle and ValentineArendt and others, 2002). The 1993 laser profile, with point spacing about every 1.5 m of ground track, was subsampled to only include those points adjacent to the original contour lines of the paper map (Fig. 1), as described in a previous section. The hypsometry of the glacier was calculated from the USGS NED 15min DEM resampled to 1 m to improve area calculation accuracy, using a geographical information system (GIS; ESRI’s ArcGIS in this case); each hypsometric bin was evenly centered around the contour elevations of the original paper map. The hypsometry was then used to spatially extrapolate the elevation difference of the centerline measurements and calculate volume change. Implicit here is the assumption that center-line surface elevations are representative of the entire elevational bin, which is supported by Figure 5. For the 1993-2002 period, a new hypsometry was constructed by subtracting the measured 1956-93 elevation changes from the 1956 hypsometry for each bin. Elevation change from 1993 to 2002 was calculated for each repeat profile measurement (spaced every 100 m along the original ground track), and these changes were linearly interpolated to determine an elevation change at contour crossing points such that the original hypsometric bin spacing could be reused. The volume-change calculation was then repeated as described above. Glacier-wide average thickness change was found by dividing the total volume change by the average of the old and new glacier areas, based on hypsometry. Rates were calculated using the actual dates of acquisition, except for summer 2002 which was estimated as 15 August (±2 weeks), as described previously.
Because we have a laser profile in both the upper and lower cirques (Fig. 1), we treated the upper cirque independently of the combined lower cirque and ablation area, each with their own hypsometry and volume-change component, which were then summed. Glacier area was measured first via GIS from the DEM, and then updated for more recent periods using measured terminus positions, yielding values of 6.43×10⁶m2 and 6.26×10⁶m2 for 1956 and 1993 respectively. No corrections were made for changes in area at high elevations on the glacier where we observed little change. We estimated the error here in two ways. First was to multiply the glacier perimeter by the 1 m pixel size of the DEM used, which would account for a worst-case error in digitizing the boundary. Second, we compared glacier area as measured by digitizing the paper map to using the USGS’s Digital Raster Graph outline. Both techniques suggest a maximum error of 10% in area determination; note that this does not account for possible errors made by the original cartographers in defining the glacier outline on the paper map. This area error affects only the volume-change calculation, not the areally averaged volume change, adding a negligible amount of random error.
To our knowledge, at the time of this writing no accurate algorithm existed for transforming the NGVD29 datum (which all USGS maps in Alaska use) into any other datum, or vice versa. Therefore we assumed (as has all related prior research (e.g. Reference Arendt, Echelmeyer, Harrison, Lingle and ValentineArendt and others, 2002)) that NGVD29 and NAVD88 are equivalent (which we know they are not), and make use of the several algorithms for transforming NAVD88 into WGS84. Based on comparisons of individual USGS benchmarks, we found that this error is likely represented crudely by a ramp with a 2 m offset (NAVD88 is higher) from Valdez in the south to a 1 m offset in Prudhoe Bay in the north (Reference MauneMaune, 2001). Unfortunately we have no benchmark comparisons near McCall Glacier to assess this error; we suspect it is 1 m or less. When a 1 m systematic error is propagated through the calculation of areally averaged volume change, the error bounds are unaffected. This shift is also likely offset by the 1 m cartographic offset found by Reference Rabus and EchelmeyerRabus and Echelmeyer (1998) as described previously.
There are several other potential errors that can affect our volume-change calculations. The largest errors result from use of the USGS map. In the ablation area, where contrast is typically reasonable, we assumed the nominal error of 15 m. Prior research (Aðalgeirsdόttir and others, 1998; Reference Arendt, Echelmeyer, Harrison, Lingle and ValentineArendt and others, 2002) assumed an accumulation area error of 45 m (three times nominal), based on work on the Harding Icefield. On the narrow McCall Glacier, Figures 3-5 confirm that the map errors are likely not this large, and we, somewhat subjectively, increased our error estimate in the accumulation area by 50% above the nominal accuracy, to 22.5 m. As described previously, we estimated the error in spatial extrapolations of center-line data as 1.7 m and estimated elevation measurement errors at 0.3 m for laser altimetry and 0.1 m for ground-based DGPS. These independent, random errors were combined in the standard way, and divided by the appropriate time interval for rate calculations; the ± 2 week uncertainty in the 2002 end-of-summer date had a negligible influence on errors.
Using these methods, we confirm that the glacier is losing mass at an increasing rate with time. The areally averaged rates of volume change (in water equivalents) were -0.35 ± 0.07 m a-1 to -0.47 ± 0.03 m a-1 , for the 1956-93 and 1993-2002 periods respectively; total volume loss was (8.3 × 10⁷) ± (1.7 × 10⁷)m3 and (2.7 × 10⁷) ± (0.2 × 10⁷)m3 for the two periods.
Though it did not affect our error calculations, it is worth mentioning that the USGS map yields a glacier area of 6.4 km2 whereas the IGY map made 2 years later yields 7.4 km2. Each area is well outside the possible digitizing error of the other map. The difference probably results from cartographic decisions on whether steep, thin ice veneers surrounding the glacier should be included in the glacier outline. While these veneers may play a role in glacier mass balance, as they significantly change the albedo and melt characteristics compared to bare-rock slopes (Nolan, unpublished data), their contribution to glacier volume change is likely very small since they are so thin. Further, our centerline measurements are probably poorly representatives of changes to this steep ice. Errors in glacier area do not affect areally averaged volume change, so we did not include any additional error terms for this in that calculation. In any case, given these map discrepancies, we caution that our volume-change estimates are best used in a relative sense between time periods rather than as absolute indications of volume loss.
Comparisons with Other Methods of Volume-Change Calculation
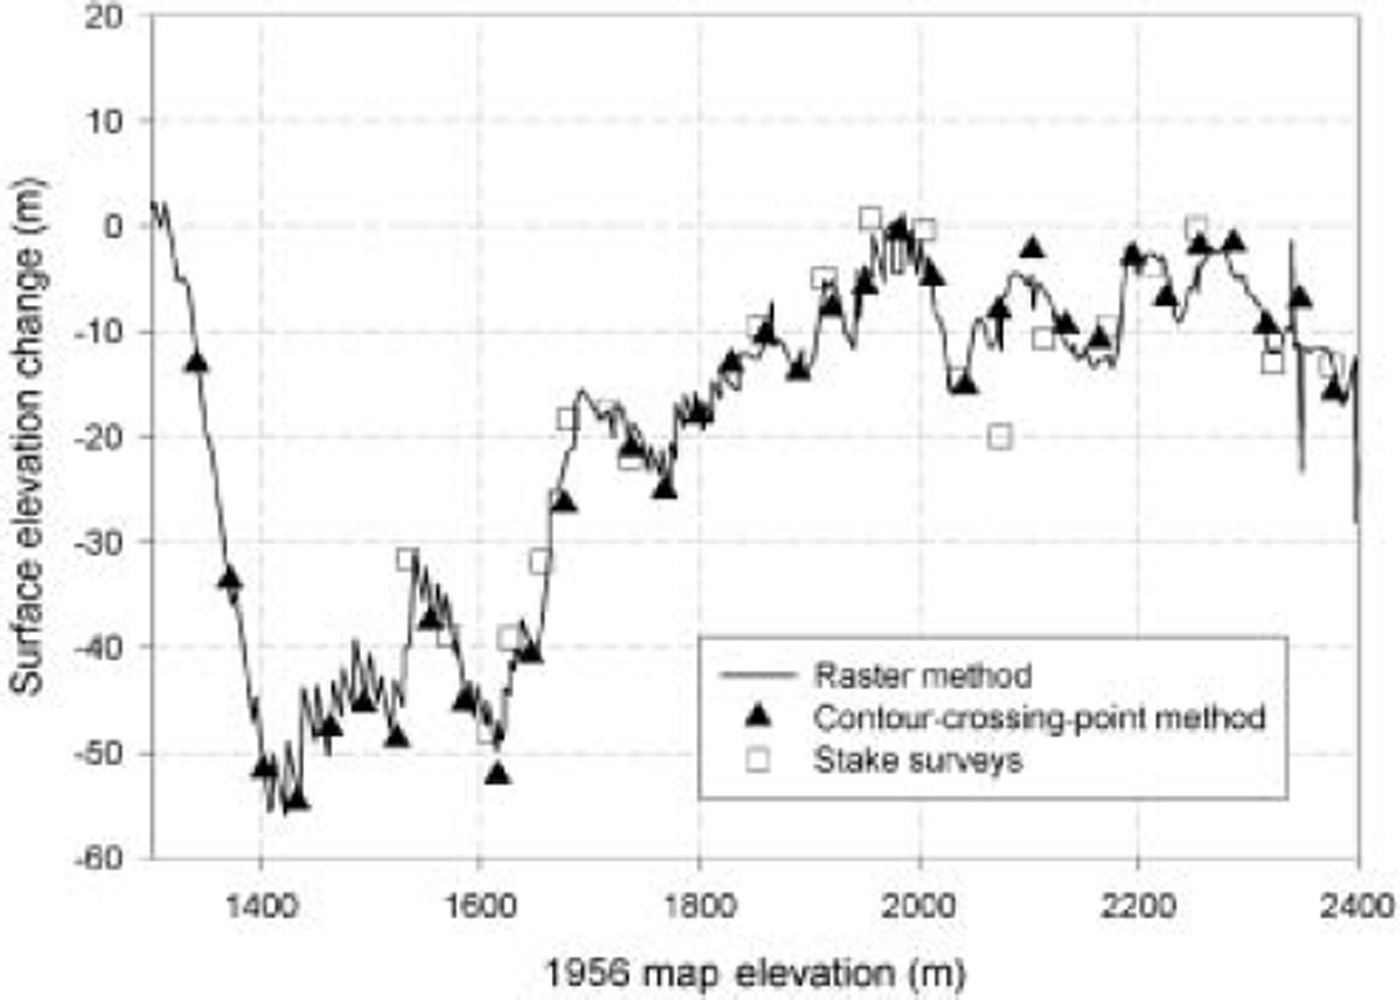
To compare the quality of the NED DEM to the contour map, we extracted DEM elevations along the 1993 laser altimetry profiles and differenced the extracted elevations with the measured laser altimetry elevations for the complete laser profile. Figure 6 presents a comparison of surface elevation change using this technique (labeled ‘raster method’) with the standard contour-crossing-point method for the 1956-93 period (recall that calculating elevation differences using the contour-crossing-point method does not involve the DEM). The sawtooth appearance of the raster method is caused by the large pixel size of the raw DEM: because laser profile points are spaced about 1.3 m apart and the DEM pixels are 45 m wide, as many as 35 profile elevations (all different) may be compared to the same DEM pixel elevation. This sawtooth pattern can be eliminated by resampling the DEM to about 1 m pixel size or subsampling the profile points, but here no new information is introduced and the effect is largely cosmetic. The differences in elevation determined by the two methods are minor (typically much less than 1 m), resulting in areally averaged volume changes of 0.35 and 0.37 m a-1 for the contour-crossing-point and raster methods, respectively. This correspondence suggests that the DEM accurately represents the map contour elevations, at least along the glacier center line, and could be used for volume-change calculations. As an additional check we created a new contour map from the DEM and overlaid this on a georeferenced image of the paper map. We found only slight differences between the two maps, suggesting that spatial differences here are small as well. We also note that although the raster method compared well with the contour-crossing-point method for McCall Glacier, further testing should be done with other glaciers before it is used to calculate glacier thickness changes. In particular, we have found small DEM errors at map edges produce elevations that are not consistent with the original paper-map elevations.
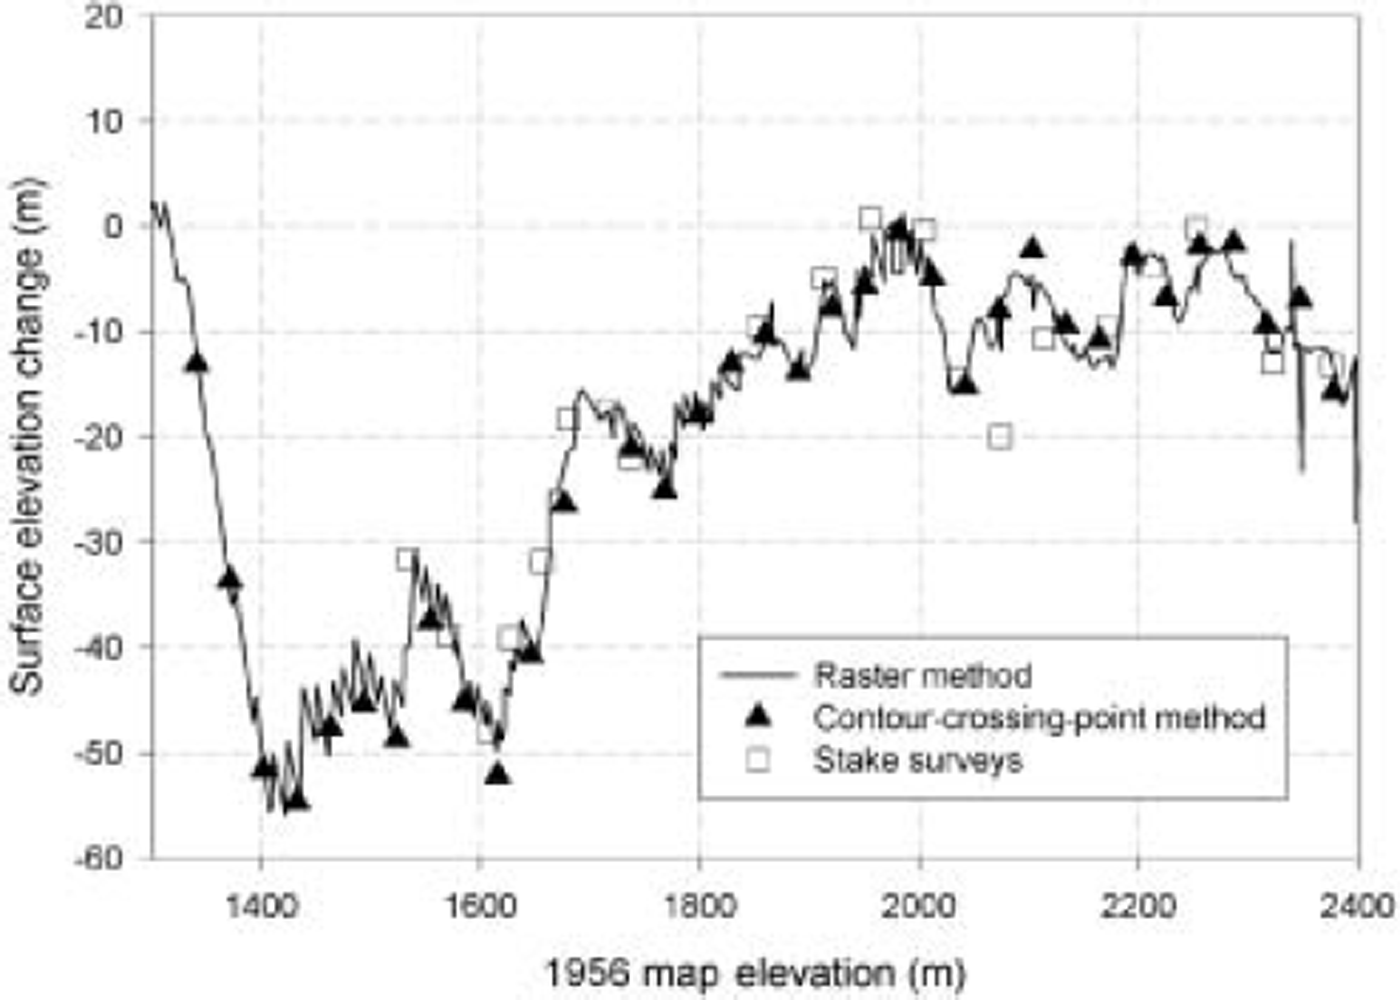
We also found that the volume change calculated from the stake network yields results identical to that from the longitudinal profiles. To calculate volume change using the stake elevations, we extracted elevations from the 45m DEM similar to above, calculated the change in elevation over time, linearly interpolated between these elevation changes to determine an elevation change at each contour crossing point, and then used our standard methods from there. These elevation changes are also shown in Figure 6. This method results in a longitudinally averaged thinning rate of 0.36 ma–1, similar to that determined from the higher-resolution laser altimetry profile. Note that no data were used from the lower cirque for the analyses in Figure 6. The close correspondence between these results suggests that no major blunders have occurred in our processing and datum transformations in either the laser altimetry or stake datasets, and that each of these techniques (contour-crossing, raster and stake) yields consistent results.
While Figure 6 shows that the results of these three methods are nearly identical, initial attempts at this comparison produced substantially different results. We discuss these problems as a cautionary note for anyone attempting similar research on other glaciers. A major underlying problem is a reliance on black-box GIS software and poorly documented DEMs. The first two authors worked independently to develop a raster method for use in the stake method. One author reprojected and transformed the DEM to match the native format of the GPS points, while the other author reprojected and transformed the GPS points to match the native DEM. The latter proved to be the most trustworthy, as it turns out that the DEM transformation software (Erdas Imagine) was improperly making use of an algorithm which is not valid for Alaska. We would not have discovered this transformation error without employing several independent techniques, and had we relied only on Erdas Imagine software, our 1956 elevations would have been systematically in error by an additional 8.5m due solely to this datum transformation error.
Discussion of Results
Our results document the same trend as observed by prior research here: that McCall Glacier is losing mass at a rate that is likely increasing with time. There is no evidence for significant thickening in the accumulation area, and all measurements of surface elevation down-glacier consistently reveal thinning. Prior volume-loss calculations using similar methods (Reference Rabus, Echelmeyer, Trabant and BensonRabus and others, 1995; Reference Rabus and EchelmeyerRabus and Echelmeyer, 1998) also support this conclusion: 0.28 ma–1 for the 1956–93 period, 0.33 m a–1 for 1972–93, and 0.60 m a–1 for 1993–96. We can reproduce these prior volume changes nearly exactly when they do not involve the 1956 USGS map. For the 1956–93 period we calculated 0.35 m a–1 (0.07ma–1 higher than the prior results) and assert that the difference between the two results is more an independent assessment of the scatter to be expected when different methods are used with this 1956 map rather than one or the other value being more accurate. For example, we chose to filter out three outlying points in the DEM, and the effect of this alone accounts for 0.03 of the 0.07 ma–1 difference in rate. Also, the earlier work used a hand-digitized contour map, resulting in a different elevation changes at contour crossing points, and these differences become amplified when distributed using the different hypsometry from this digitization; this likely accounts for most of the remaining difference. For example, the lateral jumps in elevation on the USGS DEM shown in Figure 5a and b are likely artifacts of the surfacing algorithm used by the USGS, and a hand digitization would likely result in slightly different artifacts. The prior work also used a more sophisticated algorithm for calculating new area, and a different algorithm for calculating the geoid correction (Alaska96 vs Alaska99), which yield minor differences. We chose to retain our result for two reasons: first, it is more consistent with the practices used in Reference Arendt, Echelmeyer, Harrison, Lingle and ValentineArendt and others (2002), thus providing more direct comparisons with those glaciers; and second, it provides an estimate of the scatter that can be expected when two rigorous but slightly different techniques are used to calculate volume change. Another outcome of this research that is similar to prior findings is that the calculation of volume change involving older map products is a tricky and frustrating business. This work also illustrates the need for new topographic maps with reduced errors, so that we will not continue to suffer from the same limitations in the future.
The volume change of McCall Glacier is comparable to trends in other regions of Alaska. A similar recent study (Reference Arendt, Echelmeyer, Harrison, Lingle and ValentineArendt and others, 2002) found that the average rate of glacier-wide thinning more than tripled from 0.52m a–1 between the mid-1950s and mid-1990s to 1.8 ma–1 from the mid-1990s to 2001–02 (dates here varied by several years depending on the glacier) for the 28 Alaskan glaciers measured (all south of McCall Glacier). However, excluding all tidewater and surging glaciers, where non-climatic factors are particularly significant, these values change to 0.51 and 0.81 m a–1, respectively, for the 17 glaciers remaining, yielding a ratio of 1.6 between the early- and late-period volume change; note that these are areally weighted estimates, following the methods of Reference Arendt, Echelmeyer, Harrison, Lingle and ValentineArendt and others (2002). The remaining glaciers therefore likely represent a better comparison to the land-terminating McCall Glacier, where we found a ratio of 1.4, similar to that of the other glaciers. These ratios (1.4 and 1.6) seem close enough to conclude that McCall Glacier is following the same trend as the rest of Alaska’s glaciers. The difference in rates is too small, however, to make any conclusions regarding the spatial differences in the causal climate change or the dynamical differences in glacier response, without also analyzing other datasets.
The amount of ice lost from McCall Glacier over the past 50 years does not significantly contribute to sea-level rise, amounting to <0.01 μm a–1. The recent annual discharge of water released due to volume loss on McCall Glacier is about 0.003 km3 a–1, compared to the roughly 300 km3 annual discharge from the nearby McKenzie River. Even taken over the larger scale of all Brooks Range glaciers, the effect of this fresh-water input into the Arctic Ocean is likely to be minor compared to variations in other sources of fresh water into the Arctic Ocean, though the timing of discharge (later in the summer than coastal-plain snowmelt) may have some subtle chemical or biological effects in stream and coastal dynamics or the biota that depend on them.
Perhaps the most interesting result of our longitudinal profiles, after their use in volume-change calculations, is the identification of a region of the glacier that appears not to be increasing its rate of surface loss (Figs 3 and 4; 1600–1800 m). Several lines of evidence, including velocity measurements, ice radar and thermomechanical modeling, have indicated that >50% of the surface speeds here cannot be accounted for by cold-ice deformation alone: basal motion or warm-ice deformation or both must be playing a role (Reference Pattyn, Nolan, Rabus and TakahashiPattyn and others, 2005). Further modeling and fieldwork are planned to both distinguish the source of the increased velocity and then relate it to the observed spatial and temporal trends in thinning rates. Regardless of cause, these spatial variations in longitudinal thinning rates confirm that cross-flow transects alone cannot be used to represent glacier-wide changes. For example, if the upper transect had been located in this anomalous region, only 1 km up-glacier, then Figure 5c would look quite different because it would show little or no change in thinning rate. However, given what we know about the glacier, it seems likely that Figure 5c is probably qualitatively representative of the glacier as a whole. Based on similar measurements on other Brooks Range glaciers (not presented here) and the results of Reference Rabus and EchelmeyerRabus and Echelmeyer (1998), Figure 5c is also probably qualitatively representative of most glaciers in this region of Arctic Alaska.
Acknowledgements
We thank B. Johns, K. Irving, A. Ellsberg and K.S. Nolan for their help in acquiring the 2003 field data, as well as K. Echelmeyer, V. Valentine and S. Zirnheld for acquiring, processing and archiving the 1993 altimetry data. We also thank H. Jiskoot, S. Ommaney and W. Harrison for reviews that substantially improved the manuscript, as well as the US Fish and Wildlife Service for their support of this project. This work was funded by the NSF’s Arctic System Science Program’s Freshwater Initiative (grant No. 0229705); any opinions, findings and conclusions or recommendations expressed in this material are those of the authors and do not necessarily reflect the views of the NSF.