Introduction
A good irrigation management system is needed in strawberry cultivation, because of the high sensitivity of strawberry plants to water deficits and waterlogging. It has been shown in previous studies that water stress at different growth stages has a strong effect on plant growth, fruit quality and yield (Krüger et al., Reference Krüger, Schmidt and Brückner1999). Stomatal opening is one of the main physiological processes affected under water stress conditions (Hsiao and Acevedo, Reference Hsiao and Acevedo1974), and is highly important because it is the main water passway controlled by the plant during gaseous exchanges. On the other hand, strawberries are sensitive to waterlogging that causes the roots to suffer from oxygen deficiency, and provides optimal conditions for soil-borne microbial and fungal diseases. However, to determine the optimal use of inputs, and allow a site-specific treatment against production limiting factors, a continuous monitoring and proper understanding of plant physiological processes in relation to the environment is vital. Traditionally this has been carried out by visual examination of the strawberry crops. However these methods are limited by the ability of the human eye to discriminate between healthy plants and plants suffering from stress. Often a stress reaction has to be well-advanced before visual symptoms become noticeable even to experienced observers. The development of aerial and ground-based hyperspectral and multispectral imaging technology has been a major breakthrough in the expansion and practical application of precision agriculture techniques. Spectral reflectance of plants in the visible and near infrared region of the electromagnetic spectrum is primarily affected by plant pigments and cellular structure of the leaves. Stress factors can alter these plant parameters, which will reflect in a change in the reflectance signal. Spectral characteristics can therefore be used as indications of plant health. Remote detection, mapping and monitoring of such plant health parameters provides essential information for making timely and effective management decisions. Recent developments in Remotely Piloted Aircraft Systems (RPAS) allow faster and more cost-efficient collection of aerial imagery on a local scale.
VITO (Flemish Institute for Technological Research) has developed a small and lightweight hyperspectral camera system. In contract to traditional pushbroom hyperspectral cameras,the COSI system (Compact hyperspectral Imaging system) is conceptually very similar to a standard RGB camera in the sense that it acquires 2 dimensional images. A filter with many adjacent narrow spectral bands (5–10 nm), covering the spectral range of 600–900 nm, is placed on the image sensor. The spectral range is favourable for agricultural and vegetation studies. Chlorophyll absorption is captured around 680 nm, the red-edge region (680–730 nm) is linked to plant stress and the NIR region (700–1400 nm) gives an indication of the internal plant structure, in close relation with the leaf area index and plant biomass. Bit depth of the camera can be either 8 or 10 bit. In addition, the high spatial resolution (focal length of 9 mm realizing 2.5 cm GSD from 40 m) allows detection of individual crops on the field.
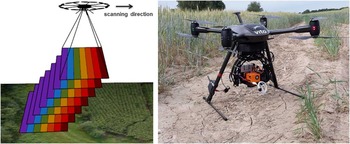
Images are taken in rapid succession so that every location on the ground is imaged by all spectral bands (Figure 1) creating hyperspectral images of very high spatial resolution (2.5 cm at 65 m flight altitude) (Sima et al., Reference Sima, Baeck, Nuyts, Delalieux, Livens, Blommaert, Delauré and Boonen2016). Using a processing solution developed at VITO, the raw image data of the camera is transformed into a hyperspectral reflectance image product containing orthomosaics for all 72 spectral bands.
Principle of data acquisition with a COSI system on a RPAS (left) – the system (right) .

In this study, the potential of the COSI system to monitor the health status of strawberry plots under different irrigation treatments is investigated. This should allow for a timely, efficient and sustainable irrigation management system.
Materials and methods
Field experiment
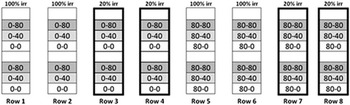
Cold stored bare rooted frigo plants of commercial cultivar ‘Elsanta‘ were used in this trial. Plants were grown in 60 cm wide beds in full soil covered with PE-foil at a planting density of 40,000 plants/ha. All plants were spaced in two rows down the bed at six plants per running meter. The beds were spaced 90 cm from each other. There were six different nitrogen fertilization treatments and two irrigation treatments resulting in 12 (nitrogen fertilization x irrigation) different objects (Figure 2). For each treatment combination (object) there were four replicate plots of six meter (36 plants). Production, fruit classification, fruit firmness, shelf life, brix content, fruit color and soil moisture content were monitored during the season. Also gravimetric soil water content and leaf water potential parameters were measured at regular time intervals (7 times) from the 23rd of April until 1st of July.
Schematic overview of the experimental strawberry field at PcFruit, St Truiden, Belgium. Each column (Row 1-Row 8) represents a strawberry bed of 50 m. Irrigation regimes are given at the top of each column (100% irr: full irrigation (−20/−30kPa); 20% irr: 20% of full irrigation). Each cell per column represents a plot of six running meters of strawberry bed. Nitrogen fertilization doses are given inside each cell. The first number indicates the amount (kg) of N/ha given under the plastic foil at the beginning of the season (August 2014). The second number indicates the amount (kg) of N/ha given by means of fertigation in small doses starting from regrowth in springtime (March 2015).

Climate
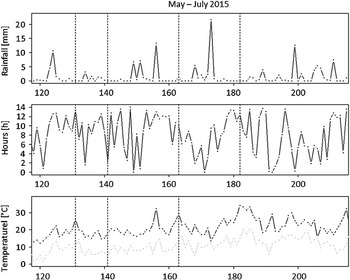
Rainfall, hours of sunshine and temperature (min and max) were recorded during the growing season (Figure 3). The hyperspectral UAV-borne data were captured at 21/05/2015 and 12/06/2015 ( resp. days 141 and 165 of the year 2015), indicated by the 2nd and 3rd vertical dashed line.
Data of rainfall, hours of sunshine and temperature (min and max) measured during the growing season of 2015.

Flight campaign
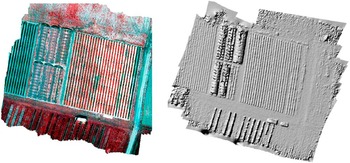
In the growing season of 2015, two RPAS flights were performed over an experimental strawberry field at PcFruit, Sint-Truiden, Belgium. On the 25th of May and 12th of June 2015 the COSI system recorded about 15,000 spectral images in the 600–900 nm spectral region. The full workflow involved flight planning, Ground Control Points (GCP) layout and measurements, photogrammetric flight, tie point extraction, bundle adjustment, photogrammetric DSM (Digital Surface Model) extraction & orthophoto creation (Figure 4). Deriving georeferenced data products from the COSI system proved challenging (Sima et al., Reference Sima, Baeck, Nuyts, Delalieux, Livens, Blommaert, Delauré and Boonen2016). The underlying reason was that in a spatio-spectral imager, the spectral information of a point is distributed over a series of frame images. Since existing techniques were not able to cope with this, a custom photogrammetry – based software solution was developed.
An overview of the experimental strawberry field at PcFruit, St Truiden, Belgium. (Left) False colour composite (R=801.7 nm, G=672.6 nm, B=604.0 nm). (Right) Digital Surface Model of the region of interest.

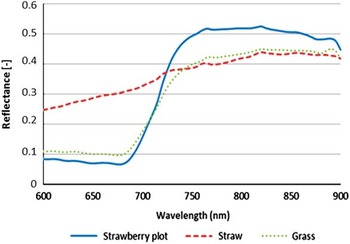
Producing radiometrically accurate data was also an important challenge. Illumination typically changes over time, often rapidly with changing haze and cloud conditions. The studied objects often exhibit strong BRDF effects so that acquisitions, even within a single frame image, produce angle-dependent results. While these causes are common to all aerial imaging systems, their impact can be more severe for spatio-spectral images, where different spectral bands of a point are acquired at different times and under different angles.The resulting hyperspectral signal for different objects as obtained with the COSI-cam is shown in Figure 5.
Average reflectance spectra of different vegetation types as acquired with the COSI-Cam

Image analysis
Plant height was estimated by using the digital surface models (DSM). Digital terrain models (DTM) were calculated and substracted from the DSM in order to obtain the final Digital elevation model (DEM). Polygons were drawn for each experimental plot and average plot height values were extracted. Boxplots were created to display variation in treatment groups.
Subsequently, plant health was monitored by analyzing the spectral data (orthophoto). In a first instance, the background was masked out by calculating the Normalized Difference Vegetation Index (NDVI). A threshold was set on these index values, so that only ‘green’ pixels were retained for further analysis. On these individual pixels and aggregated pixels (experimental plots), the red edge inflection point (REIP) known as early stress indicator, and a chlorophyll-b related index (PSSRb=R800/R635; Blackburn, Reference Blackburn1998) were derived.
Results and discussion
The field experiment showed a higher production in all treatments with 100% irrigation (row 1–2 and row 5–6 in Figure 2) compared to the treatments with 20% irrigation. This was reflected in an average of 2.5 ton/ha more production, a significant difference between the amount of class 1 fruits (>31 mm), and 35–40% more big fruits.
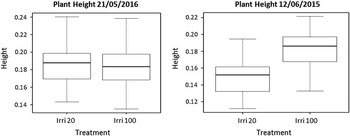
Plant heights per irrigation treatment (i.e., 24 plots per treatment, 20% vs. 100% irrigation dose) are calculated and shown in Figure 6. It is clear that a difference between plant heights per plot exists on the second measurement day (12/06). By that time, as expected based on the climate data (Figure 3), plants had suffered from high temperatures and a prolonged drought period.
Boxplots showing, for each irrigation treatment (20% vs 100% irrigation), the variation in average plant height per plot on 21/05/2015 and 12/06/2015.

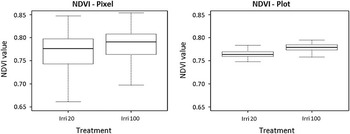
Spectral analyses confirmed this finding. The most well-known vegetation index related to green leaf biomass, i.e., the Normalized Difference Vegetation Index (NDVI), showed a significant difference at plot level on 12th of June, whereas at the pixel-level the results were less clear due to more variability within the group of single pixels (Figure 7). This can be addressed to the very high spatial resolution, which shows the highly heterogeneous information of the strawberry plants (i.e. berries, leaves, flowers, shadow, mixed pixels) and undesired objects, like grass and weed pixels. Since we are interested in the impact of different irrigation treatments on strawberry cultivation, it is more realistic to further analyse the spectral information at plot level instead of at pixel (sub-plant) level. The experimental plot was set-up in such a way that we could hypothesize uniform plant growth and plant conditions within each plot.
Boxplots showing, for each irrigation treatment (20% vs 100% irrigation), the variation in NDVI values at pixel level (left) and at plot level (right). Data acquired at 12th June 2015.

Gravimetric water content measurements also showed a significant difference between 20% and 100% irrigated plots, starting from the 21st of May (17.49% vs 19.73%) onwards (at 12/06: 14.90% vs 21.86%). It is known that prior to growth inhibition, photosynthesis is influenced by water deficit. This means that physiological changes due to drought should be detectable in the plots before the actual growth differences could be seen on the 12th of June.
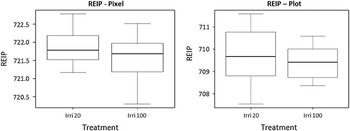
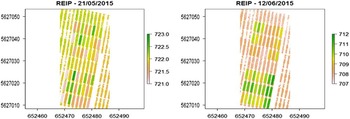
Current results from the spectral analysis did not meet the expectations in that an early detection of water deficit would be possible at 21st of May. The REIP (Red edge Inflection Point), known as early stress indicator, did not allow distinguishing between treatments with 100% irrigation and those with 20% at the two measurement days (Figure 8 and 9). Although significant differences in gravimetric soil water content were measures, leaf water potential measurements did not differ significantly. Since the reference value of gravimetric water content at wilting point is absent, it is assumed, based on these findings, that no plant stress is present on the 21st of May.
Boxplots showing, for each irrigation treatment (20% vs 100% irrigation), the variation in wavelength values at pixel level (left) and at plot level (right). Data acquired at 12th June 2015The wavelength at the REIP is calculated per plot and the average number is shown on this figure. Yellow and grey plots have their inflection point at lower wavelengths.

The wavelength at the REIP is calculated per plot and the average number is shown on this figure. Yellow and orange plots have their inflection point at lower wavelengths compared to the green coloured plots.

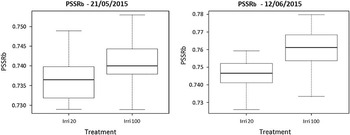
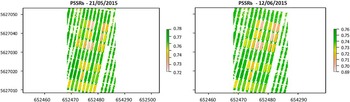
The Pigment Specific Simple Ratio Index PSSRb which is closely related to the Chlorophyll b content indicated higher values for the 100% irrigated plots compared to the 20% irrigation treatment. Although no significant difference was detected in May (Figure 10 and 11), differences between the two treatments became more apparent after a longer time period (June). This PSSRb index is positively related to the plants’ Chlorophyll-b content, which is a pigment that helps in photosynthesis by absorbing light energy. Row 3–4 and 5–6 (Figure 2) received lower amounts of irrigation and the chlorophyll content of these plants was clearly lower than that of the plants in row 1–2 and 5–6 at 12/6.
Boxplots representing the PSSRb values of both irrigation regimes at the two measurement days.

The PSSRb index is calculated per plot and the average number is shown on this figure. Yellow and orange plots have lower PSSRb index values than the green coloured plots.

Conclusions
The hyperspectral data from the COSI-cam was analysed for spectral indicators related to biomass, pigments, senescence, and stress, in order to explore the possibilities for early detection of water stress. The field experiment illustrated the potential of the hyperspectral camera system. The variations over the field were visible, even at small scale. Although no statistically significant difference could be found between the different irrigation treatments at the first measurement day (21/05), a tendency was already visible in the PSSRb index which became more pronounced in the second data acquisition. This index is positively related to plant Chlorophyll b. The REIP indicator did not detect any early drought stress at 21st of May.
Drought stress and plant health problems can be unraveled by data acquisition with the COSI-cam. Based on this information it should be possible that management decisions can be better targeted within agricultural fields. Making management decisions based on the acquired hyperspectral data is still a test case and needs more validation, but a detailed monitoring of experimental field is already feasible.
Acknowledgements
Technical support and input: PcFruit npo and VITO NV; Financial support: Flemish Government and VITO.