INTRODUCTION
Semi-intensive production earthen ponds may be compared to low water-renewal areas of lagoon systems that are submitted to continuous organic inputs (Barnes, Reference Barnes1980; Kelly & Naguib, Reference Kelly and Naguib1984). If moderate organic inputs are present, it is generally reflected in an increase of growth rates of phytoplankton and macroalgae and, afterwards, of zoobenthos (Gray, Reference Gray, Colombo, Ferrari, Ceccherelli and Rossi1992; Bachelet et al., Reference Bachelet, Montaudouin, Auby and Labourg2000). However, when the amounts of nutrients in a system exceed those consumed by the organisms, negative effects on benthic fauna and flora may be observed, such as changes in species composition (Pearson & Rosenberg, Reference Pearson and Rosenberg1978; Beukema, Reference Beukema1991; Perus & Bonsdorff, Reference Perus and Bonsdorff2004) and mass growth of macroalgae (Raffaelli, Reference Raffaelli1999; Sfriso et al., Reference Sfriso, Birkemeyer and Ghetti2001). In extreme conditions, dissolved oxygen depletion and the production of toxic products, such as H2S (Holmer & Kristensen, Reference Holmer and Kristensen1992; Cancela da Fonseca et al., Reference Cancela da Fonseca, Bernardo, Costa, Falcão and Vale2001a) may lead to the disappearance of benthic fauna, creating an azoic zone (Heilskov & Holmer, Reference Heilskov and Holmer2001).
Usually, the quality of fish production areas is monitored in the water column using physico-chemical metrics (e.g. dissolved oxygen and nutrients). However, biological metrics show a faster and more sensitive response to changes in the quality of benthic environment and ultimately of the water column (Edgar et al., Reference Edgar, Macleod, Mawbey and Shields2005). Moreover, most of the times, abiotic metrics have little value unless they are related to organisms. For example, a reduction in redox potential from 100 to 0 has little significance to managers unless other information is available on how such a change affects the plants and animals in the area (Edgar et al., Reference Edgar, Macleod, Mawbey and Shields2005). The maintenance of macrobenthic communities within earthen ponds is very important as it is widely recognized that benthic fauna plays an important role in supplying and mineralizing organic matter (Heilskov & Holmer, Reference Heilskov and Holmer2001) but may be also a food resource for the cultivated fish (Gamito, Reference Gamito1997). The ability of marine benthic animals to establish and maintain themselves under certain environmental conditions is mainly determined by physiological requests, such as food intake (Boström & Mattila, Reference Boström and Mattila1999; Cardoso et al., Reference Cardoso, Bankovic, Raffaelli and Pardal2007). This is in turn influenced by the feeding pattern and the ability to make use of the food potentially available in the area (Gaston, Reference Gaston1987). Therefore, different feeding strategies are influenced by environmental factors (e.g. stability, particle size, water, organic content and oxygen content in the sediment) and, consequently, the distribution of trophic groups among macrobenthic communities (Snelgrove & Butman, Reference Snelgrove and Butman1994; Sfriso et al., Reference Sfriso, Birkemeyer and Ghetti2001; Cardoso et al., Reference Cardoso, Pardal, Lillebø, Ferreira, Raffaelli and Marques2004; Perus & Bonsdorff, Reference Perus and Bonsdorff2004). Some authors have already tested the use of macrobenthos feeding guilds' distribution to assess impacts (Cardoso et al., Reference Cardoso, Pardal, Lillebø, Ferreira, Raffaelli and Marques2004) and examined the relationships between feeding guilds and environmental variables (Arvanitidis et al., Reference Arvanitidis, Koutsoubas, Dounas and Eleftheriou1999; Bonsdorff & Pearson, Reference Bonsdorff and Pearson1999; Bazaïri et al., Reference Bazaïri, Bayed, Glémarec and Hily2003; Cardoso et al., Reference Cardoso, Pardal, Lillebø, Ferreira, Raffaelli and Marques2004).
Macrobenthic communities are worldwide used as bioindicators (e.g. Diaz & Rosenberg, Reference Diaz and Rosenberg1995; Belan, Reference Belan2003; Cardoso et al., Reference Cardoso, Pardal, Lillebø, Ferreira, Raffaelli and Marques2004, Reference Cardoso, Bankovic, Raffaelli and Pardal2007; Carvalho et al., Reference Carvalho, Moura and Sprung2006b, Reference Carvalho, Gaspar, Moura, Vale, Antunes, Gil, Cancela da Fonseca and Falcãoc) and were already tested regarding effects of salmon aquaculture in the environment (Haya et al., Reference Haya, Burridge and Chang2001; Pohle et al., Reference Pohle, Frost and Findlay2001). Nevertheless, to our knowledge no information is available concerning macrobenthic seasonal patterns in semi-intensive earthen ponds, where the organisms are under a constant nutrient input resulting from the food added during the production cycle. A better knowledge of the macrobenthic dynamics may be a valuable tool for a more proper management of these production systems. In this context, a study was undertaken during a 13-month period in order to analyse the influence of sediment organic enrichment on the temporal patterns and functional properties of macrobenthic communities in fish ponds from the Ria Formosa lagoon. Macrobenthic community structure, trophic functional analysis and several biotic metrics were tested in order to assess their effectiveness in discriminating potential impacts of fish production in earthen ponds.
MATERIALS AND METHODS
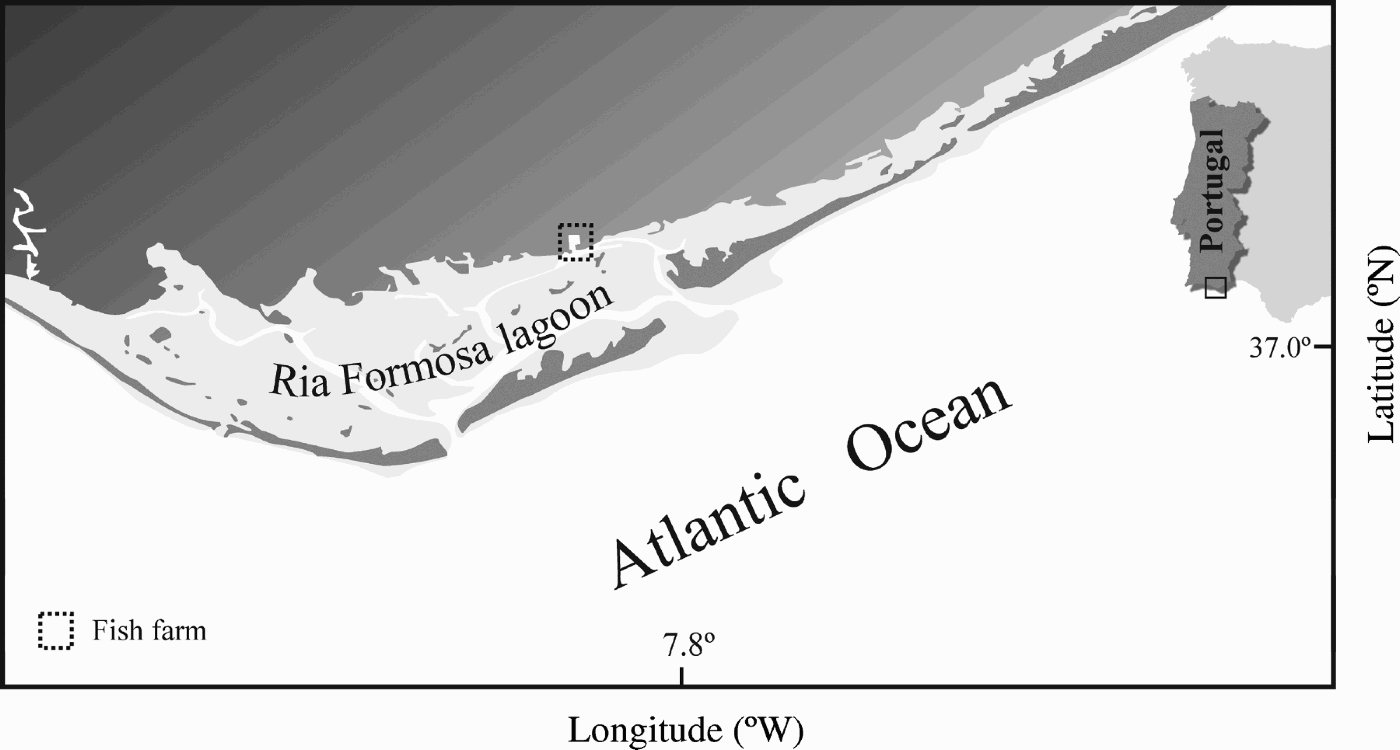
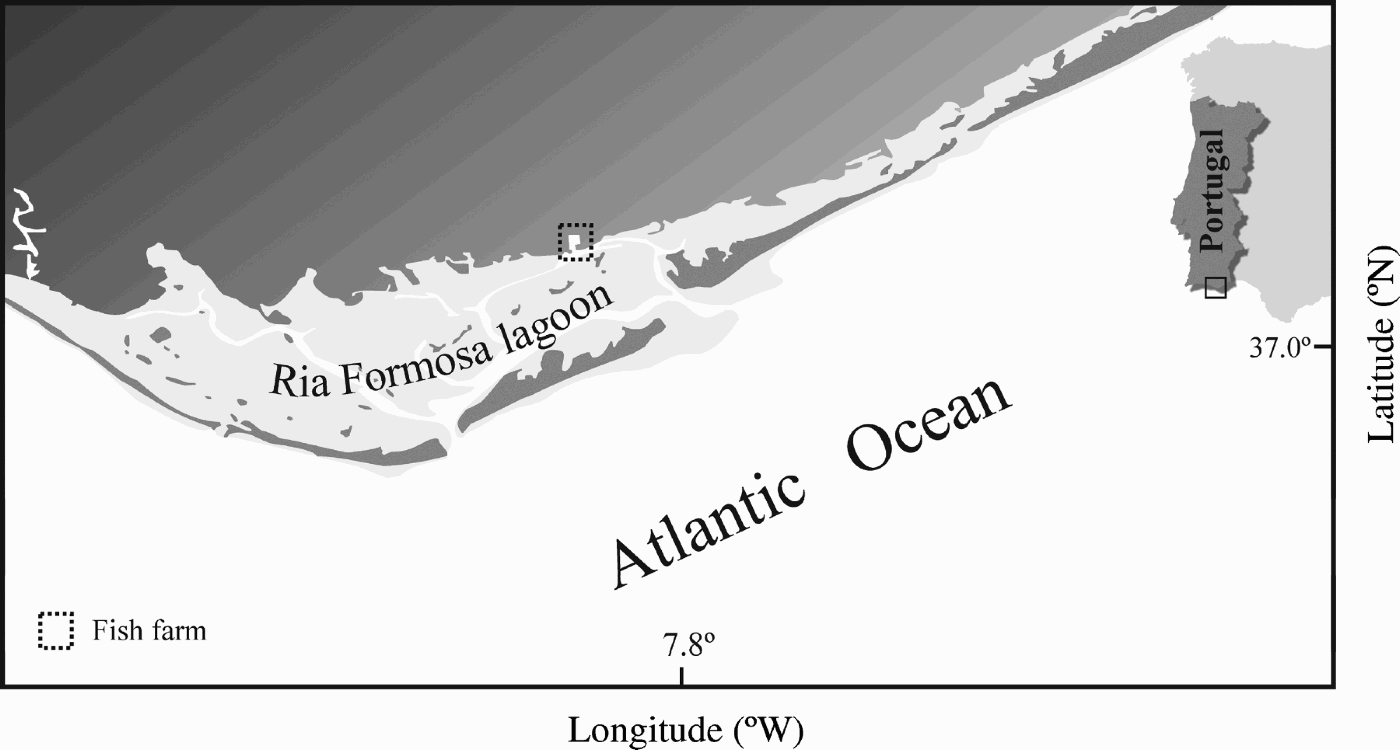
The present study was undertaken in the Olhão Fish Culture Experimental Station of the INRB, IP/IPIMAR, located in the Ria Formosa lagoon (southern Portugal; Figure 1). Sampling was carried out in two Diplodus sargus (L.) (white sea bream) production ponds with an area of approximately 400 m2 and a water depth of 1.5 m. In each pond the water entrance is positioned at one edge and the water exit and the automatic feeder are positioned at the opposite edge. The ponds are filled up with seawater pumped from the water reservoir, a main tank that receives water directly from the lagoon during spring tides. The daily water turnover rate varied between 20% and 40%, depending on water temperature and fish biomass. Fish from the production ponds were fed with dry pellets for 15 minutes every hour, between sunrise and sunset, using an automatic feeder.
Location of the Olhão Fish Culture Experimental Station in Ria Formosa lagoon (southern Portugal).
Macrobenthic sampling was carried out monthly during a 13-month period, beginning in September 2004 in two ponds (A and B). Two sampling campaigns were undertaken before the beginning of a Diplodus sargus production cycle (September and October 2004). Within each pond, two areas were established, the water entrance area and the feeding area and 9 replicate corers (9 cm internal diameter) were taken within each area. Samples were washed through a 0.5 mm square mesh sieve, and the retained material was preserved in 4% buffered formalin stained with rose Bengal, in order to distinguish the organisms. Biomass, expressed as ash-free dry weight (AFDW; ±0.0001 g) was determined per area, pond and month.
For the study of the environmental parameters, 4 corers (5 cm i.d.) were taken per area, pond and sampling period. Samples were immediately frozen until subsequent analysis. The determination of chlorophyll-a (chl-a), phaeopigments (phaeo) and organic matter (LOI) were undertaken in sub-samples of the top 1 cm layer. Part of the sample was dried to 80°C until constant weight was obtained and then grounded to a fine powder. The LOI content was determined by ‘loss on ignition’ of dried sediment, at 450°C for 2 hours. Chl-a and phaeo were extracted for 24 hours with 90% acetone from the upper wet sediment layer and determined by spectrophotometry according to the equations of Lorenzen (Reference Lorenzen1967) adapted by Plante-Cuny (Reference Plante-Cuny1974).
Data analysis
Macrobenthic community structure was analysed regarding abundance (N), number of taxa (S), biomass, Margalef species richness (d), Shannon–Wiener diversity (H′) and Pielou's evenness (J′) indices. All variables and indices were calculated for each sampling period, pond and area. Multivariate analyses were performed using the PRIMER v5.0 software package. For the trophic group analysis, the assignment of a taxon to a group was performed by first dividing the number of individuals of that taxon by the number of feeding functional groups in which it could be included (Boaventura et al., Reference Boaventura, Cancela da Fonseca and Teles-Ferreira1999; Cancela da Fonseca et al., Reference Cancela da Fonseca, Duarte and Gaspar2001b). Therefore, trophic groups should be regarded as functional groups instead of taxonomic categories (Boaventura et al., Reference Boaventura, Cancela da Fonseca and Teles-Ferreira1999). The identified taxa were assigned to at least one of the following feeding functional modes: filter-feeding (F), deposit-feeding (D), carnivory (C) and herbivory (H) (adapted from Sprung, Reference Sprung1994; Gaston et al., Reference Gaston, Rakocinski, Brown and Cleveland1998; Mancinelli et al., Reference Mancinelli, Fazi and Rossi1998; Roth & Wilson, Reference Roth and Wilson1998; Gaudêncio & Cabral, Reference Gaudêncio and Cabral2007).
The effectiveness of twelve biotic metrics (percentage of amphipods to total faunal abundance (Edgar et al., Reference Edgar, Macleod, Mawbey and Shields2005); percentage of bivalves to total faunal abundance (Edgar et al., Reference Edgar, Macleod, Mawbey and Shields2005); percentage of gastropods to total faunal abundance (Edgar et al., Reference Edgar, Macleod, Mawbey and Shields2005); percentage of polychaetes to total faunal abundance (Edgar et al., Reference Edgar, Macleod, Mawbey and Shields2005); percentage of bivalves to total molluscs abundance (Edgar et al., Reference Edgar, Macleod, Mawbey and Shields2005); percentage of gastropods to total molluscs abundance (Edgar et al., Reference Edgar, Macleod, Mawbey and Shields2005); polychaete/amphipod ratio (e.g. Gesteira & Dauvin, Reference Gesteira and Dauvin2000); abundance of Capitella spp. (e.g. Webb, Reference Webb1996); Pielou's equitability index J′; Margalef species richness d′; Shannon–Wiener diversity H′; AMBI (e.g. Muxika et al., Reference Muxika, Borja and Bonne2005; Carvalho et al., Reference Carvalho, Barata, Pereira, Gaspar, Cancela da Fonseca and Pousão-Ferreira2006a, Reference Carvalho, Gaspar, Moura, Vale, Antunes, Gil, Cancela da Fonseca and Falcãoc)) in the assessment of organic enrichment resulting from fish production in aquaculture earthen ponds was assessed by analysis of variance (ANOVA) using STATISTICA v6.
RESULTS
Environmental parameters
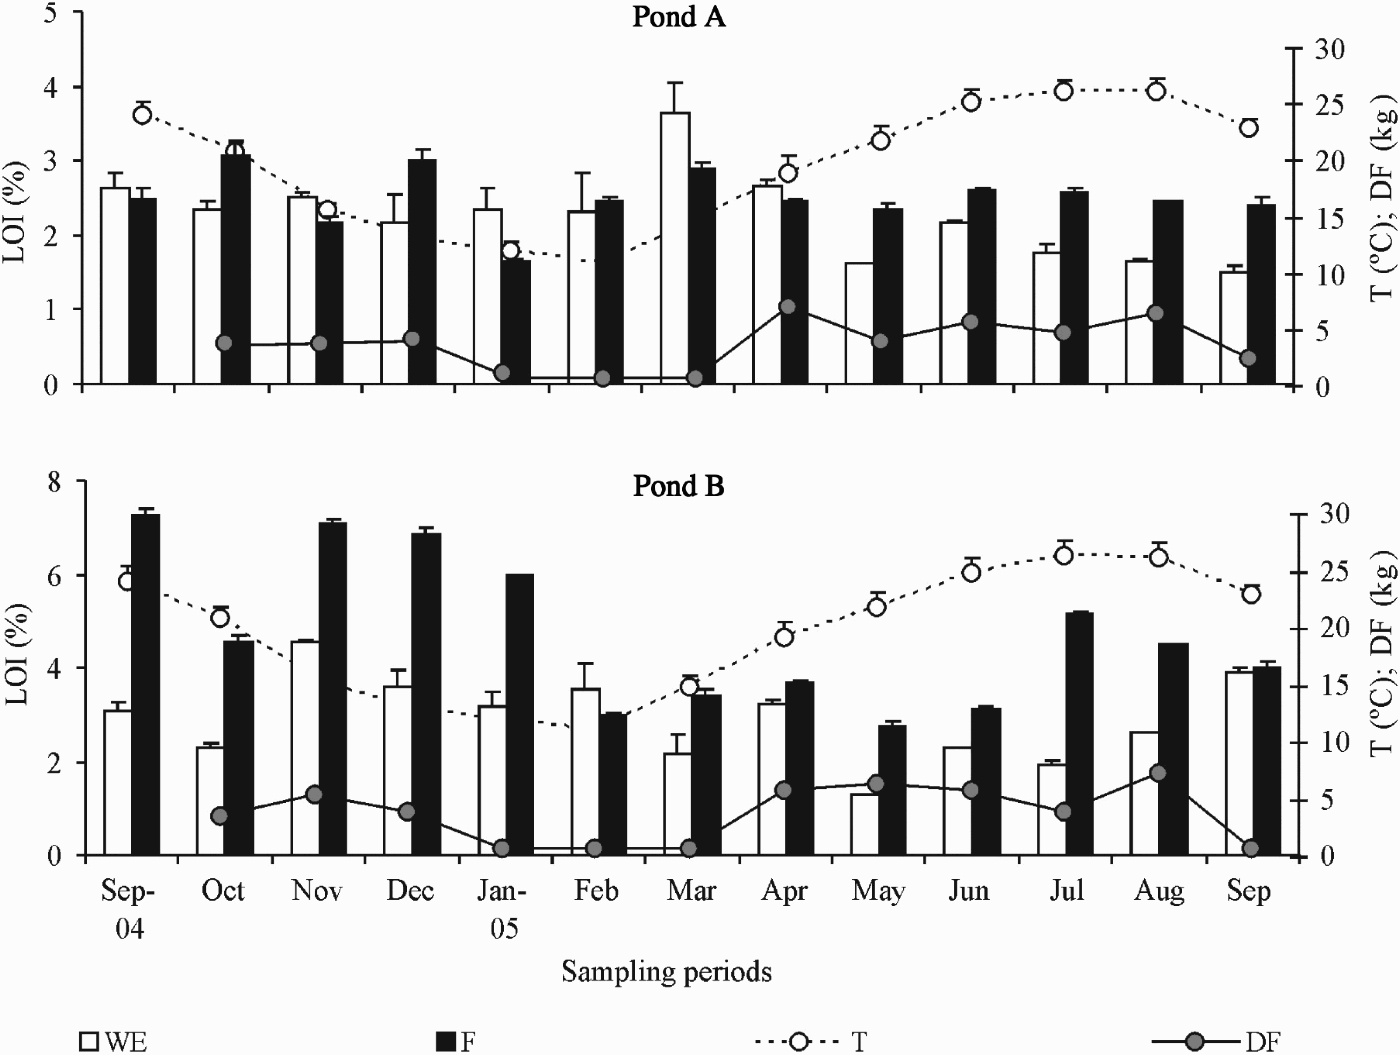
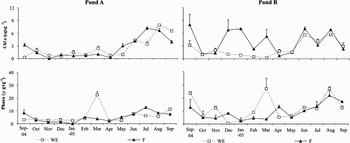
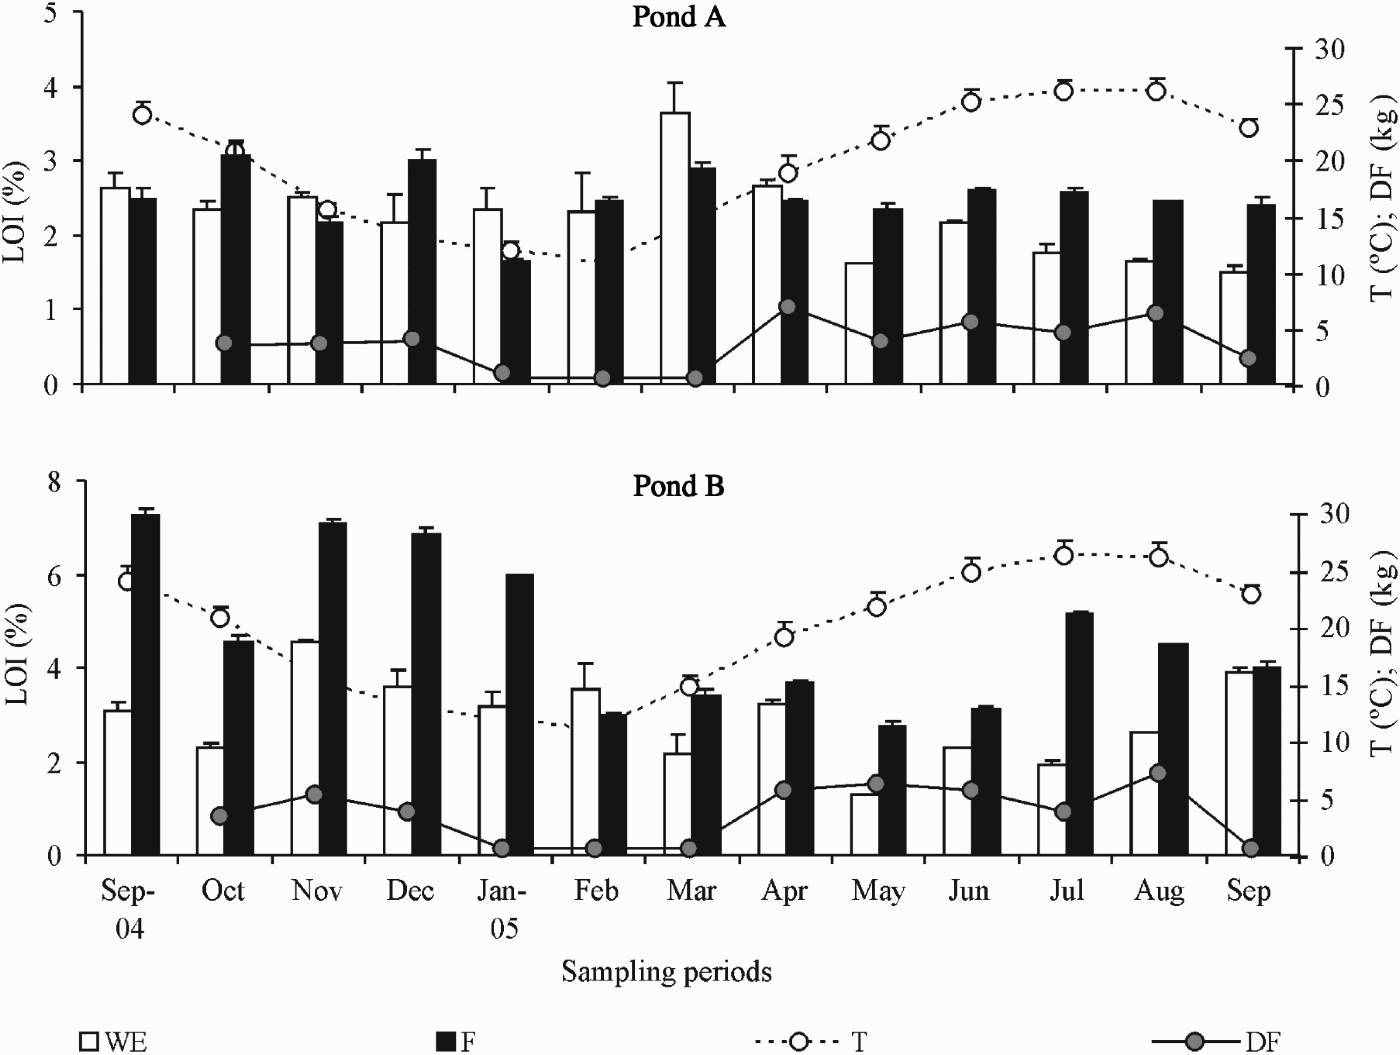
The analysis of the LOI content in the sediment showed that in pond B values were usually higher than in pond A (Figure 2). In both ponds, values were generally higher in F than in WE area but in pond A the opposite trend was evident from January to April. With the increasing temperature and the consequent increase in the food quantity added to the ponds, values become once more higher in the feeding area until the end of the sampling period (Figure 2). In pond B, only in February, where the lower water temperature was observed, the WE area presented higher organic matter content than the F area (Figure 2). Surprisingly, the higher values observed in both ponds were registered during the autumn–winter period, when water temperature was lower. In terms of chl-a in the WE area, the concentration generally increased during the sampling period with the higher values being observed from June to September 2005 (Figure 3). In the feeding zone, the pattern was not consistent in both ponds. While in pond A the trend was similar to that described for the WE zone, in pond B values fluctuated with several peaks in December–January, March, June and August (Figure 3). With regards to the phaeo concentration, values tend to increase with the production cycle with a noticeable peak observed in March in the WE areas of both ponds (Figure 3).
Variation of the percentage of organic matter content (LOI; +SD), water temperature (T; +SD), and amount of dry food (DF) in the ponds A and B during the sampling period. WE, water entrance area; F, feeding area.
Variation of the chlorophyll-a (chl-a; +SD) and phaeopigment (Phaeo; +SD) contents in the ponds A and B during the sampling period. WE, water entrance area; F, feeding area.

Macrobenthic communities
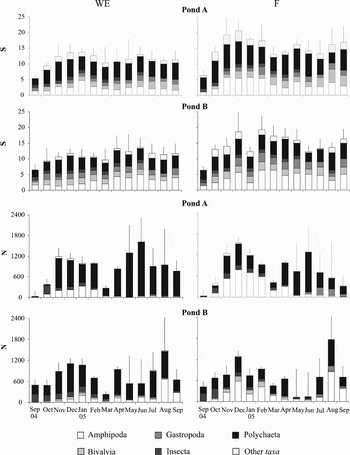
The analysis of univariate biological variables showed that the lowest values of number of taxa, abundance and biomass in both ponds were observed in September 2004 (Figures 4 & 5). Considering the number of taxa and abundance, the general trend that was observed consisted of an initial increase during winter, followed by a decrease in March and increasing again (Figure 4). While the number of taxa tended to stabilize during spring and summer, abundance showed higher oscillations during this period (Figure 4). Regarding faunal composition, the polychaetes were in general the taxonomic group with the highest contribution for the number of taxa (Figure 4). This dominance was higher in the F than in the WE zone. For the other major taxa it was observed that the contribution for the mean number of taxa was usually higher in the WE than in the F zone (Figure 4). Concerning abundance, the same general pattern was also visible for both ponds, but the dominance of polychaetes was higher (Figure 4). In terms of abundance, this dominance was especially due to the polychaete Capitella spp., but also to Hediste diversicolor, Neanthes caudata, Pseudopolydora paucibranchiata and Desdemona ornata. Amphipods (mainly Microdeutopus gryllotalpa, Corophium acherusicum and Ampithoe rubricata) were the second most abundant group. A thorough analysis on the faunal composition of the analysed earthen ponds was presented in a previous paper (Carvalho et al., Reference Carvalho, Barata, Pereira, Gaspar, Cancela da Fonseca and Pousão-Ferreira2006a).
Variation of the mean values of number of taxa (S, taxa × m−2; +SD), abundance (N, ind. × m−2; +SD) and the relative contribution of the main taxonomic groups during the sampling period for ponds A and B. WE, water entrance area; F, feeding area.

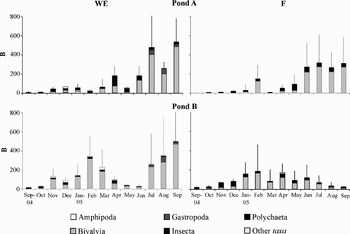
Variation of the mean biomass (B, AFDW × m−2; +SD) and the relative contribution of the main taxonomic groups in ponds A and B for the months analysed. WE, water entrance area; F, feeding area.

In terms of biomass, a general increase in pond A both in the WE and the F zones was observed during the sampling period (Figure 5). In pond B, the highest values were registered during July to September 2005 for the WE zone, with a smaller peak in February and March, but for the F area, biomass increased until February decreasing afterwards until the end of the experimental period (Figure 5). Within the analysed system, Bivalvia was the taxonomic group with the highest contribution for the biomass observed (Figure 5).
In general, and except for abundance, the variables analysed showed higher values in the WE than in the F areas in both ponds. Abundance was generally higher in the WE than in the F zone during winter months and early spring (for pond A). In late spring and summer, the trend was inverted or in some cases with both zones showing similar values (Figure 4).
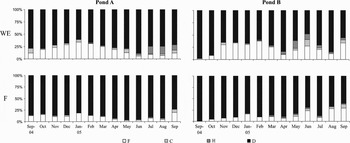
The analysis of the relative abundance of the feeding functional groups for both ponds and areas analysed puts in evidence the dominance of the deposit-feeding mode both in the WE and the F zones, considering the duration of the study (Figure 6). The filter-feeding were the second most abundant feeding mode and usually with higher percentages in the WE than in the F zone. In relation to the herbivory and carnivory, the sum of its relative abundance was higher in the WE than in the F zones and values were never higher than 18.6% in pond A (August) and 24.6% in pond B (June) (Figure 6).
Variation of the relative contribution of the different functional trophic groups in ponds A and B for the months analysed. C, carnivory; H, herbivory; F, filter-feeding; D, deposit-feeding; WE, water entrance area; F, feeding area.

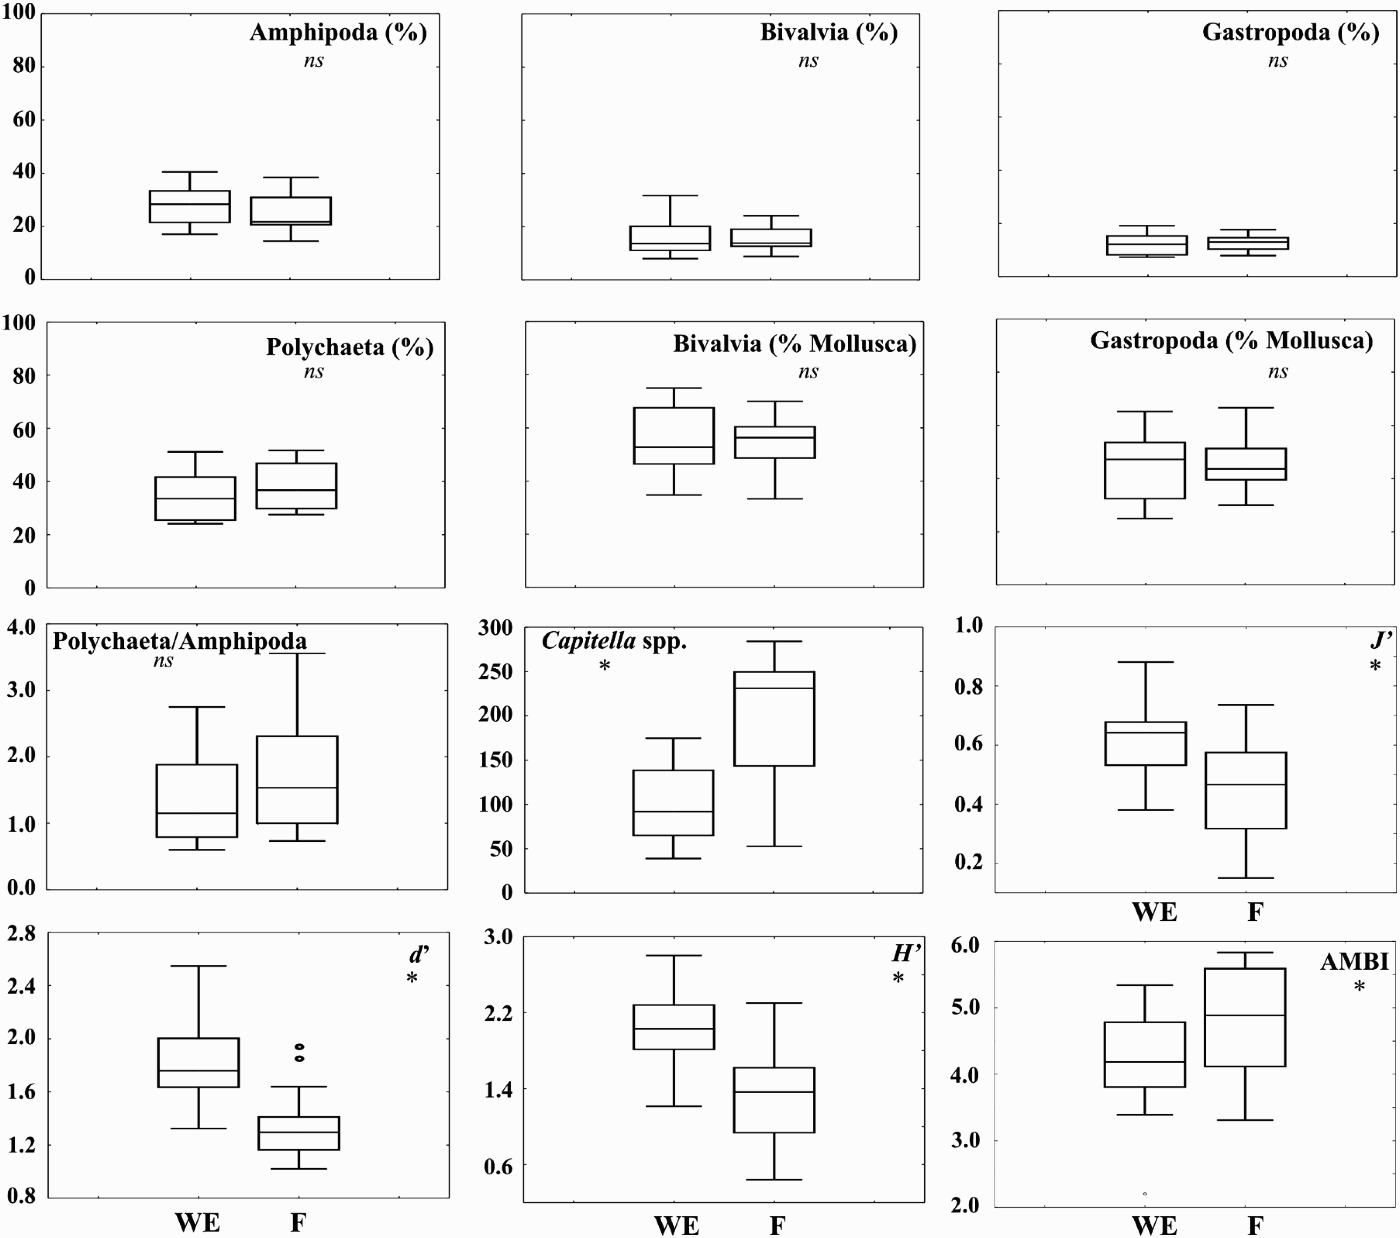
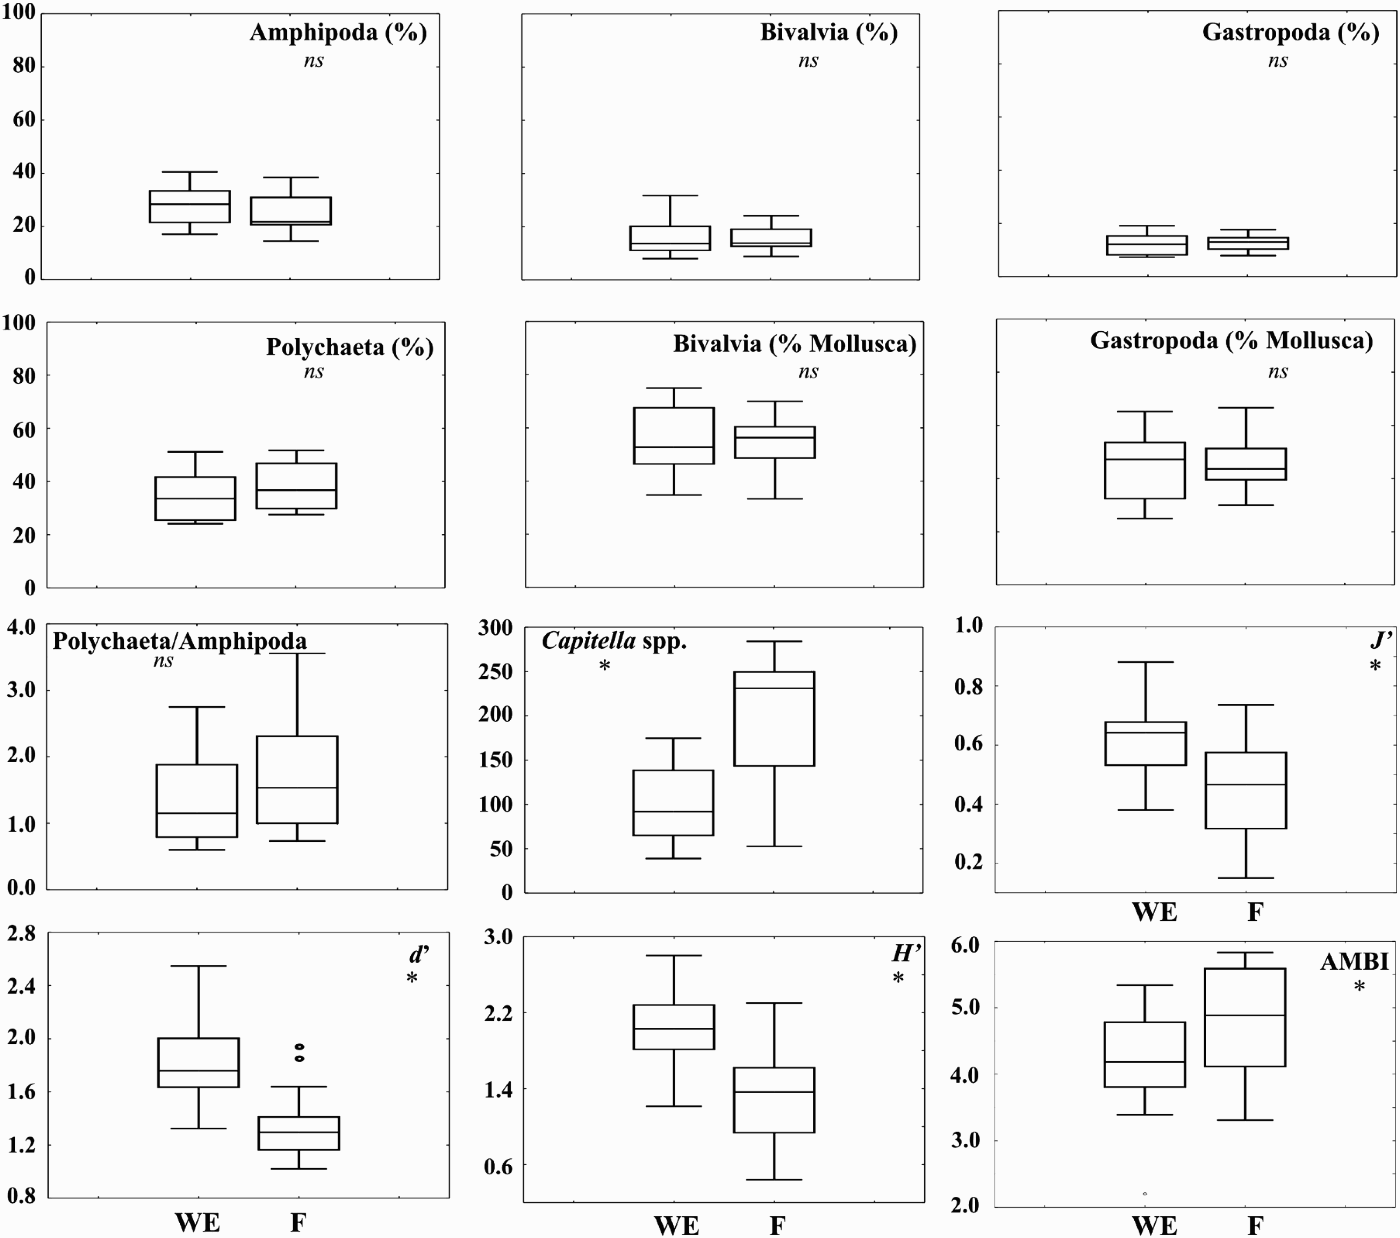
In Figure 7 a set of biological metrics is presented for both zones analysed. The percentage of the main taxonomic groups in both zones did not show any significant difference between the areas (Figure 7). The ratios between Bivalvia and total Mollusca, Gastropoda and total Mollusca, as well as the ratio between Polychaeta and Amphipoda were also unsuitable for the discrimination between the two areas of the ponds (Figure 7). However, the abundance of the opportunistic polychaete Capitella spp. and the marine biotic index AMBI were significantly lower in the WE than in the F areas (Figure 7). On the other hand, the Pielou's eveness (J′), Shannon–Wiener diversity (H′) and Margalef species richness (d) were significantly lower in the F zones when compared to the WE zones (Figure 7).
Box plots showing median, box edges at first and third quartiles, and outlying data points for several biotic metrics. WE, water entrance area; F, feeding area; *, significant differences at P < 0.05.
DISCUSSION
The macrofaunal patterns in earthen fish ponds of the Ria Formosa lagoon were already shown to be influenced by the input of fish food during the production cycle and the changes in abiotic parameters caused by seasonality and fish production (Carvalho et al., Reference Carvalho, Cúrdia, Moura, Gaspar, Dinis, Pousão-Ferreira and Cancela da Fonseca2007; Serpa et al., Reference Serpa, Falcão, Pousão-Ferreira, Vicente and Carvalho2007).
The distribution of macrobenthic communities is controlled by a variety of environmental (e.g. habitat characteristics, water quality, sediment quality and food) and biological factors (e.g. competition and predation) (Peeters et al., Reference Peeters, Gylstra and Vos2004 and references therein). Both abiotic and biotic factors play a role in shaping macrobenthic communities (Angermeier & Winston, Reference Angermeier and Winston1998), the former being often regarded as determinant for large scale patterns and the latter for local scales (Menge & Olson, Reference Menge and Olson1990; Levin, Reference Levin1992). The macrobenthic communities of the studied systems seem to reflect both factors. The communities were characterized by a small total number of taxa, high variability in abundance, and dominance of a few taxa, which is typical of some Mediterranean and Atlantic lagoon systems (Gamito, Reference Gamito1989; Arias & Drake, Reference Arias and Drake1994; Bachelet et al., Reference Bachelet, Montaudouin, Auby and Labourg2000; Costa et al., Reference Costa, Cristo and Cancela da Fonseca2003). The isolation of the production areas that do not communicate directly with the source population (water reservoir) cause constraints to the colonization process. Moreover, the high amount of organic matter that is characteristic of these systems is also restrictive to more sensitive species. Polychaetes were generally dominant both in terms of number of taxa and abundance. In terms of abundance, this dominance was especially due to Capitella spp., but also to other polychaete species such as Hediste diversicolor, Neanthes caudata, Pseudopolydora paucibranchiata and Desdemona ornata. Amphipods (mainly Microdeutopus gryllotalpa, Corophium acherusicum and Ampithoe rubricata) were the second most abundant group.
The analysis of the benthic environment in fish earthen ponds indicated that the localized introduction of commercial food during the production cycle has clear consequences both in abiotic and biotic parameters. These changes were supported by the differences observed in water entrance and feeding areas both in community structure, biotic metrics and organic matter and pigments in sediment. Severe impacts of fish production have been already documented namely under fish cages (e.g. Johannessen et al., Reference Johannessen, Botnen and Tvedten1994; Karakassis et al., Reference Karakassis, Hatziyanni, Tsapakis and Plaiti1999). Organic enrichment has been shown to have a significant effect on diversity and macrobenthic composition (Perus & Bonsdorff, Reference Perus and Bonsdorff2004; Carvalho et al., Reference Carvalho, Barata, Pereira, Gaspar, Cancela da Fonseca and Pousão-Ferreira2006a, Reference Carvalho, Cúrdia, Moura, Gaspar, Dinis, Pousão-Ferreira and Cancela da Fonseca2007). Usually, at the beginning, macrobenthic populations seem to be favoured, reflecting a combination of the nutritional value of moderate amounts of organic matter present in the sediment (Magni, Reference Magni2003). This was the basis of the intermediate productivity hypothesis (IPH) (Grime, Reference Grime1973a, Reference Grimeb) that predicted maximum species diversity at intermediate level of productivity, due to the reduction of the competition for food, promoting the existence of potentially competing species (Widdicombe & Austen, Reference Widdicombe and Austen2001). A similar model was proposed by Connell (Reference Connell1978) named the intermediate disturbance hypothesis (IDH). However, an excessive disturbance effect (in the present case organic load) exposes the benthic animals to physiological stress (Diaz & Rosenberg, Reference Diaz and Rosenberg1995; Gray et al., Reference Gray, Wu and Or2002), and may lead to a decline in the biological variables (number of taxa, abundance and biomass) (Magni, Reference Magni2003). The oscillations of the number of taxa during the study period indicated a similar pattern for water entrance and feeding areas although with lower values in the latter. Therefore, after one year of production, the benthic environment of the fish ponds did not present signs of high disturbance. This seems to indicate that the amount of food added was appropriate to the amount of produced fish.
In terms of the functional analysis of the benthic communities by trophic guilds, the present systems were dominated by the deposit-feeding functional group, mainly annelids, which is characteristic of fine soft-bottom areas of European and North American estuaries (Boesch, Reference Boesch1973; Gaston et al., Reference Gaston, Lee and Nasci1988; Boaventura et al., Reference Boaventura, Cancela da Fonseca and Teles-Ferreira1999; Bachelet et al., Reference Bachelet, Montaudouin, Auby and Labourg2000; Cardoso et al., Reference Cardoso, Pardal, Lillebø, Ferreira, Raffaelli and Marques2004; Carvalho et al., Reference Carvalho, Moura, Gaspar, Pereira, Cancela da Fonseca, Falcão, Drago, Leitão and Regala2005; Gaudêncio & Cabral, Reference Gaudêncio and Cabral2007). Many deposit feeders have an opportunistic behaviour presenting higher growth and reproduction rates as well as survival in favourable environmental conditions, such as an increase of food (Pearson & Rosenberg, Reference Pearson and Rosenberg1978; Rossi, Reference Rossi2003). Although there was clear dominance of the deposit-feeding mode in the fish ponds, within water entrance areas there was an increase of suspension-feeding, carnivory and herbivory, when compared to the feeding areas. The decline of suspension-feeding and the increase of deposit-feeding functional groups resulting from the increase of the organic input to the sediment were already described by Pearson & Rosenberg (Reference Pearson and Rosenberg1978) for macrobenthic communities, regardless of the type of organic material responsible for the enrichment (Widdicombe & Austen, Reference Widdicombe and Austen2001). The higher relevance of the trophic functional groups other than deposit-feeding at the WE agrees with the shift from grazing to detritus pathways from the less to the more eutrophic areas inside brackish estuarine/lagoon systems. As pointed out by Cancela da Fonseca et al. (Reference Cancela da Fonseca, Duarte and Gaspar2001b) the existence of gradients of trophic functions in these systems may represent the best way the communities can adapt to exploit the existing resources as a response to physical gradients. The presence of less trophically mixed communities was also indicated by Gaston & Nasci (Reference Gaston and Nasci1988) as being probably related to higher disturbance levels, which is in agreement with the observations in the present study. However, according to Dauer (Reference Dauer1984), caution is necessary, namely when using polychaete feeding guilds as biological variables, since in estuarine-like systems, physical and chemical factors along with large biological disturbance may override and obscure the importance of trophic factors. Moreover, the assignment of feeding types to each species is sometimes ambiguous and not consensual (Chardy & Clavier, Reference Chardy and Clavier1988), making it difficult to use this methodology.
Severe impacts on benthic environment due to organic input in fish production areas are of major concern to farm managers because of its relationship with fish health. Edgar et al. (Reference Edgar, Macleod, Mawbey and Shields2005) tested the effectiveness of a variety of biological metrics in assessing fish farm impacts at different distances from production cages. These authors indicated the ratio of bivalves to total molluscs as the biological metric that best fitted the results obtained. Significantly lower values of this ratio were observed from reference to compliance sites. The use of molluscs as bioindicators of organic enrichment had been already indicated by Brooks & Mahnken (Reference Brooks and Mahnken2003). However, in the present study the bivalve to total molluscs ratio did not allow the discrimination between feeding and water entrance areas. A likely reason for the disagreement of the results of both works is the existence of bivalves that are tolerant to organic enrichment. This is the case of Abra ovata, a quite abundant species in the fish ponds, which showed a preference for the feeding zone. In the present study, the most sensitive indicators between feeding and water entrance areas were the abundance of the opportunistic polychaete Capitella spp., diversity (both as Margalef species richness and Shannon–Wiener), Pielou's eveness, and AMBI indices. Although the ratio of bivalves to total molluscs had been indicated by Edgar et al. (Reference Edgar, Macleod, Mawbey and Shields2005) for the south-eastern Tasmania region as a suitable biological metric to be used in monitoring studies, the same authors also stated that the most sensitive univariate indicator of the broad-scale effects of fish farming seems to be the difference between the total density of a set of species positively correlated with farm impacts and the total density of a set of negatively correlated species. Different results may be observed according to the typical fauna of production areas and the analysis of a wide variety of biological indices should be undertaken in order to discriminate the best metrics to be used in monitoring studies for a certain area. Despite the clear dominance of the polychaete Capitella spp. in the feeding area, the co-existence of other species indicates that in the present production conditions, the system is not in a high healthy risk.
A common approach to assess risks to ecosystem health is the identification of stressors and their potential effects through the use of indicators (Fisher et al., Reference Fisher, Jackson, Suter and Bertram2001). A good indicator should be amenable to measurement and preferably easy to measure (Hyland et al., Reference Hyland, Balthis, Karakassis, Magni, Petrov, Shine, Vestergaard and Warwick2005) but also should be meaningful to decision-making with respect to the risk of concern (Fisher et al., Reference Fisher, Jackson, Suter and Bertram2001). From the biotic indicators that show a differential response to organic input in fish earthen ponds, the abundance of Capitella spp. as well as the diversity (Shannon–Wiener and Margalef species richness), evenness (Pielou) and AMBI indices seem to be good indicators to be used in monitoring studies in similar systems. Managers should have particular attention if this polychaete species is the only species observed within the feeding areas. Nevertheless, manipulative experiments are needed in order to test the dominance levels of Capitella spp. and the values of those indices that are of concern. Overall, macrobenthic communities, as shown for other production systems or anthropogenic disturbances (e.g. Pohle et al., Reference Pohle, Frost and Findlay2001; Dernie et al., Reference Dernie, Kaiser, Richardson and Warwick2003; Sánchez-Moyano et al., Reference Sánchez-Moyano, Estacio, García-Adiego and García-Gómez2004; Cardoso et al., Reference Cardoso, Bankovic, Raffaelli and Pardal2007) can also have a relevant role in monitoring programmes to assess the environmental quality of aquaculture fish ponds.
ACKNOWLEDGEMENTS
The authors are grateful to the technicians from the fish farm for feeding and controlling fish production and support during sampling surveys, especially Marco Cerqueira. We are also indebted to João Cúrdia and Ana Moura for their help in the identification of some species. The present investigation was financially supported by the MARE project ‘Novas Tecnologias de Produção Aquícola’ QCA III, REDAQUA, Interreg III (FEDER), and by a PhD grant from Fundação para a Ciência e a Tecnologia (SFRH/BD/8521/2002).