INTRODUCTION
Throughout its lifetime, a host will be exposed to a plethora of parasites and pathogens and indeed at any one time an individual may host a number of parasitic infections (Petney and Andrews Reference Petney and Andrews1998; Cox Reference Cox2001; Pedersen and Fenton Reference Pedersen and Fenton2007). At the molecular level, the ability of B-cells and hence antibodies to discriminate amongst parasite antigens is achieved by a hugely diverse repertoire of receptors binding epitopes (antigenic determinants on parasites) for which they have specificity (Pancer and Cooper Reference Pancer and Cooper2006; Chaplin Reference Chaplin2010). On binding cognate antigen, the B-cell proliferates and the specificity of its receptor for that antigen is enhanced by somatic hypermutation and clonal selection; that is, mutation of the antigen-binding site of the B-cell receptor and re-binding of antigen selects for the lineage bearing the receptor with the greatest affinity or bond strength (Tarlinton and Smith Reference Tarlinton and Smith2000; Toellner et al. Reference Toellner, Jenkinson, Taylor, Khan, Sze, Sansom, Vinuesa and Maclennan2002). Changes in avidity (the sum of all affinities between antibody and antigen; Chan and Brink Reference Chan and Brink2012) also occur during these processes and can involve both conformational changes in the epitope-binding site and the strength of non-covalent bonds (e.g. hydrogen bonds, electrostatic bonds, Van der Waal's and hydrophobic forces) between the binding site and the antigen. These processes culminate in the secretion of highly antigen-specific and avid antibody molecules (soluble B-cell receptors) that can target parasites or pathogens bearing those antigens for destruction or elimination (Mota et al. Reference Mota, Brown, Do Rosario, Holder and Jarra2001; Gurish et al. Reference Gurish, Bryce, Tao, Kisselgof, Thornton, Miller, Friend and Oettgen2004; Hill et al. Reference Hill, Eriksson, Li Wai Suen, Chiu, Ryg-Cornejo, Robinson, Siba, Mueller, Hansen and Schofield2013; Douglas et al. Reference Douglas, Williams, Knuepfer, Illingworth, Furze, Crosnier, Choudhary, Bustamante, Zakutansky, Awuah, Alanine, Theron, Worth, Shimkets, Rayner, Holder, Wright and Draper2014). The potentially acute specificity of the antibody response has been exploited to produce vaccines against a wide variety of pathogens. However, there are many reports of antibody recognizing epitopes of two different parasite species (e.g. Xu and Powell Reference Xu and Powell1991; Naus et al. Reference Naus, Jones, Satti, Joseph, Riley, Kimani, Mwatha, Kariuki, Ouma, Kabatereine, Vennervald and Dunne2003; Casadevall and Pirofski Reference Casadevall and Pirofski2007; Nguyen et al. Reference Nguyen, Zemlin, Ivanov, Andrasi, Zemlin, Vu, Schelonka, Schroeder and Mestecky2007; Acevedo and Caraballo Reference Acevedo and Caraballo2011; Diaz-Saez et al. Reference Diaz-Saez, Merino-Espinosa, Morales-Yuste, Corpas-Lopez, Pratlong, Morillas-Marquez and Martin-Sanchez2014).
We previously demonstrated in BALB/c mice that antibody cross-reactivity is also observed between antigens of the malaria parasite, Plasmodium chabaudi chabaudi (Pcc) and the tissue migrating gastrointestinal nematode, Nippostrongylus brasiliensis (Nb) (Fairlie-Clarke et al. Reference Fairlie-Clarke, Lamb, Langhorne, Graham and Allen2010). This cross-reactivity persisted even at high titrations of mouse sera and targeted the protein rather than carbohydrate moiety of the antigens (Fairlie-Clarke et al. Reference Fairlie-Clarke, Lamb, Langhorne, Graham and Allen2010).
Given that antigen is required for the processes of somatic hypermutation and affinity maturation (Tonegawa Reference Tonegawa1983; Wang et al. Reference Wang, Sen, Zhang, Ahmad, Zhu, Wilson, Smider, Magliery and Schultz2013), we now hypothesize that increased exposure to antigen could increase ligand–receptor encounter rates and ultimately decrease the avidity and cross-reactivity of antibodies binding both Pcc and Nb antigens. Indeed, the persistence of antigen in the host has been shown to afford more opportunity for somatic hypermutation and thus selection of B-cells with greater specificity and higher affinity (Wang et al. Reference Wang, Huang, Wang, Molina, Chaplin and Fu2000). Furthermore, after somatic hypermutation, cross-reactive antibodies tend to exhibit weak avidity (Yin et al. Reference Yin, Beuscher, Andryski, Stevens and Schultz2003). Alternatively, two taxonomically divergent parasites may actually share epitopes (Pierrot et al. Reference Pierrot, Wilson, Lallet, Lafitte, Jones, Daher, Capron, Dunne and Khalife2006), in which case increased antigenic exposure would not increase the immune system's ability to differentiate between them. The occurrence of shared epitopes may ultimately reveal commonalities among parasite life histories (e.g. anatomical tropism, nutritional requirements, etc.) and could inform broad-spectrum vaccine development.
Here, we therefore manipulated the initial (inoculating) dose of Pcc parasites administered to mice, to investigate effects of increased quantity and duration of antigen exposure on the cross-reactivity and avidity of the antibody response to Nb. We tested the hypotheses that increasing exposure to Pcc antigen would (i) decrease binding of antibodies to Nb antigen and (ii) increase antibody avidity to Pcc antigen while decreasing avidity to Nb and other helminth antigens, unless (iii) Pcc and Nb actually share antigenic epitopes.
MATERIALS AND METHODS
Hosts, parasites and experimental infection
Specific pathogen free, 8–10-week-old female BALB/c mice (Harlan, UK) were maintained in individually ventilated cages on diet 41b ad lib in a 12 h:12 h light–dark cycle. All experiments were carried out in accordance with the animals (Scientific Procedures) Act 1986, and were approved by the UK Home Office inspectorate and institutional review committee.
Pcc clone AS was originally isolated from thicket rats (Thamnomys rutilans) and was cloned by serial dilution and passage (Beale et al. Reference Beale, Carter, Walliker, Killick-Kendrick and Peters1978). Parasites were recovered from frozen blood stabilates by passage through donor mice. Experimental parasite inoculations were prepared from donor mice by diluting blood in calf serum solution [50% heat-inactivated fetal calf serum (FCS), 50% Ringer's solution (27 mm KCl, 27 mm CaCl2, 0·15 m NaCl, 20 units heparin per mouse)]. Mice received 0·1 mL of inoculum intraperitoneally (i.p.) corresponding to a range of infective doses [1 × 10³, 1 × 10⁴, 1 × 10⁵ or 1 × 10⁶ parasitized red blood cells (pRBC)]. Co-infected mice (Nb–Pcc) simultaneously received a subcutaneous inoculation of 200 third-stage Nb larvae (L3). Nb singly infected mice similarly received 200 L3. Both Nb-only and uninfected control mice received an inoculum of naïve RBC (nRBC) as a control for RBC proteins.
RBC density, body mass and malaria parasites were monitored daily, as described previously (Graham et al. Reference Graham, Lamb, Read and Allen2005). Briefly, RBC densities were measured by flow cytometry (Beckman Coulter), body mass was recorded to the nearest 0·1 g and the proportion of RBCs parasitized was counted in Giemsa-stained thin blood films (at 1000 × magnification).
Mice were sacrificed on day 11 pi under terminal anaesthesia. Whole blood was collected from the brachial artery into heparin-coated tubes and the plasma fraction was separated by centrifugation at 17 000 g .
Antigens
Two malaria antigens were used in this study: a recombinant protein and a crude antigen preparation of pRBCs. The recombinant merozoite surface protein-119 (MSP-119) was originally sequenced, cloned and expressed from Pcc AS clone, as described previously (Hensmann et al. Reference Hensmann, Li, Moss, Lindo, Greer, Watts, Ogun, Holder and Langhorne2004). In brief, the MSP-119 nucleotide sequence was inserted into Pichia pastoris vector pIC9 K and protein expression carried out in P. pastoris strain SMD1169. The antigen was hexahistidine-tagged and purified on a nickel sepharose column using the AKTA prime plus system. This antigen was used in enzyme-linked immunosorbent assay (ELISA) at a concentration of 1 µg mL−1 (see ‘Antibody Detection’ section). We acknowledge that P. pastoris may artificially glycosylate the antigen, but our previous work (Fairlie-Clarke et al. Reference Fairlie-Clarke, Lamb, Langhorne, Graham and Allen2010) suggests that this does not greatly affect the antibody response to this antigen.
The crude malaria antigen – lysed Pcc–pRBC extract (Pc lysate) – was prepared from whole blood of mice with a parasitaemia in excess of 20%. Mice were bled by cardiac puncture with a heparinized syringe and the blood was diluted in Roswell Park Memorial Institute (RPMI) medium (Sigma–Aldrich). The diluted blood was applied to a 67% Percoll gradient and centrifuged at 6450 g for 10 min. The interface containing pRBC was harvested and any host antibodies were cleaved from the cells by incubation with 100 µg mL−1 trypsin for 10 min at 37 °C. After washing in RPMI, cells were lysed with 0·05% saponin. Cells were centrifuged at 6450 g for 10 min and then washed repeatedly in PBS. The pellet was resuspended in 1 mL sterile PBS and the parasites lysed by 5 cycles of freeze (−80 °C) thaw. This antigen was used at a concentration of 2 µg mL−1 in ELISA (see ‘Antibody Detection’ section). A nRBC extract was also prepared as a control for RBC proteins; naïve and infected mice did not differ in their responses to uninfected RBC antigen (data not shown). Thus, responses of infected mice to any contaminating RBC proteins in the Pc lysate preparation are negligible.
N. brasiliensis, Litomosoides sigomodontis and Heligmosoides polygyrus extracts (NbA, LsA and HpA, respectively) were prepared by separate homogenization of adult nematodes of each species in PBS. The somatic extracts were centrifuged at 1000 g for 20 min and the pellet discarded. The extract was stored at −20 °C until use in ELISA at a concentration of 5 µg mL−1 (see ‘Antibody Detection’ section).
Antibody detection
Antigen-specific antibodies of the IgG2a isotype were measured by ELISA; 96-well maxisorp immunoplates (Nunc) were coated at 4 °C overnight with either recombinant or crude antigen in 0·06 m carbonate buffer (0·04 m NaHCO3, 0·02 m NaCO3, pH9·6). Non-specific binding was blocked with 5% FCS in carbonate buffer for 2 h at 37 °C. Wells were washed three times in Tris-buffered saline with 0·1% Tween 20 (TBST) after each subsequent step. Serum samples were added in serial dilutions (1/50-1/819200) using TBST as a diluent and incubated for 2 h at 37 °C. Isotype-specific detection antibody horse radish peroxidase conjugated goat anti-mouse IgG2a (Southern Biotech 1080-05) was added at 1/4000. Plates were incubated for 1 h at 37 °C. An additional wash in distilled water was carried out before developing with 2,2'-azino-bis(3-ethylbenzothiazoline-6-sulphonic acid) (ABTS) peroxide substrate (Insight Biotechnology), at room temperature (RT) for 20 min. Optical density (O.D.) was read at 405 nm using a spectrophotometer. Antibody titres were calculated as the reciprocal of the greatest dilution at which O.D. was greater than the mean plus 3 standard deviation of the O.D. values observed for control mouse sera at 1/200 dilution. To determine the proportion of antigen-specific antibodies that bound with high avidity duplicate ELISAs were run in parallel incorporating an additional wash step with 6 m urea following incubation of the serum samples; 6 m urea is a hydrogen-bond dissociating agent and treatment with this removed weakly bound antibodies (Bjorkman et al. Reference Bjorkman, Naslund, Stenlund, Maley, Buxton and Uggla1999; Yasodhara et al. Reference Yasodhara, Ramalakshmi and Sarma2001). An ‘avidity index’ was then calculated by dividing the high avidity titre by the ‘total’ avidity titre.
Western blot
Parasite antigens [Nb excretory/secretory antigen (NES), Pc lysate, MSP-119, NbA, HpA and LsA], lipopolysaccharide (LPS) (bacterial antigen; Sigma–Aldrich) and zymosan (yeast cell wall derivative; Sigma–Aldrich) prepared in NuPage lithium dodecyl sulphate sample buffer (Invitrogen) supplemented with 20% reducing buffer (Invitrogen) were heat denatured and separated by sodium dodecyl sulphate polyacrylamide gel electrophoresis using 4–12% Bis–Tris gels (NuPage, Invitrogen). Samples were then transferred to nitrocellulose membrane (Amersham Hybond-ECL) at 35 V for 75 min. After blocking with 5% non-fat skimmed milk in TBST for 1 h at RT membranes were incubated overnight at 4 °C with anti-sera from Pcc-infected mice or uninfected controls (1/100 dilution in 5% non-fat skimmed milk: TBST). The membranes were washed 5 times in TBST and then incubated for 1 h at RT with rabbit anti-mouse IgG (DAKO P0260) at 1/1000 dilution. After further washes in TBST and a final wash in TBS, membranes were incubated with ChemiGlow West (Alpha Innotech) for 5 min at RT. The resulting chemiluminescence was visualized with a FluorChem™SP imager system and software (Alpha Innotech).
Antibody depletion assay
Parasite antigen MSP-119 was adsorbed to 0·35 µm polybead microspheres (Polysciences Inc.) as per manufacturer's instructions. The antigen-coated polybead microspheres were then mixed with plasma from Pcc-infected mice diluted 1/50 in TBST-3% soymilk and incubated for 2 h at 37 °C. Plasma was recovered by centrifugation at 13 300 g for 10 min at 4 °C, this process was repeated a total of 4 times with fresh coated beads and the antibody-depleted serum was then recovered and tested by ELISA as detailed above, with the exception that 2% soy–TBST was used to block non-specific binding. Control depletions were carried out in the same way using soymilk-adsorbed polybead microspheres.
Immunocytochemistry
IgG and IgM-positive B-cells and plasma cells were identified in germinal centres of spleen cryosections by staining with fluorescently labelled antibodies. After fixing in acetone, sections were blocked in 1% BSA: sterile PBS for 15 min at RT. A mixture of the primary antibodies IgM goat anti-mouse IgM conjugated to Texas Red (1 mg mL−1 Southern Biotech 1021-07) and IgG- goat anti-mouse IgG conjugated to Biotin-SP (1·4 mg mL−1 Jackson 141 ImmunoResearch laboratories 115-066-008) combined with fluorescently labelled peanut agglutinin (PNA)(fluorescein PNA 5 mg mL−1 Vector laboratories FL-107) was prepared, and 50 µl of this was added to each section and incubated for 2 h at RT. Each component was used at 1/100 dilution in 1% BSA:PBS. Sections were washed 3 times in PBS before incubation with streptavidin Alexafluor 350 (1 mg mL−1 Invitrogen S11249), at 1/100 dilution in 1% BSA:PBS for 1 h at RT. Sections were again washed in PBS before being mounted with a coverslip and stored at 4 °C in the dark. Immuno-staining of the tissue sections was visualized by fluorescence microscopy 10 × magnification. PNA-labelled green by fluorescein isothiocyanate-stained germinal centres, B-cells and IgM-positive plasma cells were stained in red by Texas Red and IgG-positive B-cells and plasma cells were labelled blue by Alex Fluor 350. Individual photographs were taken for each stain and then merged to give a 3-colour image using Improvision Openlab 5·5·1 software. ImageJ software version 10.2 (developed by National Institutes of Health for the public domain) was used to quantify the size of the germinal centre and the proportion of IgG-positive cells in a representative area of the tissue section. The germinal centre, identified by PNA staining, was outlined and the software calibrated, so that the area of the germinal centre was recorded in millimetre2. The proportion of IgG-positive cells in a representative microscope field was then calculated.
Statistical analysis
All analyses were carried out in the statistical package JMP 10.0 (SAS) using generalized linear models. The analyses presented here are from the combined data of two experiments (n = 16 per infection group). Seven mice were excluded due to failed/delayed Pcc infection (peak parasite density < 0·05 pRBC 10^9 mL−1). Antibody titre and the ‘avidity index’ data were log10 transformed to satisfy the model assumptions of homogeneity-of-variance and normal distribution. Main effects were nematode presence or absence (Nb), and malaria inoculation dose 1 × 10³–1 × 10⁶ (Pcc dose) fitted as categorical variables. Their ability to predict antibody response was formally evaluated via analysis of variance (ANOVA). To address the question of whether Pcc dose was significant, Nb-only mice were excluded; the final analysis of antibody titre was therefore carried out on 121 mice. The effects of dose and infection status were consistent between experiments. Including ‘experiment’ as a factor in all the analyses controlled for any differences in the magnitude of effects between the two experiments. Maximal models were first fit to the data and the minimal models were obtained by sequentially removing non-significant terms (P > 0·05), beginning with interactions. Significant interactions with ‘experiment’ were removed if they were purely quantitative and if their removal did not alter the significance of the main effects remaining in the model. Finally, significant pairwise differences (P < 0·05) between groups were determined using the Tukey's All Pairs adjusted P-values for the most complex term in the minimal model.
Analysis of the titres generated in the antibody depletion assay was also performed by ANOVA as described above. Main effects were depleting antigen (MSP-119, soy or none) fitted as categorical variables and mouse was fitted as a random effect. Significant pairwise differences (P < 0·05) in the antibody response following depletion with the different antigens were determined using the Tukey's All Pairs adjusted P-values for the most complex term in the minimal model.
RESULTS
Varying the inoculating dose of Pcc affected antigen exposure of hosts
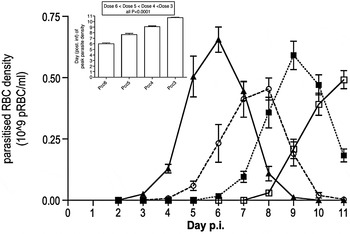
To investigate the effect of increasing Pcc antigen exposure on antibody responses, on day 0 we inoculated female BALB/c mice with a range of infective Pcc doses (1 × 10³, 1 × 10⁴, 1 × 10⁵ or 1 × 10⁶ pRBC; hereafter, Pcc3, Pcc4, Pcc5 and Pcc6). Previous experiments in C57BL/6 mice infected with increasing doses of P. chabaudi genotypes CW and BC revealed that each order of magnitude increase in dose brings the peak of asexual parasitaemia forward by approximately 1 day (Timms et al. Reference Timms, Colegrave, Chan and Read2001). This result was replicated here using BALB/c mice and the P. chabaudi genotype AS: each order of magnitude increase in dose accelerated peak parasitaemia by 1–2 days (ANOVA Experiment F1, 116 = 15·80, P = 0·0001; Pcc dose F3, 116 = 262·76, P < 0·0001) (Fig. 1, inset). For mice co-infected with Nb and different doses of Pcc the dynamics of Pcc parasitaemia were not significantly different (data not shown). Although we did not observe differences in peak parasitaemia between singly and co-infected mice as we had previously (Hoeve et al. Reference Hoeve, Mylonas, Fairlie-Clarke, Mahajan, Allen and Graham2009), co-infected mice showed a reduction in cumulative parasite density that bordered on significance (ANOVA Nb × Pcc dose F3, 112 = 2·63, P = 0·0536).
Kinetics of malaria infection. Pcc was administered at 4 different inoculating doses. Pcc inocula doses of 1 × 10³, 1 × 10⁴, 1 × 10⁵ and 1 × 10⁶ Pcc-infected RBC are denoted as Pcc3, Pcc4, Pcc5 and Pcc6, respectively. Dynamics of Pcc parasite density throughout infection are shown; Pcc6 black triangles and solid line, Pcc5 open circles and dashed line, Pcc4 black squares and dotted line and Pcc3 open squares and solid line. The area beneath each of these curves represents cumulative parasite density. Day pi of peak parasite density for each group are shown as white bars in inset graph. The figure shows mean and standard error. Significant pairwise differences according to Tukey's post-hoc test and the corresponding P-values are summarized in the text box.

Most importantly for the hypotheses tested here, termination of the experiment at day 11 pi resulted in different cumulative antigen exposure (or cumulative parasite density) amongst groups, which allowed us to capitalize on the dose-dependent infection kinetics. For example, by day 11 pi, mice inoculated with the highest dose of Pcc (Pcc6) experienced the highest cumulative parasite density and Pcc3 the lowest (Fig. 1; cumulative parasite density indicated as area under each curve; ANOVA experiment F1, 116 = 12·87, P = 0·0008; Pcc dose F3, 116 = 5·98, P = 0·0009; Pcc3 < Pcc6, Tukey's adjusted P-value = 0·05). Additionally the number of days when parasites were detectable (i.e. the period of antigen availability) was affected by inoculating Pcc dose (Fig. 1 inset; ANOVA Pcc dose F3, 57 = 42·8, P < 0·0001; Pcc3 < Pcc6, Tukey's adjusted P-value P < 0·0001). As reported below, although we performed ELISA to quantify antibody titres in all groups, we focused on the highest- and lowest-dose groups (i.e. Pcc6 and Pcc3) for the other immunological assays (avidity ELISA, antibody depletion and immunofluorescent staining of germinal centres).
Increasing Pcc antigen exposure increased both Pcc-specific and cross-reactive IgG2a antibody responses
Previously we showed that Pcc-infection induces cross-reactive antibodies capable of binding Nb antigen (Fairlie-Clarke et al. Reference Fairlie-Clarke, Lamb, Langhorne, Graham and Allen2010). Here Pcc antigen exposure of hosts was manipulated by manipulating inoculating Pcc dose. Pcc infection predominantly induces a Th1 response characterized by production of IgG2a antibodies in mice (Su and Stevenson Reference Su and Stevenson2002), and IgG2a is required for the ultimate clearance of malaria infection via opsonization of pRBC and neutralization of free merozoites (Mota et al. Reference Mota, Brown, Do Rosario, Holder and Jarra2001; Weidanz et al. Reference Weidanz, Batchelder, Flaherty, Lafleur, Wong and Van der Heyde2005; Bergmann-Leitner et al. Reference Bergmann-Leitner, Duncan and Angov2009). Therefore, we focused our investigation on this isotype.
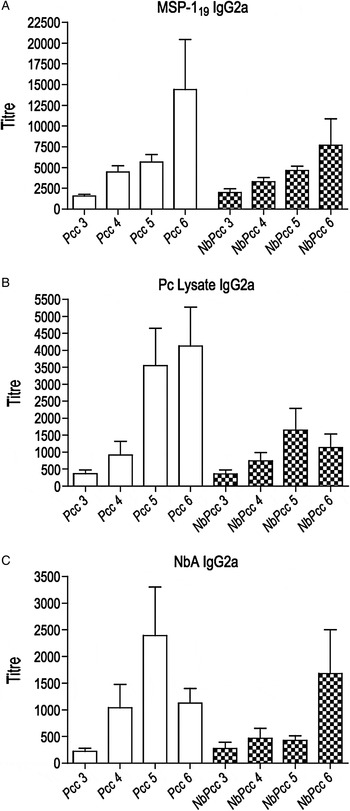
We hypothesized that additional antigen exposure would improve discrimination of Pcc and Nb parasite antigens. As a consequence of prolonged somatic hypermutation and affinity maturation processes, we expected increased specificity for Pcc and decreased cross-reactivity to Nb antigen with increasing Pcc dose. Only the first of these expectations was borne out. In Pcc-infected mice, the IgG2a response indeed increased in a dose-dependent manner to the malaria antigens MSP-119 (ANOVA Experiment F1, 115 = 7·65, P = 0·0066; Pcc dose F3, 115 = 24·46, P < 0·0001; Fig. 2A) and Pc lysate (Experiment F1, 115 = 54·47, P < 0·0001; Pcc dose F3, 115 = 21·84, P < 0·0001; Fig. 2B). Because we observed a marginally non-significant effect of Nb infection (ANOVA Nb F1, 115 = 3·60, P = 0·0602) and no significant interaction between Nb and dose, we conclude that the dose-dependent increase in IgG2a held for Nb–Pcc-infected mice as well (Fig. 2A and B) and extended to the NbA-specific IgG2a response (Fig. 2C). Contrary to our expectations, however, in Pcc-infected mice that had not been exposed to helminth antigens, the Pcc-induced cross-reactive IgG2a response to NbA also increased in a dose-dependent manner (Pcc dose F3, 116 = 12·37, P < 0·0001) (Fig. 2C). The dose-dependent effect was driven largely by differences between the highest and lowest doses and so the following results focus only on sera from Pcc3 and Pcc6 mice to characterize the effect of antigen exposure on cross-reactive responses.
Antigen-specific antibody responses in malaria and co-infected mice. IgG2a antibody titres to malaria antigens MSP-119 (A), Pc lysate (B) and N. brasiliensis antigen (NbA) (C) are shown. All titres are above the mean + 3 standard deviations of control mice at serum dilution of 1/200. This cutoff is represented as 0 on the y-axis. Pcc doses of 1 × 10³, 1 × 10⁴, 1 × 10⁵ and 1 × 10⁶ Pcc-infected RBC are denoted as Pcc3, Pcc4, Pcc5 and Pcc6, respectively, and are shown in white bars. Their co-infected counterparts are additionally denoted with Nb and are shown in chequered bars. Graph shows mean and standard errors of 16 mice per group.

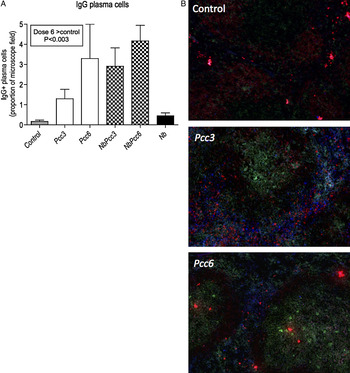
It is possible that the dose-dependent increase in both Pcc-specific and cross-reactive antibody titre was simply due to an overall increase in total antibody production, particularly, if at higher inoculating-doses, the formation of germinal centres in the spleen [i.e. the site of B-cell proliferation and somatic hypermutation (Achtman et al. Reference Achtman, Khan, Maclennan and Langhorne2003)] was established earlier. Such a kinetic difference could effectively increase the duration of antibody production prior to termination of the experiment. Pcc infection is known to cause polyclonal activation of splenic B-cells (Castillo-Mendez et al. Reference Castillo-Mendez, Zago, Sardinha, Freitas Do Rosario, Alvarez and D'imperio Lima2007), which could also increase total antibody production though we would not expect avidity of these antibodies to be increased by antigen exposure. We therefore undertook fluorescent labelling of splenocytes and found that increased production of serum antibodies with increased dose was associated with a greater proportion of IgG-positive plasma cells in the spleen at the highest Pcc dose (see Fig. 3A and B; Pcc dose F2, 40 = 6·43, P < 0·0038). However, we found no difference in total IgG antibodies in serum amongst the groups (data not shown), suggesting that dose-dependent increases in antigen-specific/cross-reactive antibodies were only amongst IgG capable of binding parasite antigens.
Immunocytochemistry of germinal centres in the spleen. The proportion of IgG positive plasma cells (A) for mice infected with different doses of Pcc with or without Nb infection are shown. Control mice are represented by the grey bar, Nb only mice by the black bar, singly infected Pcc mice by white bars and co-infected mice (NbPcc) by chequered bars. Pcc dose is denoted Pcc3 or Pcc6 corresponding to inoculating dose of 1 × 10³ or 1 × 10⁶, respectively. The graph shows mean and standard errors of 8 mice per group. Significant pairwise differences according to Tukey's post-hoc test and the corresponding P-values are summarized in the text box. Representative spleen sections stained for germinal centres, IgG and IgM positive plasma cells (B). Section from control, Pcc3 and Pcc6 groups are shown. Germinal centres are stained green, IgM positive plasma cells red and IgG-positive plasma cells blue.

Increasing Pcc antigen exposure differentially affected the avidity of cross-reactive responses to antigens of various helminth species
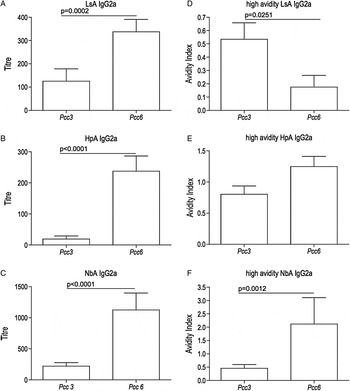
To determine whether the Pcc-induced cross-reactive response to Nb was extended to other nematodes, antibody binding to L. sigmodontis antigen (LsA) and H. polygyrus antigen (HpA) was assessed by ELISA using Pcc3 and Pcc6 sera. IgG2a responses to these nematode antigens also increased with Pcc antigen exposure (Fig. 4A and B; anti-LsA IgG2a Pcc dose F1, 30 = 18·66, P = 0·0002; anti-HpA IgG2a Pcc dose F1, 30 = 76·54, P < 0·0001), although the titre of the cross-reactive response to other helminths was less pronounced than for NbA (Fig. 4C). Our prediction that increased exposure to Pcc antigens would result in decreased cross-reactivity to worm antigens was thus not borne out for any of the nematodes tested.
Malaria-induced cross-reactive antibody responses to nematode antigens. IgG2a cross-reactive responses induced by Pcc infection at low and high inoculating dose (Pcc3 and Pcc6, respectively) to L. sigmodontis, H. polygyrus and N. brasiliensis worm antigens (LsA, HpA and NbA) are shown (A, B and C, respectively). All titres are above the mean + 3 standard deviations of control mice at serum dilution of 1/200. This cutoff is represented as 0 on the y-axis. The fraction of the antibody response that is high avidity is presented as the avidity index (y-axis) in figures D, E and F. Graph shows mean and standard errors of 16 mice per group. P-values indicate the significant pairwise differences according to Tukey's post-hoc test.

Even though the ability of Pcc-induced antibodies to bind helminth antigens was not decreased by increasing Pcc antigen exposure, we hypothesized that the avidity of these antibodies would be altered. Modifying the ELISA protocol to remove weakly bound (low avidity) antibodies enabled the avidity index for each cross-reactive antibody response to be measured (see ‘Materials and Methods’ section). As hypothesized, we observed decreased avidity of Pcc-induced IgG2a responses to LsA with increasing antigen exposure (Fig. 4D; anti-LsA high avidity IgG2a Pcc dose F1, 30 = 5·56, P = 0·0251).
However, the avidity of cross-reactive responses to NbA actually increased with increased Pcc antigen exposure (Fig. 4F; anti-NbA high avidity IgG2a: Pcc dose F3, 117 = 5·06, P = 0·0013). We also observed this trend for IgG2a responses to HpA (Fig. 4E; anti-HpA high avidity IgG2a Pcc dose F1, 24 = 3·35, P = 0·0798). There was no change in the avidity of responses to malaria antigens with Pcc antigen exposure (data not shown). These data suggest that Pcc-induced cross-reactivity to Nb and Hp is qualitatively different (e.g. in molecular cause) than cross-reactivity to other nematode antigens.
Pcc-induced antibodies appear to bind antigens common to both Nb and Pcc
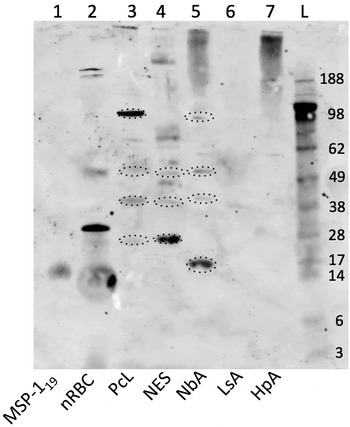
In order to visualize which antigens of the crude preparations (HpA, NbA, LsA and Pc lysate) the Pcc anti-sera bound, we performed Western blots and found evidence that accorded with the binding of Pcc-induced antibodies to nematode antigens observed in ELISA: pooled sera from Pcc6 mice recognized (bound to) several bands in the nematode antigen preparations (Fig. 5). A lack of binding to LPS and zymosan indicated that cross-reactive responses were not due to these major components of Gram-negative bacteria or yeast contaminating the antigen preparations (data not shown). Furthermore, binding to uninfected RBC antigen (nRBC) controlled for recognition of any host RBC antigens in the parasite preparations. Although Pcc-infected mice strongly recognized a 30 kDa band in the nRBC preparation, this was not present in Pc lysate. Other than the rather weakly bound 49 kDa band, no other antigens common to both host and parasite antigen were detected. Importantly, the binding of antibodies in plasma from control mice was negligible (data not shown). We have measured very low titres of nRBC binding by Pcc sera (ELISA titres of 50–100, statistically indistinguishable from zero; data not shown), which may reflect low combined reactivity to the 30 kDa band plus shared antigens. Interestingly, naïve sera do not bind the 30 kDa band (data not shown) so malaria seems to induce this response to self-antigen, perhaps via polyclonality. To investigate the heterogeneity of parasite antigen recognition (binding) amongst individual mice, sera representing both ‘high’ and ‘low’ responders among Pcc6 mice were selected according to anti-Pc lysate titre and then used to probe the crude parasite antigens (HpA, LsA, NbA and PcL) (Supplementary Figure S1). Overall, comparison of the Western blots performed with individual Pcc6 sera suggested that whilst there was variation in the strength of binding and number of antigens recognized, the recognition of many bands was consistent across mice, and these bands were reflected in the pooled-sera Western blot (Fig. 5). We focus on the bands recognized by sera of all individual mice and in the pooled Pcc6 sera below.
Western blot of parasite antigens probed with anti-sera from a pool of malaria-infected mice (Pcc6). Antibody (IgG) binding to recombinant malaria antigen (MSP-119) is shown in lane 1, uninfected RBC antigen (nRBC) in lane 2, P. chabaudi lysate (PcL) in lane 3, N. brasiliensis Excretory/Secretory antigen (NES) in lane 4, N. brasiliensis antigen (NbA) in lane 5, L. sigmodontis antigen (LsA) in lane 6 and H. polygyrus antigen (HpA) in lane 7. The size of the bands (kDA) is indicated by reference to the protein standard (L). Bands referred to in the paper are circled.

Taken together, our Western blot data suggest that Pcc6 sera recognized high molecular weight bands (>188 kDa) that were distinct to the NbA and HpA preparations and bound more weakly to LsA components. We also detected an antigen or antigens of apparent monomer molecular mass 38 kDa present in PcL, NbA and NES. Of particular interest was that Pcc6 sera recognized several bands of comparable size that were found in both Nb and PcL; these include a 49 kDa and a 98 kDa band in the NbA preparation and a 28 kDa band in the excretory/secretory product of cultured Nb (NES). Further characterization of the molecular contents of these bands would be required to determine if they are indeed the same antigens. Perhaps most striking, however, was the 17 kDa band present in NbA that is of similar size to recombinant malaria antigen MSP-119. These data suggest that the antibody response induced by malaria recognizes proteins that are present in parasite antigen preparations of both Nb and Pcc. Western blot and ELISA data, however, are unable to distinguish whether this cross-reactive response is driven by a subpopulation of Pcc-induced antibodies that bind both Nb and Pcc antigens or whether two (or more) discrete antibody subpopulations are responsible.
Depletion of a sub-population of antibodies with specificity for MSP-119 abrogated binding to Nb antigen
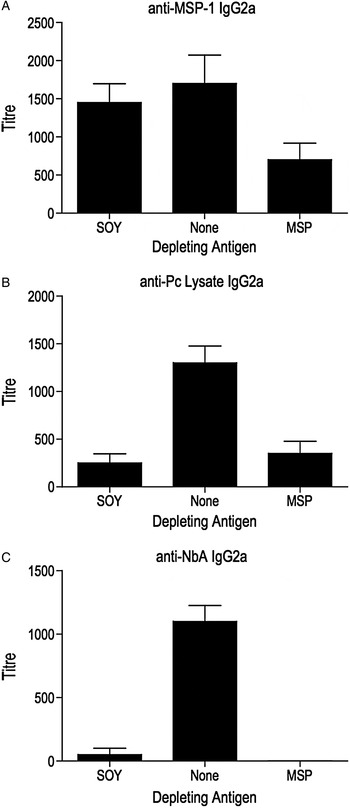
Finally, to ascertain whether the same sub-population of antibodies in Pcc serum bound to both NbA and MSP-119 antigens, we examined whether antibody depletion of Pcc-sera by pre-incubation with MSP-119 antigen altered the cross-reactive (NbA) response subsequently measured by ELISA. First, we found that pre-incubation of Pcc6 sera with MSP-119 (but not soymilk) significantly reduced the anti-MSP-119 IgG2a titre (Fig. 6A; depleting antigen F2, 45 = 3·31, P = 0·0454; MSP-depleted < soymilk-depleted and undepleted, Tukey's adjusted P-value = 0·0446), demonstrating the validity of the technique for depleting antibodies. The anti-Pc lysate IgG2a titre was reduced by pre-incubation with both MSP-119 and soymilk (Fig. 6B; depleting antigen, F2, 45 = 17·88, P < 0·0001; MSP-depleted and soymilk-depleted < undepleted, Tukey's adjusted P-value < 0·0001); these data suggest that antibodies specific to MSP-119 comprise a substantial fraction of the anti-Pc-lysate response [consistent with previous reports (Achtman et al. Reference Achtman, Stephens, Cadman, Harrison and Langhorne2007)] but that the population of antibodies binding Pc lysate also includes a wide array of other specificities that can be depleted by soymilk.
Antibody responses detected following antibody depletion with malaria antigen MSP-1 19 . Antigen-specific and cross-reactive IgG2a responses induced by Pcc infection at high dose (Pcc6) shown as black bars following depletion with MSP-119 (MSP), soymilk (SOY) or no antigen (None). Responses to MSP-119 (A) Pc lysate (B) and NbA (C) are shown. The depleting antigen is indicated on the x-axis and antibody titre on the y-axis. All titres are above the mean + 3 standard deviations of control mice at serum dilution of 1/200. This cutoff is represented as 0 on the y-axis. The figure shows mean and standard error.

Interestingly, MSP-119 depletion abrogated the Pcc6 cross-reactive anti-NbA response (Fig. 6C; depleting antigen F2, 45 = 64·91, P < 0·0001; MSP-depleted and soymilk-depleted < undepleted Pcc6; Tukey's adjusted P-value < 0·0001). The fact that soy depletion did not reduce the anti-MSP-119 response (Fig. 6A) indicates that this antibody subpopulation has high specificity for its cognate antigen. The ability of this subpopulation to also cross-reactively bind NbA is thus, all the more striking. The subpopulation appears small, however, and the soymilk depletion data suggest that a wide array of poly-reactive antibodies were induced by Pcc [consistent with previous reports (Lima et al. Reference Lima, Bandeira, Falanga, Freitas, Kipnis, Dasilva and Coutinho1991; D'Imperio Lima et al. Reference D'imperio Lima, Alvarez, Furtado, Kipnis, Coutinho and Minoprio1996)].
DISCUSSION
We have previously described cross-reactivity between Pcc- and Nb-induced antibody responses in laboratory mice (Fairlie-Clarke et al. Reference Fairlie-Clarke, Lamb, Langhorne, Graham and Allen2010). The primary aim of the present study was to investigate whether increased antigenic experience would improve the immune system's ability to discriminate between these two taxonomically distant parasite species. If cross-reactivity was simply a result of insufficient affinity maturation, then increasing Pcc antigen exposure should enhance specificity for Pcc antigens and we would expect that (cross-reactive) recognition of nematode antigens, for example, would diminish. We manipulated Pcc antigen exposure by capitalizing on the different infection kinetics that result when different inoculating doses of malaria (Pcc dose) are used to induce infection.
As we predicted, Pcc-specific IgG2a antibody responses increased as Pcc antigen exposure increased, but the suggested trade-off in ability to bind other antigens was not evident; the cross-reactive IgG2a response of Pcc-infected mice to crude nematode antigens NbA, LsA and HpA also increased with Pcc antigen exposure. A feature of Plasmodium infection is the expansion of polyclonal B-cells early in infection (Castillo-Mendez et al. Reference Castillo-Mendez, Zago, Sardinha, Freitas Do Rosario, Alvarez and D'imperio Lima2007), which results in enhanced production of non-specific IgG2a antibodies (Lima et al. Reference Lima, Bandeira, Falanga, Freitas, Kipnis, Dasilva and Coutinho1991; D'Imperio Lima et al. Reference D'imperio Lima, Alvarez, Furtado, Kipnis, Coutinho and Minoprio1996; Lima et al. Reference Lima, Alvarez, Furtado, Kipnis, Coutinho and Minoprio1996). However, the increase in cross-reactive antibody titre does not seem to be a consequence of an overall increase in antibody production with greater antigen exposure as total serum IgG was equivalent amongst the different Pcc doses. It is possible that at day 11 pi polyreactive antibodies that have not fully undergone affinity maturation are responsible for some of the cross-reactivity observed here (Achtman et al. Reference Achtman, Khan, Maclennan and Langhorne2003). However in previous experiments, we investigated antibody responses at day 35 pi and found that substantial cross-reactive responses were sustained (Fairlie-Clarke et al. Reference Fairlie-Clarke, Lamb, Langhorne, Graham and Allen2010). We therefore, conclude that the observed cross-reactivity is not merely an artefact of the early timepoint observed. Indeed, the early timepoint made it feasible for us to manipulate antigenic experience of hosts despite the rapid replication rate of the parasites.
We also predicted that increasing Pcc antigen exposure would increase the avidity of antibody for Pcc antigen and reduce avidity to nematode antigens, because with exposure to greater amounts of antigen over a prolonged period, there is greater potential for cells to undergo somatic hypermutation and affinity for maturation, each round being interspersed with antigen-binding and clonal selection (Wang et al. Reference Wang, Huang, Wang, Molina, Chaplin and Fu2000). We therefore determined the proportion of antibodies that bound with high avidity by comparing antigen binding in ELISA in the presence and absence of a hydrogen-bond dissociating agent (urea). Low-avidity antibodies that rely more heavily on hydrogen bonds are preferentially dissociated from the antigen by this method (Bjorkman et al. Reference Bjorkman, Naslund, Stenlund, Maley, Buxton and Uggla1999; Yasodhara et al. Reference Yasodhara, Ramalakshmi and Sarma2001). Contrary to our expectation, the avidity of cross-reactive antibodies to NbA in the Pcc mice increased with antigen exposure. Although non-significant, we also observed this trend for antibody binding to HpA. However, binding of LsA was mostly of low avidity. It should be noted that there is some evidence that high doses of antigen can actually enhance selection of cross-reactive or low-avidity antibodies – an abundance of antigen allowing for the selection of less-specific B-cells which when antigen is limited would be competitively excluded by high-affinity antibodies that bind to antigen more rapidly (Gonzalez-Fernandez and Milstein Reference Gonzalez-Fernandez and Milstein1998; Eisen and Chakraborty Reference Eisen and Chakraborty2010). However, our results contradict this as although we observed an increase in cross-reactive antibodies with increased antigen exposure, these antibodies were of high avidity. It is possible that the nature of the selecting antigen is important; for example, a complex mixture of antigens such as a parasite inoculate (even at ‘low dose’) may be more likely to select for antibodies capable of binding a variety of epitopes (with variable avidities) than inoculation with a defined antigen (Eisen and Chakraborty Reference Eisen and Chakraborty2010). Additionally inoculation with live, replicating parasites would extend the period over which antigen is available for presentation to B-cells and this enhances selection of high-affinity antibody (Wang et al. Reference Wang, Huang, Wang, Molina, Chaplin and Fu2000).
The fact that cross-reactive responses to NbA increased in avidity with increasing Pcc antigen exposure strongly suggests that Pcc and Nb have shared antigens. In other words, there are epitopes that Pcc-induced antibodies are capable of recognizing on both, Pcc and Nb. We even found evidence that there may be shared epitopes between MSP-119 and NbA: the antibody depletion assay shows that a proportion of the Pcc-induced cross-reactivity is due to binding by the same antibody molecule, as opposed to a different antibody fraction of the polyclonal response induced by Pcc infection. Antibody-depletion with soymilk also reduced the cross-reactive anti-NbA response induced by Pcc infection indicating that there are non-parasite-specific antibodies that also bind NbA. However, this does not change the conclusion that NbA and MSP-119 are bound by the same antibody subpopulation, as after soy-depletion the anti-MSP-119 response remained intact. In the event that NbA and MSP-119 were bound by different antibody subpopulations, we would have observed no effect of MSP-119 depletion on the anti-NbA response. This is supported by our Western blot data, which shows that Pcc anti-sera bind to a protein of apparent monomer molecular mass 17 kDa in NbA, which is similar to the size of MSP-119 on Western blot. Whilst we have not yet characterized the similar-sized antigens present in both NbA and PcL that are the bound by the Pcc-induced antibody response in Western blot, a group of proteins expressed by Nb of similar size to those observed here (28 kDa) have been identified as venom allergen proteins (Sotillo et al. Reference Sotillo, Sanchez-Flores, Cantacessi, Harcus, Pickering, Bouchery, Camberis, Tang, Giacomin, Mulvenna, Mitreva, Berriman, Legros, Maizels and Loukas2014). To our knowledge the expression of these proteins by Plasmodium is not yet known. Shared antigens across helminth and protozoan phyla have previously been identified for Schistosoma mansoni and Plasmodium falciparum; a putative P. falciparum protein showed 57% amino acid identity to the 64 kDa protein ‘SmLRR’ from S. mansoni and this protein was bound by antibodies induced by both infections (Pierrot et al. Reference Pierrot, Wilson, Lallet, Lafitte, Jones, Daher, Capron, Dunne and Khalife2006). Often such cross-reactivity is found to be due to conserved carbohydrate moieties (Xu and Powell Reference Xu and Powell1991; Van Remoortere et al. Reference Van Remoortere, Bank, Nyame, Cummings, Deelder and Van Die2003), but we have shown this is not the case in the recognition of NbA by Pcc-induced antibody (Fairlie-Clarke et al. Reference Fairlie-Clarke, Lamb, Langhorne, Graham and Allen2010).
The question remains as to why malaria-induced antibodies maintain the ability to recognize N. brasiliensis and no other rodent nematodes (e.g. it differed strongly from L. sigmodontis and, marginally, from H. polygyrus). Potentially, Pcc-induced antibodies are targeting a molecule in Nb that is not shared by these other nematodes. For example, nematode haemoglobin expressed by Nb was not found in H. polygyrus (Nieuwenhuizen et al. Reference Nieuwenhuizen, Meter, Horsnell, Hoving, Fick, Sharp, Darby, Parihar, Brombacher and Lopata2013); the existence of this molecule in L. sigmodontis is not yet known. Parasite life-history may also play a role such that the function of a shared epitope could relate to residing in a particular anatomical niche or consumption of host RBCs, for example. Interestingly, S. mansoni, which resides in the hepatic portal vein and consumes blood is recognized by P. falciparum induced cross-reactive antibodies (Naus et al. Reference Naus, Jones, Satti, Joseph, Riley, Kimani, Mwatha, Kariuki, Ouma, Kabatereine, Vennervald and Dunne2003), lending some support to the idea that a shared niche may be important for the maintenance of cross-reactive antibodies to taxonomically distinct parasites.
Understanding the potential for immune-mediated interactions between parasites to influence disease outcome is important for health management. Incorporating co-infection and differential exposure to antigens is important in animal models that strive to reflect the situation in natural populations where co-infection is the norm and exposure to parasites is anything but uniform. To our knowledge, this study is the first to suggest that there are proteins common to Pcc and Nb. Our data highlight the potential for interactions between these two parasites to be mediated by immune targeting of cross-reactive antigens. However, the functional consequences of these cross-reactive responses have yet to be elucidated for both host and parasites. From an evolutionary standpoint, targeting cross-reactive antigens may be beneficial to the host if it enables recognition of various pathogens to be achieved by fewer B-cells, which may be particularly important for a resource-limited host (Fairlie-Clarke et al. Reference Fairlie-Clarke, Shuker and Graham2009; Eisen and Chakraborty Reference Eisen and Chakraborty2010). It would be interesting to determine if individuals with natural variation in their B-cell population size or replicative potential varied accordingly in production of cross-reactive antibodies. Genetic variants exist that result in a reduced response to stimulation via the B-cell receptor (Rieck et al. Reference Rieck, Arechiga, Onengut-Gumuscu, Greenbaum, Concannon and Buckner2007). Potentially, cross-reactive binding could ameliorate this limitation by engaging more B-cell receptors. Investigating the potential for this could aid understanding of the benefits of cross-reactivity to the host.
SUPPLEMENTARY MATERIAL
To view supplementary material for this article, please visit http://dx.doi.org/10.1017/S0031182015001390.
ACKNOWLEDGEMENTS
The authors thank R. Maizels and Y. Harcus for providing Nb infective larvae and adult Nb and Hp for the antigenic preparations, and J. Langhorne for recombinant Pcc antigen. We thank J. Bradley and D. Dunne for their helpful suggestions and for comments on a previous draft of this manuscript, and Kathryn Watt, Adam Rosenthal, Caleb Ng and Sheila Brown for technical assistance. In addition, we thank the U. Edinburgh animal care staff for husbandry.
FINANCIAL SUPPORT
This work was supported by a BBSRC David Phillips Fellowship to ALG (Ref. BB/D01977X/1).