INTRODUCTION
With increasing anthropogenic disturbance and land conversion, secondary forests are expanding rapidly in tropical forests of South-East Asia (FAO 2012). Secondary forests are now recognized as an important provider of ecosystem services in contemporary landscapes dominated by humans (Bonner et al. Reference BONNER, SCHMIDT and SHOO2013, Chai & Tanner Reference CHAI and TANNER2011, Poorter et al. Reference POORTER, BONGERS, AIDE, ALMEYDA ZAMBRANO, BALVANERA, BECKNELL, BOUKILI, BRANCALION, BROADBENT, CHAZDON, CRAVEN, DE ALMEIDA-CORTEZ, CABRAL, DE JONG, DENSLOW, DENT, DEWALT, DUPUY, DURÁN, ESPÍRITO-SANTO, FANDINO, CÉSAR, HALL, HERNANDEZ-STEFANONI, JAKOVAC, JUNQUEIRA, KENNARD, LETCHER, LICONA, LOHBECK, MARÍN-SPIOTTA, MARTÍNEZ-RAMOS, MASSOCA, MEAVE, MESQUITA, MORA, MUÑOZ, MUSCARELLA, NUNES, OCHOA-GAONA, DE OLIVEIRA, ORIHUELA-BELMONTE, PEÑA-CLAROS, PÉREZ-GARCÍA, PIOTTO, POWERS, RODRÍGUEZ-VELÁZQUEZ, ROMERO-PÉREZ, RUÍZ, SALDARRIAGA, SANCHEZ-AZOFEIFA, SCHWARTZ, STEININGER, SWENSON, TOLEDO, URIARTE, VAN BREUGEL, VAN DER WAL, VELOSO, VESTER, VICENTINI, VIEIRA, BENTOS, WILLIAMSON and ROZENDAAL2016). Shifting cultivation is one of the drivers of land conversion. Generally, a piece of forested land is slashed and burned, cultivated as cropland for a few years and then left fallow for an extended time. As the area of secondary forests after shifting cultivation is expanding in the tropical region particularly in Borneo (Langner et al. Reference LANGNER, MIETTINEN and SIEGERT2007, Riswan & Hartanti Reference RISWAN and HARTANTI1995), it is important to understand the structure, composition and ecosystem processes of these secondary forests.
Generally, the first decade of forest succession after shifting cultivation is characterized by grasses, forbs and shrubs, which are eventually shaded out by short-lived, light-demanding pioneer tree species (Guariguata & Ostertag Reference GUARIGUATA and OSTERTAG2001). In this period, both above- and below-ground biomass accumulates rapidly (Ewel et al. Reference EWEL, CHAI and LIM1983, Gehring et al. Reference GEHRING, DENICH and VLEK2005, Jepsen Reference JEPSEN2006, Kendawang et al. Reference KENDAWANG, NINOMIYA, TANAKA, OZAWA, HATTORI, TANAKA and SAKURAI2007, Kenzo et al. Reference KENZO, ICHIE, HATTORI, KENDAWANG, SAKURAI and NINOMIYA2010, Lugo Reference LUGO1992, Uhl & Jordan Reference UHL and JORDAN1984). After this period, the canopy is dominated by long-lived, taller light-demanding tree species. Because most of these light-demanding tree species are unable to grow and/or reproduce under their own shade (Knight Reference KNIGHT1975, Saldarriaga et al. Reference SALDARRIAGA, WEST, THARP and UHL1988), they are eventually replaced by other shade-tolerant species characteristic of old-growth forests (Denslow & Guzman Reference DENSLOW and GUZMAN2000, Guariguata et al. Reference GUARIGUATA, CHAZDON, DENSLOW, DUPUY and ANDERSON1997, Knight Reference KNIGHT1975). As described, the primary mechanism of secondary succession has been considered as light and the differences in light-response among species.
However, many dramatic changes occur in soil properties after burning in the practice of shifting cultivation. Burning of the slashed material causes mineralization of nutrients stored in the soils and the above-ground biomass. For example, ash deposition following fires increases the availability of inorganic nitrogen (N) (Grogan et al. Reference GROGAN, BRUNS and CHAPIN2000, Peay et al. Reference PEAY, GARBELOTTO and BRUNS2009, Wan et al. Reference WAN, HUI and LUO2001), phosphorus (P) and potassium (K) in soils (Brand & Pfund Reference BRAND and PFUND1998, Lawrence & Schlesinger Reference LAWRENCE and SCHLESINGER2001). These soil chemical changes may have an extended effect on the later secondary succession. However, the relationships of such soil changes with changes of plant community composition are not well studied in Borneo.
Furthermore, succession (i.e. changes through time) may interact with altitude. For example, lowland forests have different types of plant communities and nutrient dynamics from montane forests because of the effects of altitude. However, past studies on ecosystem processes after shifting cultivation in Borneo were conducted only in the lowlands (Hashimoto et al. Reference HASHIMOTO, TANGE, MASUMORI, YAGI, SASAKI and KOJIMA2004, Jepsen Reference JEPSEN2006, Kenzo et al. Reference KENZO, ICHIE, HATTORI, KENDAWANG, SAKURAI and NINOMIYA2010, Kiyono & Hastaniah Reference KIYONO, Guhardja, Fatawi, Sutisna, Mori and Ohta2000, Lawrence & Schlesinger Reference LAWRENCE and SCHLESINGER2001, Wasli et al. Reference WASLI, TANAKA, KENDAWANG, SEMAN, UNANG, LAT, ABDU, MOROOKA and SAKURAI2009). As altitude increases, temperature decreases and soil nutrient availability usually declines (Gerold et al. Reference GEROLD, SCHAWE and BACH2008, Kitayama & Aiba Reference KITAYAMA and AIBA2002, Soethe et al. Reference SOETHE, LEHMANN and ENGELS2008, Tanner et al. Reference TANNER, VITOUSEK and CUEVAS1998). Due to such synchronous changes of abiotic conditions, above-ground productivity, biomass and plant species richness usually decrease with increasing altitude (Gentry Reference GENTRY1988, Homeier et al. Reference HOMEIER, BRECKLE, GUNTER, ROLLENBECK and LEUSCHNER2010, Kitayama & Aiba Reference KITAYAMA and AIBA2002). We, therefore, focused on the patterns of succession, which might co-vary with altitude in a landscape context, with a particular emphasis on soil nutrient availability.
We studied plant communities and ecosystem processes in seres at multiple altitudes, which form a succession-altitude matrix. We address the following hypotheses: (1) Interactions of altitude and the time elapsed after slash and burn determine the structure, composition and ecosystem processes of plant communities. (2) Soil N and P decrease with stand age due to increasing soil acidity and plant uptake, which feeds back to plant community during the succession.
METHODS
Study site
The study was conducted in the upland area between the Kinabalu Park and the Crocker Range Park in Sabah, northern Borneo (Fujiki et al. Reference FUJIKI, OKADA, NISHIO and KITAYAMA2016). This area is located within one of the forests most species-rich in vascular species in the world (Beaman Reference BEAMAN2005). Total annual rainfall and mean annual temperature are respectively approximately 2000–2500 mm and 15–24°C. Geology of the entire area consists of Tertiary sedimentary rock (mostly sandstone and siltstone) of the West Crocker Formation. The original vegetation of this area is the lower montane tropical rain forest dominated by the families Fagaceae, Myrtaceae and Lauraceae (Aiba & Kitayama Reference AIBA and KITAYAMA1999, Kitayama Reference KITAYAMA1992). This area has long been inhabited by indigenous people who practice shifting cultivation for subsistence. One family slashes and burns patches (commonly 0.5 ha each) of young- to old-growth forests, cultivates hill paddy for the first year and abandons the land for fallow. Mean fallow period is approximately 7 y. The first-year hill paddy is occasionally followed by mixed crops of corn and other crops for the second year. Field survey was conducted for 2 mo in total in August 2012 and August 2013.
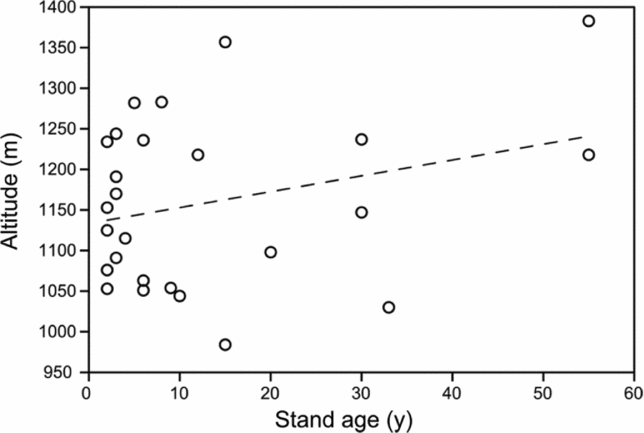
We visually identified vegetation patches by driving and walking through the entire area and interviewed local people to identify the age of each patch (i.e. stand age after slash and burn). We randomly selected a total of 28 stands in this area to establish inventory plots. Twenty-five stands were selected to represent a few to 55 y after shifting cultivation. Additionally, one stand was selected in a field where slash and burn just took place (i.e. non-vegetated with remnant chars) and two stands were selected in an old-growth forest with unknown age after slash and burn; however, some of the canopy trees in each of the two stands consisted of climax taxa with 75-cm maximum diameter at breast height. Because diameter growth of these trees is commonly slow (approximately 0.2 cm y−1; Aiba & Kitayama Reference AIBA and KITAYAMA2002), we assumed the age of the two stands as more than 100 y. Altitude of these stands varies between 900 m and 1400 m asl. Hill paddy is the major crop in shifting cultivation in this area. We therefore assumed that hill paddy was cultivated in the past in all stands older than 2 y and that the initial condition was the same across stands at a given altitude. There was no significant relationship between stand age and stand altitude in our samples (linear regression, P > 0.05, Appendix 1).
Field sampling and chemical analyses
A plot was placed in each stand. The size of a plot varied depending on stand age because herb/tree size varied greatly; a 10 × 10-m plot for herbaceous communities, a 20 × 20-m plot for young fallow stands with trees (age < 50 y) and a 30 × 30-m plot for the old fallow stands (age > 50 y). We inventoried all vascular species with estimates of cover abundance using the Braun–Blanquet scales in each plot. If species could not be identified in the field, voucher specimens were collected and identified in the local herbaria, Forest Research Centre at Sandakan (SAN, Sabah Forestry Department) and Kinabalu Park (SNP, Sabah Parks). For the plants that were difficult to identify to species, we distinguished as separate morphotypes based on morphological characters of vegetative organs (leaves and twigs).
Furthermore, we measured diameter at breast height (dbh) of each tree and identified the species if any trees were present. In each of the 20 × 20-m plot for young fallow stands (age < 50 y), a 5 × 5-m subplot at the centre and four 2 × 2-m small plots at the four corners were placed. Trees with dbh ≥ 5 cm were measured in the main plot, while trees with 5 cm > dbh ≥ 1 cm in the subplot and small trees with dbh < 1 cm in the four small plots. In each of the 30 × 30-m plots for the old fallow stands (age > 50 y), a 20 × 20-m subplot at the centre and four 5 × 5-m small plots at the four corners were placed similarly as a 20 × 20-m plot. Trees with dbh ≥ 20 cm were enumerated in the main plot, while trees with 20 cm > dbh ≥ 5 cm in the subplot and those with 5 cm > dbh ≥ 1 cm were enumerated in the small plot. Subsequently, herbs and small trees (dbh < 1 cm) were harvested in each small plot, oven-dried at 70°C for 3 d, and weighed to determine biomass density per area.
Above-ground biomass (AGB) of trees dbh ≥ 1 cm in each stand was estimated from an empirical allometric relationship reported for tropical secondary forests after shifting cultivation in Sarawak, Malaysia (Kenzo et al. Reference KENZO, ICHIE, HATTORI, ITIOKA, HANDA, OHKUBO, KENDAWANG, NAKAMURA, SAKAGUCHI, TAKAHASHI, OKAMOTO, TANAKA-ODA, SAKURAI and NINOMIYA2009), with a similar climate and flora as our site:
 $$\begin{equation*}
{\rm{AGB}}\left( {{\rm{kg }}{{\rm{m}}^{ - 2}}} \right) = 0.0829\;{\rm{ db}}{{\rm{h}}^{2.43}}
\end{equation*}
$$
Soil samples were collected from each stand by using a core sampler (37 mm diameter). Four 20-m transect lines were set in each stand, and five cores of 15 cm depth were collected at 5-m intervals along a transect line. Each core was divided into two depths (0–5 cm and 5–15 cm). Soil samples were combined by the same transect line as a composite (i.e. four composite per stand) and immediately stored in an icebox. In the laboratory, we manually removed roots and stones from soil samples. A subsample of each soil sample was oven-dried at 70°C for 3 d, and weighed to determine gravimetric water content and dry mass. Bulk density was determined based on the known volume of the core and dry mass.
We placed eight litter traps, each with an area of 0.5 m2, in each stand. Trapped litter was collected after 14 d and combined in each stand. Litter samples were oven-dried at 70°C for 3 d and ground for chemical analyses. We collected litter once only for determining nutrient concentrations.
We collected sun leaves of dominant species in five stands, representing different stages of a sere (4, 10, 15, 30 and 55 y). These species were selected based on a vegetation analysis. Sun leaves of Alphitonia excelsa, Clethra canescens and Macaranga costulata were collected in 4-y-old and 10-y-old stands, Adinandra dumosa, Clethra canescens and Macaranga costulata in a 15-y-old stand, Adinandra dumosa and Clethra canescens in a 30-y-old stand, and Adinandra dumosa and Astronia macrophylla in a 55-y-old stand. In each stand, we collected three foliar samples of each dominant species. These foliar samples were immediately oven-dried at 70°C for 3 d and ground for chemical analyses.
Soil pH was determined in slurry of a 1:4 fresh soil to deionized water. We analysed organic carbon (C), total nitrogen (N), total phosphorus (P), nitrate nitrogen (NO3-N) and ammonium nitrogen (NH4-N) in soil samples and total C, N and P in litter and foliar samples. The concentrations of total C and N in soil, litter and foliar samples were determined by the dry combustion method with an NC analyser using SUMIGRAPH NC-800 (SCAS, Japan). To measure the concentration of total P, a 0.2-g subsample of each soil/litter/leaf sample was weighed and digested on a block digester with concentrated H2SO4 and H2O2. Digestion was repeated until the solution became clear. Digests were filtered through Whatman 2V filter paper and made up to 50 ml with deionized water. The concentration of P in the digest was determined on an inductively coupled plasma emission spectrophotometry using ICPS-7510 (Shimadzu, Japan). We used NIST Apple Leaves (1515) and Swiss Soil (912) as internal standard; mean ± SD recovery of P was 101% ± 2.7% (n = 10) for the NIST Apple Leaves and 98.3% ± 4.1% (n = 8) for the Swiss Soil (912). Inorganic N in soil samples was extracted with 1.5N KCl solution and the concentrations of NO3-N and NH4-N in the extracts were determined colorimetrically using an automated colorimetric analyser (Futura, Alliance, France). Pool size of soil organic C, total N, total P and inorganic N on an area basis to the depth of 15 cm was estimated by multiplying respective concentration with bulk density each for surface (0–5 cm) and subsurface (5–15 cm) layer and subsequently by summing the two layers. Preparation of samples was conducted in Sabah and all chemical analyses were conducted in Japan.
Data analysis
TWINSPAN (two way indicator species analysis) was run to classify vegetation sample stands by using PC-ORD Version 5. For this analysis, we used species including all enumerated vascular species with five pseudospecies cut levels (0, 2%, 5%, 10% and 20% of relative abundance). TWINSPAN is based on dividing a reciprocal averaging ordination space. Clustered, selected species are derived to indicate the classified vegetation types. A multivariate DCA (detrended correspondence analysis) was conducted to visualize and quantify the gradients in both species composition and their environmental controls using CANOCO Version 4.5 (ter Braak & Smilauer Reference TER BRAAK and SMILAUER2002). DCA was run using the default options, detrending by segments and non-linear rescaling. We used relative abundance of each species based on coverage for all inventoried species per stand. Pearson correlation coefficients were used for correlation of environmental variables (stand age, altitude, slope and soil properties) with DCA axes. We conducted these analyses using 25 stands (age < 60 y) except for the two oldest stands (age > 100 y), because exact ages of these stands could not be identified and their species composition was very different from the other stands. One stand right after burning without any plants was also excluded for obvious reasons.
Species diversity of trees (excluding herbs/forbs) was analysed using species richness (S, the total species number per stand) and Shannon–Wiener diversity (H’).
 $$\begin{equation*}
H' = -\sum {\rm{ }}\ln \left( {{{\rm{p}}_{\rm{i}}}} \right){{\rm{p}}_{\rm{i}}}
\end{equation*}
$$
 $$\begin{equation*}
{{\rm{p}}_{\rm{i}}} = {{\rm{n}}_{\rm{i}}}{{\rm{N}}^{ - {\rm{1}}}}
\end{equation*}
$$
where pi is the relative abundance of species i, ni is the number of individuals for species i and N is the total individual number per stand.
Multiple regression analyses were applied to AGB, soil nutrient data (organic C, total N, inorganic N, total P and pH), litter and foliar nutrient data (N, P and N:P ratio) and species diversity. The R statistical program (R version 2. 15. 2) was run to use the above data as response variables and stand age and altitude as independent variables. The independent variables were chosen by a step-wise selection using AIC.
RESULTS
Vegetation patterns
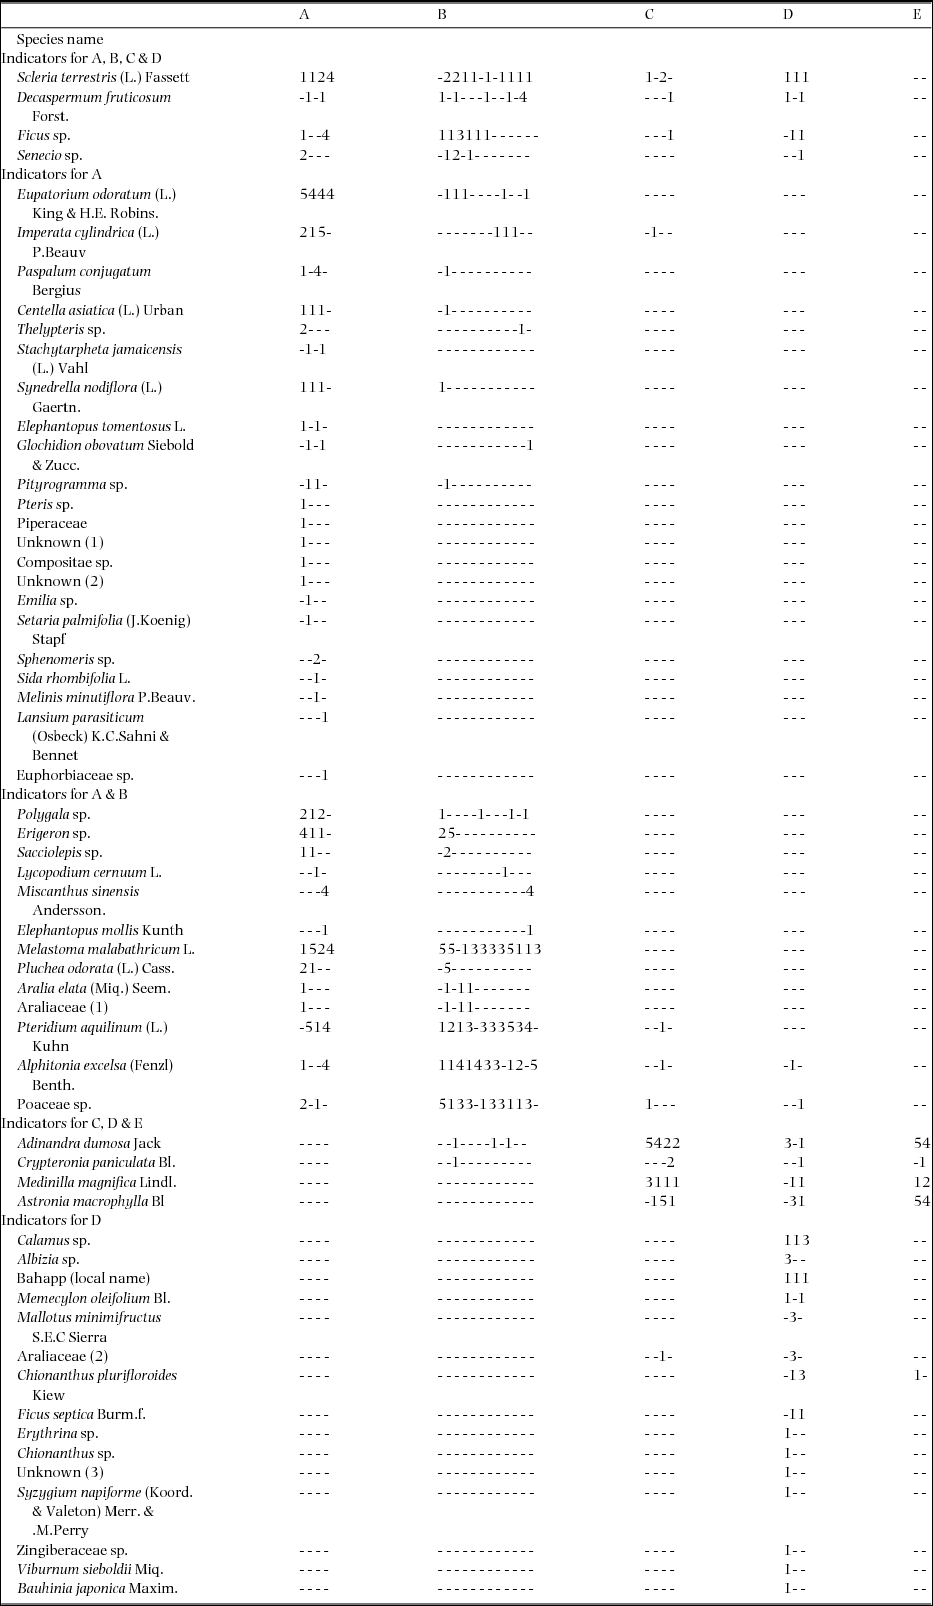
Overall, 286 species were identified in 25 stands (age < 60 y) and enumerated species became 379 species when the two old stands (age > 100 y) were included. As the results of TWINSPAN, 25 stands were categorized into five groups (Appendix 2). The first group was categorized with the four stands that were 2–6 y after slash and burn. This group was a herbaceous community with an average height of 3.3 m and the dominant species Eupatorium odoratum, Melastoma malabathricum and Pteridium aquilinum. The second group was categorized with the 12 stands that were 2–10 y. This group was a shrub community with an average height of 7.5 m and the dominant species Melastoma malabathricum, Pteridium aquilinum, Poaceae, Alphitonia excelsa, Macaranga costulata and Clethra canescens. The third group was categorized with the four stands that were 12–30 y old. This group was an upper montane short-forest community above 1100 m asl with an average height of 19.8 m and the dominant species Adinandra dumosa, Astronia macrophylla and Itea macrophylla. The fourth group was categorized with the three stands that were 15–33 y old. This group was a lower montane short-forest community below 1100 m asl with an average height of 17.3 m and the dominant species Clethra canescens, Ilex cymosa and Albizia falcataria. The last group was categorized with the two stands that were 55 y old. This group was a forest community with the canopy height of 23.0 m and the dominant species Adinandra dumosa, Astronia macrophylla and Weinmannia fraxinea.
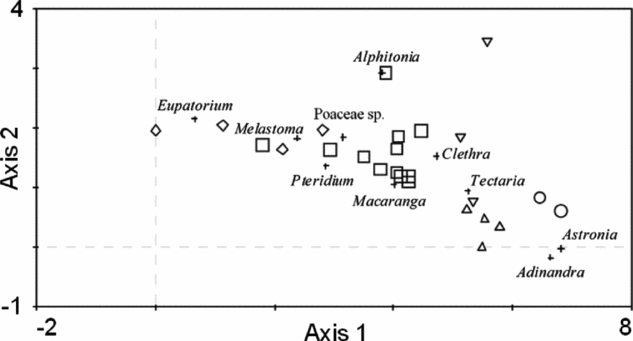
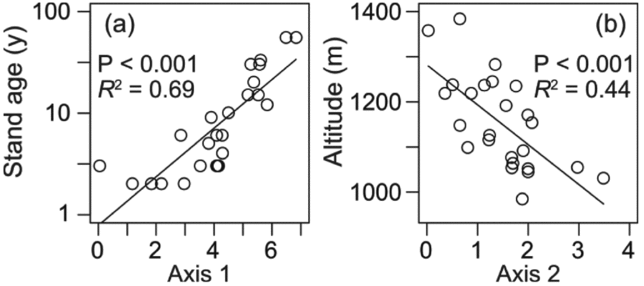
The results of DCA are shown by a biplot of stands and species in Figure 1. Stands were scattered along the axis 1 and the axis 2 (eigenvalue is 0.786 for the axis 1 and 0.465 for the axis 2). Furthermore, plant communities classified according to the result of TWINSPAN were clustered with each other in the biplot. Axis-1 values of stands significantly correlated with stand age (Figure 2a; R 2 = 0.691, P < 0.001), while axis-2 values of stands significantly correlated with altitude (Figure 2b; R 2 = 0.444, P < 0.001). These results suggest that the vegetation in this area is patterned by the time elapsed after slash and burn as well as by altitude. The results of TWINSPAN are consistent with those of DCA, which confirms the shift of plant communities primarily along a time axis and secondarily along an altitudinal axis in the later stage of succession. Results also show that plant communities are not differentiated along an altitudinal axis in the early stage of succession.
The results of a DCA analysis on 25 vegetation stands in the upland area between the Kinabalu Park and the Crocker Range Park in Sabah, northern Borneo. Circles, diamonds, triangles and squares indicate stands, while crosses indicate dominant species. Different symbols of stands indicate the five plant communities (diamonds, herbaceous community; squares, shrub community; triangles, upper montane short forest community; inverted triangles, lower montane short-forest community; and circles, forest community) classified by TWINSPAN. Eigenvalue is 0.786 for the axis 1, and 0.465 for the axis 2. Dominant species are represented by generic names.

The relationships between axis 1 values and stand ages (years) (a), and Axis 2 values and altitudes (m asl) (b) for 25 vegetation stands in the upland area between the Kinabalu Park and the Crocker Range Park in Sabah, northern Borneo. Axis 1 and axis 2 are the two main axes of the DCA analysis. Both diagrams show a significant relation ((a): P < 0.01, R 2 = 0.691, (b): P < 0.01, R 2 = 0.444).

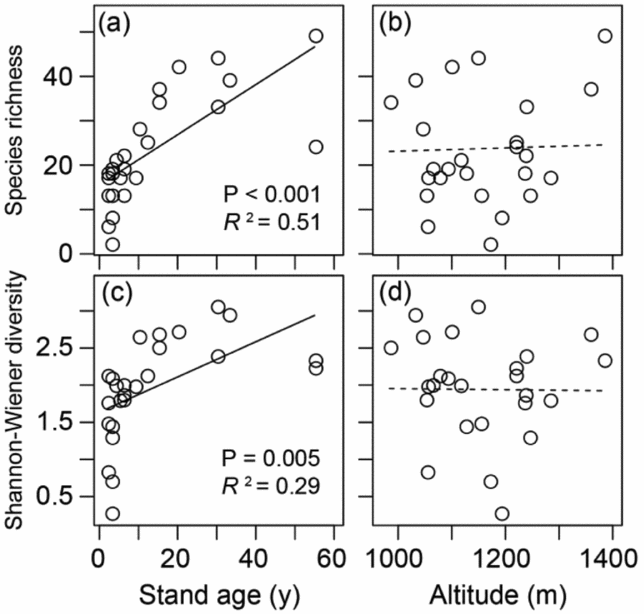
Species richness significantly increased with succession but did not change with altitude (Figure 3a, b, Table 1). Richness rapidly increased during the first 20 y after slash and burn. Shannon–Wiener diversity also significantly increased with succession (Figure 3c, Table 1). On the other hand, Shannon–Wiener diversity tended to decrease with increasing altitude (Figure 3d, Table 1).
The relationships between indexes of species diversity (Species richness (Sp), Shannon–Wiener diversity (H’)) and stand age (y) and altitude (m asl) for 25 vegetation stands in the upland area between the Kinabalu Park and the Crocker Range Park in Sabah, northern Borneo. Sp vs. stand age (a), Sp vs, altitude (b), H’ vs. stand age (c), H’ vs. altitude (d). Solid and dashed lines indicate significant (P < 0.05) and non-significant regression lines respectively.

Summary of multiple regression analysis of species richness and index of diversity with age and altitude of 25 stands in the upland area between the Kinabalu Park and the Crocker Range Park in Sabah, northern Borneo. Species richness and Shannon–Wiener diversity were regarded as response variables and stand age and altitude as independent variables. The independent variables were chosen by a stepwise selection using AIC. *0.01 < P < 0.05; **0.001 < P < 0.01;***P < 0.001.

Biomass and ecosystem processes
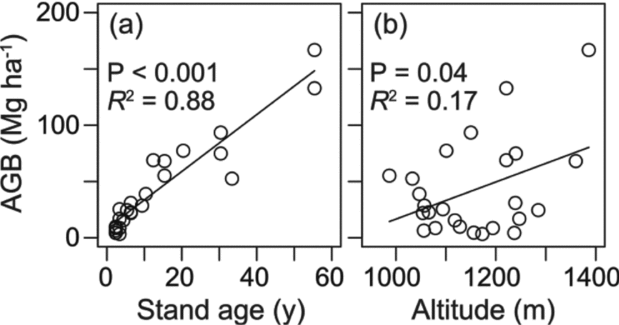
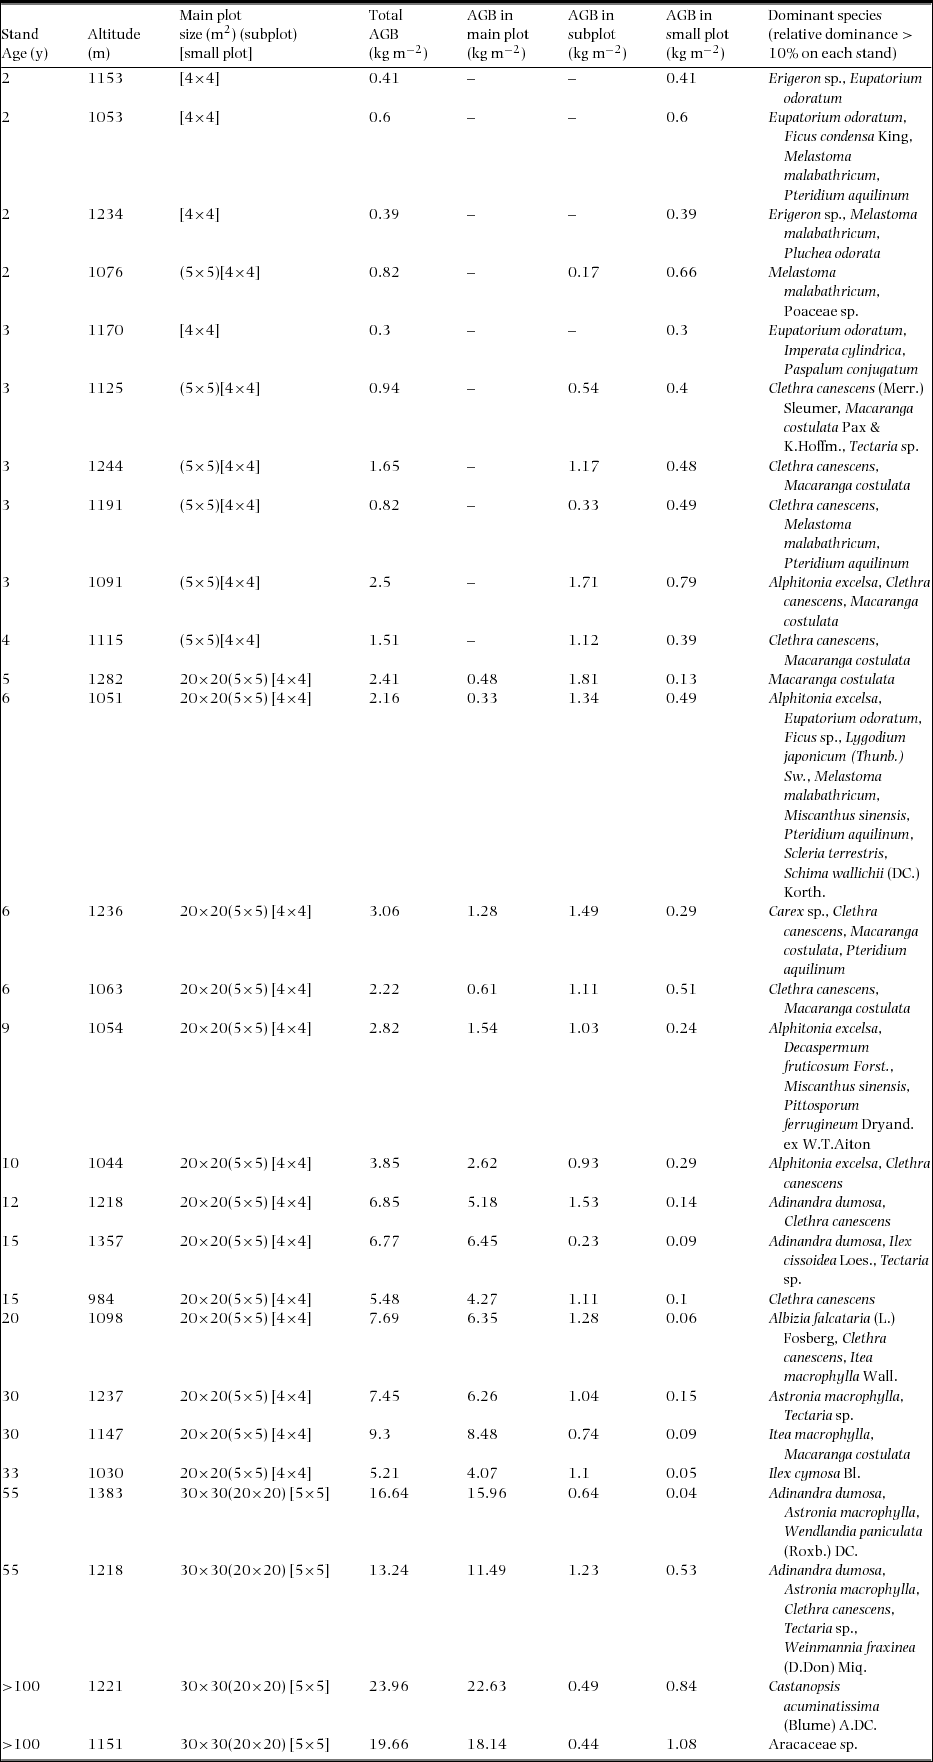
The 2- or 3-y-old stands were composed just by herbs, and after 3 y shrubs or trees gradually grew up (Appendix 3). Total AGB increased linearly during succession (Figure 4a). AGB also increased with increasing altitude (Figure 4b). According to the multiple regression analysis, AGB (Mg ha−1) significantly related with both stand age (SA, y) and altitude (ALT, m):
 $$\begin{eqnarray*}
&&{\rm{Total\; AGB }}\;\left( {{\rm{Mg\, h}}{{\rm{a}}^{ - 1}}} \right) \nonumber\\
&&\quad = - 49.2 + 2.42\,{\rm{ SA}} + 0.0511\;{\rm{ ALT}}
\end{eqnarray*}
$$
The relationships between stand age and total AGB (a), and altitude and total AGB (b) for 25 vegetation stands in the upland area between the Kinabalu Park and the Crocker Range Park in Sabah, northern Borneo. Both age and altitude have a significant relation with total AGB ((a): P < 0.001, R2 = 0.888, (b): P < 0.05, R 2 = 0.167). As the result of multiple regression analysis, total AGB (Mg ha−1) is explained by stand age (SA, y) and altitude (ALT, m asl).

Compared with the nearby pristine montane forest on Mount Kinabalu under a similar climate, the AGB of the old-growth forests (age > 100 y) (240 Mg ha−1 and 197 Mg ha−1) was still lower than that of the pristine forests (294 Mg ha−1 at 1700-m site).
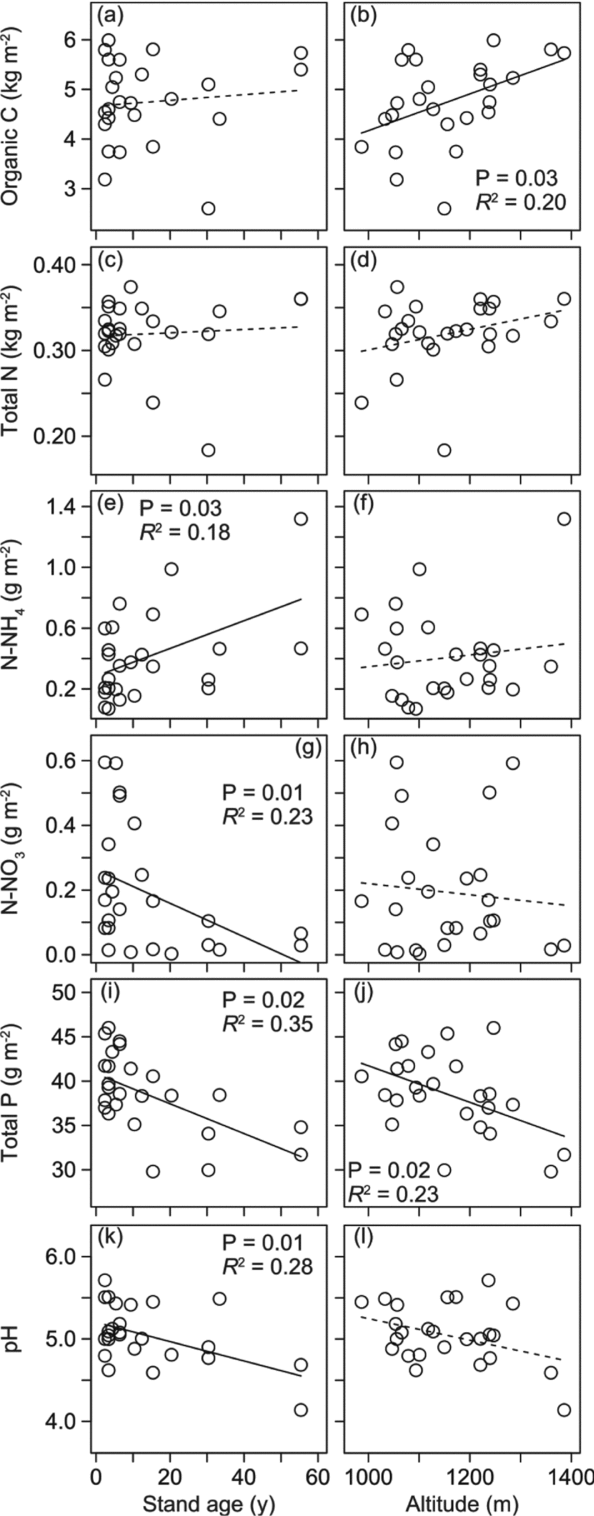
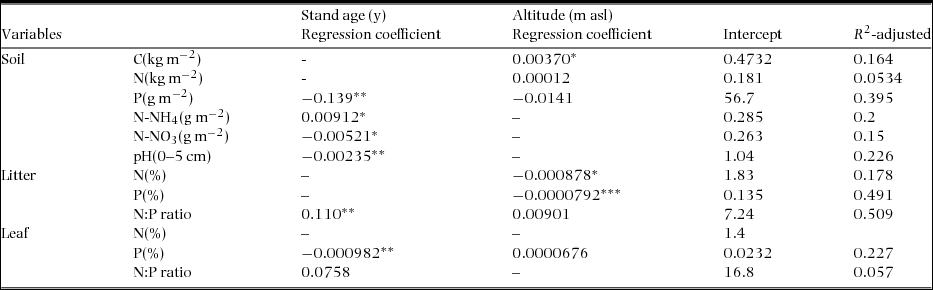
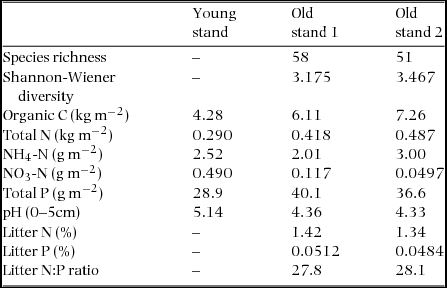
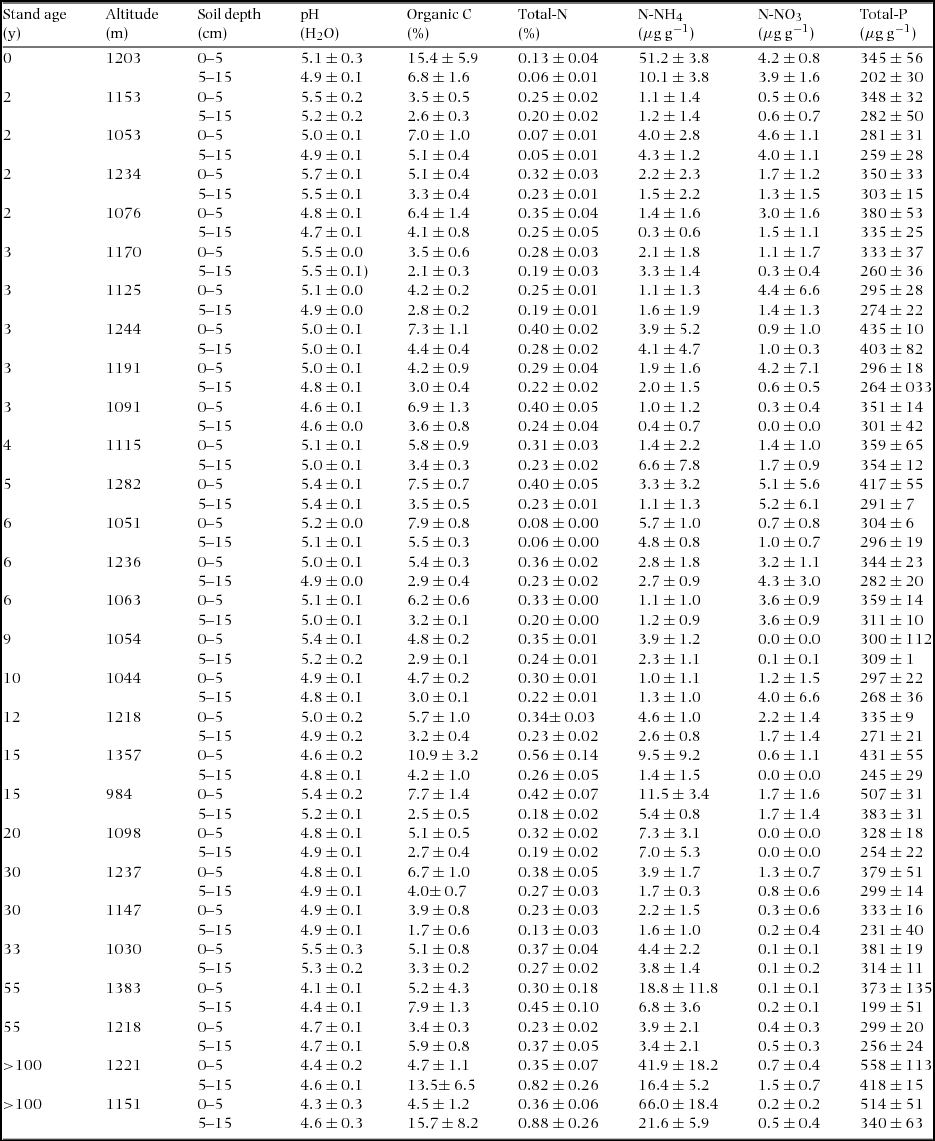
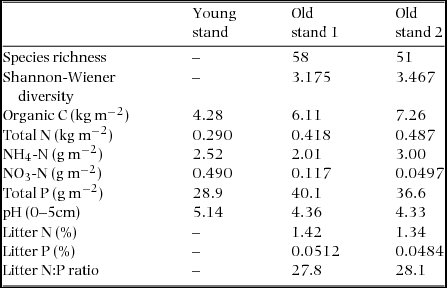
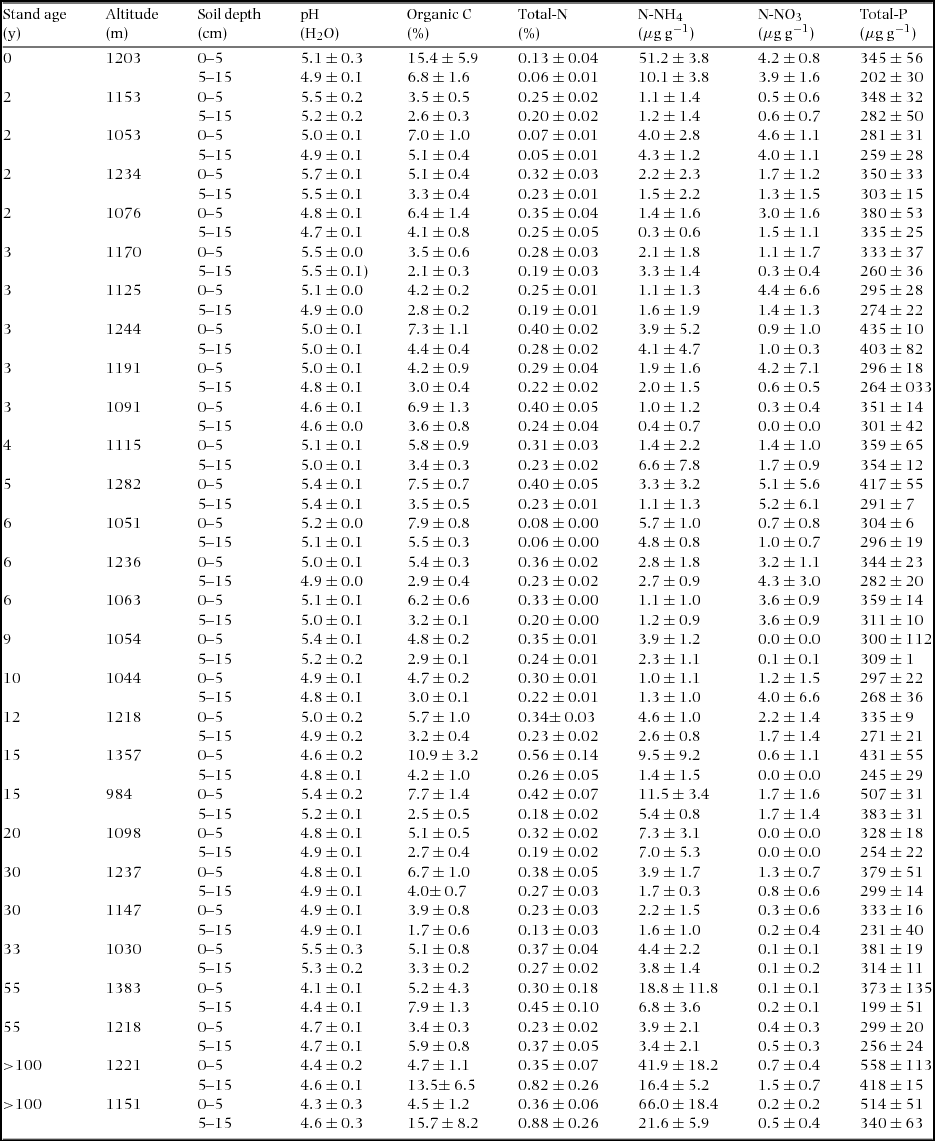
Soil organic C (OC) pool (kg m−2) did not have a significant relation with stand age, but significantly increased with increasing altitude (Figure 5, Table 2). Soil total N pool (kg m−2) did not have significant relations with both stand age and altitude. On the other hand, Soil NH4-N pool significantly increased with age while soil NO3-N pool (g m−2) significantly decreased with age. Neither NH4-N pool nor NO3-N pool had a significant relation with altitude. Soil total P pool (g m−2) significantly decreased with increasing stand age and increasing altitude. Soil total P pool is the product of soil bulk density (mass per volume) and soil P concentration. In our site, neither soil bulk density nor soil total-P concentration changed significantly with stand age for the surface and subsurface layers (P > 0.05, Appendix 4). Soil pH significantly decreased with increasing stand age. Soil properties in one young stand just after burning and two old stands (age > 100 y) are shown in Appendix 5. The stand just after burning demonstrated an elevated pool of soil NH4-N (2.52 g m−2). The two old stands demonstrate small pools of soil NO3-N (0.117 and 0.050 g m−2) and relatively large pools of NH4-N (2.01 and 3.00 g m−2). Soil chemical properties of all 28 stands are shown in Appendix 6.
The relationships between soil properties (organic C, total N, inorganic N (NH4-N and NO3-N), total P and pH) and stand age (y) and altitudes (m asl) for 25 vegetation stands in the upland area between the Kinabalu Park and the Crocker Range Park in Sabah, northern Borneo. Organic C vs. stand age (a) and altitude (b), total N vs. stand age (c) and altitude (d), N-NH4 vs. stand age (e) and altitude (f), N-NO3 vs. stand age (g) and altitude (h), total P vs. stand age (i) and altitude (j), pH vs. stand age (k) and altitude (l). Solid and dashed lines indicate significant (P < 0.05) and non-significant regression lines, respectively.

Summary of multiple regression analysis of soil, litter and leaf nutrient data with age and altitude of 25 stands in the upland area between the Kinabalu Park and the Crocker Range Park in Sabah, northern Borneo. Nutrient data were regarded as response variables and stand age and altitude were as independent variables. The independent variables were chosen by a step-wise selection using AIC. *0.01 < P < 0.05; **0.001 < P < 0.01;***P < 0.001.
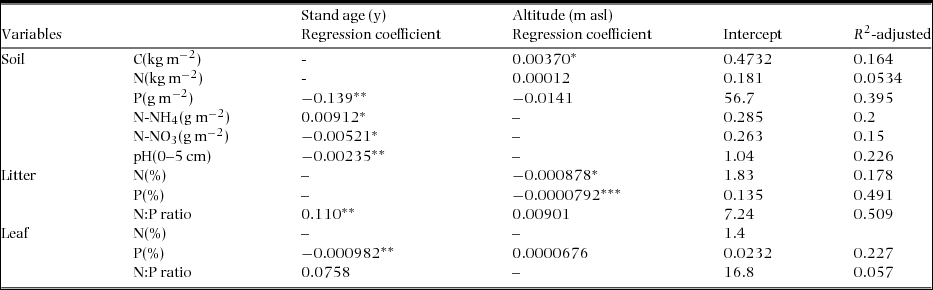
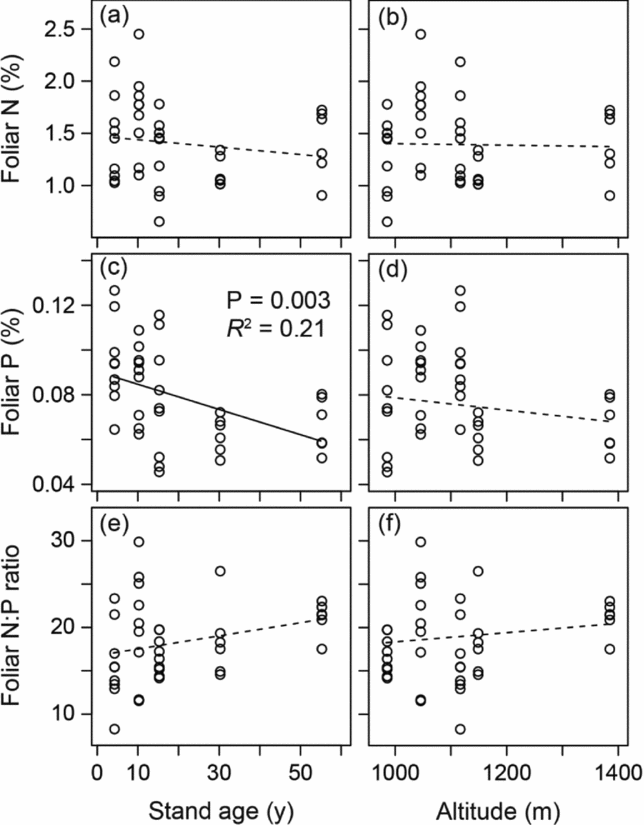
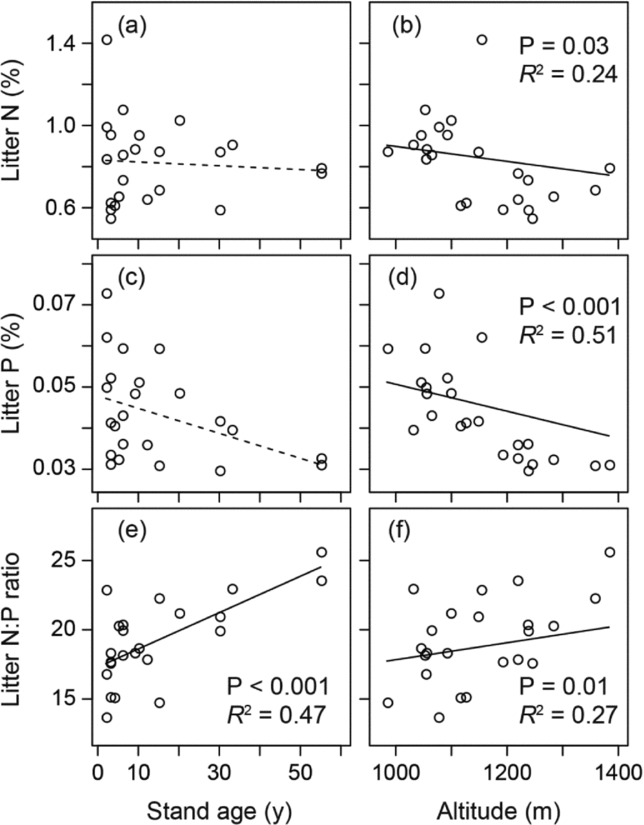
With increasing age, foliar N concentration did not significantly decrease (from 1.44% to 1.41% in 55 y), while foliar P concentration significantly decreased by 30% (from 0.094% to 0.066%). Foliar N and P concentrations did not relate to either stand age or altitude (Table 2, Appendix 7). Leaf-litter N concentration decreased by 9% only (from 0.85% to 0.77%), while leaf-litter P concentration decreased by 33% (from 0.049% to 0.033%) although not significantly. Leaf-litter N and P concentrations significantly decreased with increasing altitude and leaf-litter N:P ratio significantly increased with stand age (Table 2, Appendix 8).
DISCUSSION
Effects of stand age
We found that vegetation patterns are strongly influenced by time and less strongly by altitude in the landscape affected by slash and burn in the montane zone of northern Borneo. Plant communities and soil nutrient pools change considerably with time along a sere in our site. The early phase of the succession involves the replacement of a herbaceous community with a shrub community, which is later replaced by a tree community. The successive increase of community height clearly indicates that the competition for light is involved in the succession (van Breugel et al. Reference VAN BREUGEL, BREUGEL, JANSEN, MARTÍNEZ-RAMOS and BONGERS2012). Light-demanding pioneers that dominate the early phase of secondary succession are known to be generally nutrient-demanding species (Baker et al. Reference BAKER, SWAINE and BURSLEM2003). However, shade-tolerant species eventually dominate the later phase and they are known to be conservative in nutrient demand (Mason et al. Reference MASON, RICHARDSON, PELTZER, DE BELLO, WARDLE and ALLEN2012). Therefore, as a general pattern of secondary succession, the interplay of light and soil nutrients may be involved in the community changes during succession.
Most distinct temporal changes in soil nutrients are the initial increase of the pool of inorganic N and soil total P and their subsequent reduction. At the onset of the secondary succession, soil inorganic N is rapidly released to soil as the mineralization of plant detritus is accelerated by burning and decomposition. When soil is heated, ammonium levels generally increase because NH3 is released from thermal decomposition of organic matter and protein hydrolysis (Giardina et al. Reference GIARDINA, SANDFORD, DOCKERSMITH, SANFORD and DOCKERSMITH2000, Russell et al. Reference RUSSELL, FRASER, WATSON and PARSONS1974), which will be quickly nitrified to NO3-N. However, soil NO3-N pool significantly decreases with increasing stand age, which suggests an overall reduction of soil N availability because NO3-N is a major N source for plants. By contrast, the pool of soil NH4-N significantly increases with age. These successional changes in soil inorganic N may be related to significantly decreasing soil pH with age. Our oldest forest as the end-climax member of the succession demonstrates a small pool of soil NO3-N and a relatively large pool of NH4-N. Therefore, the reduction of NO3-N and overall reduction of N availability continues consistently towards a climax stage.
The significant decline of soil pH with age can be explained by a few mechanisms. First of all, exchangeable base cations (Ca, Mg and K) will be lost through leaching during succession, which causes the decline of soil pH. Slash and burn will return those exchangeable cations from vegetation to the soils as ash, which will increase soil pH at the onset of the succession. Moreover, plant detritus will be added during succession, which will also cause the decline of soil pH (Jobbágy & Jackson Reference JOBBÁGY and JACKSON2003). Effects of added detritus can be significant in our site because decomposition of such detritus is slow due to the cool montane climate. Thus, the decline of soil pH may exacerbate the reduction of soil N availability.
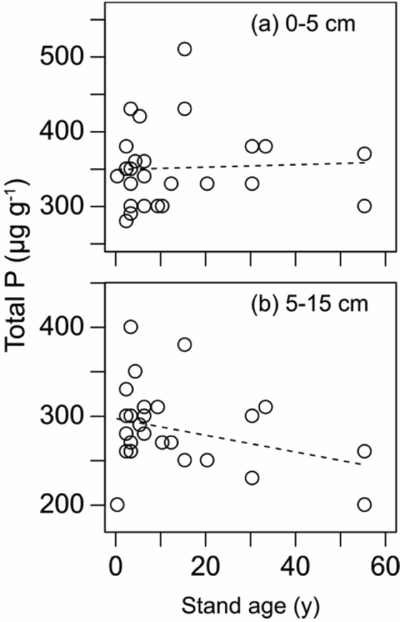
The most distinct change in soil nutrients during the succession is a linear reduction of soil total P pool with age. Although neither bulk density nor soil total-P concentration significantly changed with age, soil total-P concentration in the subsurface layer (5–15 cm) tended to decrease with age. This decreasing trend of the concentration in the subsurface layer may be related to the reduction of overall soil P pool. We took a space-for-time approach in our study and the variation of soil P may simply reflect spatial variation; however, this is unlikely because the correlation of soil total P with age is significant. The exact mechanisms explaining the reduction of soil P concentration are not known. The increase of AGB may explain the reduction of soil P as plants absorb P from soils. Assuming that the mean concentration of P in stem biomass is 0.019% (Imai et al. Reference IMAI, KITAYAMA and TITIN2012), we estimate that the total amount of P contained in AGB in our 55-y-old forest is approximately 2.8 g P m−2, suggesting that a total of 2.8 g P m−2 was absorbed from soils by the above vegetation. On the other hand, reduction of soil total P is approximately 7.6 g P m−2 after 55 y (based on the multiple regression in Table 2). Therefore, the absorption by vegetation alone cannot explain the reduction of soil total P. Soil total P actually includes various fractions of P, which have differential solubility dependent on soil pH (Tiessen et al. Reference TIESSEN, SALCEDO and SAMPAIO1992). Pool of the soil P fraction that dissolves in acid solution is generally very small in soils derived from sedimentary rocks in this area (Kitayama et al. Reference KITAYAMA, MAJALAP-LEE and AIBA2000). Depletion of such a fraction due to soil acidification cannot explain the overall reduction of soil total P pool either.
Although exact mechanisms of the reduction of soil nutrient availability are not known, the magnitude of P deficiency clearly increased with increasing stand age during succession. In addition to the decline in soil total P, soluble P (i.e. bioavailable P) will also decline with acidification because orthophosphate binds to Al and Fe oxides through chemisorption (Certini Reference CERTINI2005). Most likely, soil P availability decreases with succession in our site because of the combined effects of the reduction of both total P and soluble P.
Leaf-litter N:P ratios increased significantly with increasing age at the rate of 0.11 y−1, translating to the increase by 5.5 in 55 y. All stands older than 5 y demonstrate leaf-litter N:P ratios exceeding 16, which is generally considered a threshold of P deficiency (Koerselman & Meuleman Reference KOERSELMAN and MEULEMAN1996). The magnitude of reduction in P with age was greater than in N, and in leaf litter than in intact leaves. This suggests that a disproportionately greater amount of P is resorbed prior to leaf shedding in the later phases of the succession. We suggest that magnitude of P deficiency increases with stand age and plants respond to the P deficiency by increasing the resorption efficiency of nutrients (particularly P). Probably, tree species shift to those of greater P-use efficiency during the succession because of decreasing soil P availability. Earlier studies suggest that secondary forests are limited by N in tropical lowland zones (Davidson Reference DAVIDSON2004, Davidson et al. Reference DAVIDSON, DE CARVALHO, FIGUEIRA, ISHIDA, OMETTO, NARDOTO, SABÁ, HAYASHI, LEAL, VIEIRA and MARTINELLI2007). It is true that N availability decreases with succession also in our case. However, the magnitude of P deficiency appears to be greater than N in our case. Lawrence & Schlesinger (Reference LAWRENCE and SCHLESINGER2001) found that soil total P increases during a few cycles of shifting cultivation in West Kalimantan; they suggest that soil total P increases due to nutrient pumping by the deep fine roots of pioneer tree species from deep soil horizons and consequently the fraction of organic P increases in surface soils. Cycles of slash-and-burn (which returns ashes to the soil) and bush fallow (which returns organic P) explain the increase of soil total P as a function of the number of fallow cycles in West Kalimantan. Recovery of soil P during bush fallow has been reported also from semi-arid north-eastern Brazil (Tiessen et al. Reference TIESSEN, SALCEDO and SAMPAIO1992). By contrast, we have reconstructed a single sere, which mimics a long-term vegetation recovery from a single slash-and-burn event. As we have indicated earlier, P accrued from a secondary forest to soils by slash and burn will not replenish the overall loss during the succession and repeated fallow cycles may gradually lead to the depletion of soil P in our site.
Total AGB increased linearly at the rate of 2.42 Mg ha−1 y−1 during 55 y after shifting cultivation in our Bornean montane zone. The 55-y forest (149 Mg ha−1) can attain about 69% of AGB of the old-growth forest (218 Mg ha−1). A 55-y lowland forest on Tertiary sedimentary rock (the same as ours) at 130 m asl in Central Kalimantan could attain 80% of AGB and basal area of the nearby pristine forest (Brearley et al. Reference BREARLEY, PRAJADINATA, KIDD and PROCTOR2004), suggesting that AGB accumulation in relation to a climax steady state is faster in the lowland. The rate of AGB accumulation is slightly lower than other South-East Asian montane areas. For example, in Vietnam, the secondary forest attains about 80% of AGB of an old-growth forest (241 Mg ha−1) in 60 y after slash and burn (van Do et al. Reference VAN DO, OSAWA and THANG2010). In Thailand, the 30–49-y-old secondary forest (236 Mg ha−1) attains about 93% of AGB of an uncultivated forest (254 Mg ha−1) (Fukushima et al. Reference FUKUSHIMA, KANZAKI, HARA, OHKUBO, PREECHAPANYA and CHOOCHAROEN2008). The difference in the rate of AGB accumulation among these three areas can be explained by the difference of climate, soil condition and past land use (Alves et al. Reference ALVES, SOARES, AMARAL, MELLO, ALMEIDA, FERNANDES DA SILVA and SILVEIRA1997, Saldarriaga et al. Reference SALDARRIAGA, WEST, THARP and UHL1988, Silver et al. Reference SILVER, OSTERTAG and LUGO2000).
Poorter et al. (Reference POORTER, BONGERS, AIDE, ALMEYDA ZAMBRANO, BALVANERA, BECKNELL, BOUKILI, BRANCALION, BROADBENT, CHAZDON, CRAVEN, DE ALMEIDA-CORTEZ, CABRAL, DE JONG, DENSLOW, DENT, DEWALT, DUPUY, DURÁN, ESPÍRITO-SANTO, FANDINO, CÉSAR, HALL, HERNANDEZ-STEFANONI, JAKOVAC, JUNQUEIRA, KENNARD, LETCHER, LICONA, LOHBECK, MARÍN-SPIOTTA, MARTÍNEZ-RAMOS, MASSOCA, MEAVE, MESQUITA, MORA, MUÑOZ, MUSCARELLA, NUNES, OCHOA-GAONA, DE OLIVEIRA, ORIHUELA-BELMONTE, PEÑA-CLAROS, PÉREZ-GARCÍA, PIOTTO, POWERS, RODRÍGUEZ-VELÁZQUEZ, ROMERO-PÉREZ, RUÍZ, SALDARRIAGA, SANCHEZ-AZOFEIFA, SCHWARTZ, STEININGER, SWENSON, TOLEDO, URIARTE, VAN BREUGEL, VAN DER WAL, VELOSO, VESTER, VICENTINI, VIEIRA, BENTOS, WILLIAMSON and ROZENDAAL2016) suggested that biomass recovery of Neotropical secondary forests was generally resilient and fast with a median rate of 122 Mg ha−1 after 20 y (equivalent to 3.05 MgC ha−1 y−1) although a considerable variation was apparent. Our results of biomass accumulation translate to a rate of 1.09 MgC ha−1 y−1, assuming a mean C concentration of 45% in biomass. The much slower rate of carbon accumulation in our site compared with the Neotropical median value may be related to the cooler climate and oligotrophic soil conditions of our site.
In terms of species composition, dominant species shift from early stage to later stage rather rapidly in our site. However, the species composition of our 55-y-old forest is still different from that of the old-growth forest. By contrast, several earlier studies in tropical montane areas demonstrate that dominant species of old-growth forest are already present in an early stage of secondary succession (Kappelle et al. Reference KAPPELLE, GEUZE, LEAL and CLEEF1996, van Do et al. Reference VAN DO, OSAWA and THANG2010, Reference VAN DO, OSAWA, THANG, VAN, HANG, KHANH, THAO and TUAN2011). In tropical lowland areas, on the other hand, no dominant species are shared between old-growth forests and early-stage secondary forests (Saldarriaga et al. Reference SALDARRIAGA, WEST, THARP and UHL1988). The 55-y lowland forest of Central Kalimantan, which could attain 80% of AGB, had only a 24% floristic similarity with the nearby pristine forest (Brearley et al. Reference BREARLEY, PRAJADINATA, KIDD and PROCTOR2004). It is suggested that montane forests can recover canopy-species composition much more rapidly than lowland forests (Guariguata & Ostertag Reference GUARIGUATA and OSTERTAG2001). Inherently poorer tree species richness in montane forests as compared with their lowland counterparts may be one of the reasons for the difference in the rate of recovery of species composition; there are fewer plant species available for site colonization in a montane zone and therefore the recovery of species composition is faster (Guariguata & Ostertag Reference GUARIGUATA and OSTERTAG2001). However, complete floristic recovery in our Bornean forests still requires a long time because many of the climax canopy tree species such as Fagaceae, Myrtaceae, Sapotaceae and Podocarpcapace (Aiba & Kitayama Reference AIBA and KITAYAMA1999) are completely lacking from our 55-y stands.
Effects of altitude
Plant communities are split into two types (lower vs. upper montane types bounded at 1100 m asl) in the later phase of the succession, while the pioneer communities are wide-ranging across altitudes. Why plant communities are split altitudinally only in the later phase is an intriguing question. Altitude affects plants directly through physiology and/or indirectly through soil nutrient availability. Past studies show that soil nutrient availability usually decreases with increasing altitude (Kitayama et al. Reference KITAYAMA, AIBA, MAJALAP-LEE and OHSAWA1998, Soethe et al. Reference SOETHE, LEHMANN and ENGELS2008, Tanner et al. Reference TANNER, VITOUSEK and CUEVAS1998). Indeed, soil nutrient availability, especially P, decreased and litter N and P concentrations decreased with increasing altitude in our study. We hypothesize that soil N and P deficiency becomes more severe in the later phase and interacts with altitude, which is related to the altitudinal split of plant communities; we, however, cannot suggest which nutrient (N or P) more strongly relates to the altitudinal split. Probably, we could not detect differential responses between N and P across altitudes because the range of altitudes is rather limited in our study. It should be noted that our study area corresponds to the ecotone between the lowland zone and the lower montane vegetation zone at 1200 m asl (Kitayama Reference KITAYAMA1992) and therefore a relatively rapid turnover of tree species potentially occurs at this altitude. This may be one reason why we have detected the altitudinal split in spite of the narrow range of altitudes.
The results of TWINSPAN did not show altitudinal community differentiation in the most advanced phase of the succession (i.e. old-growth forest stage). This is because we have sampled two stands only at the old-growth forest stage and both samples are located at a high altitude. This bias also explains why total AGB increases with increasing altitude in our multiple regression, although decreasing AGB with altitude is a general pattern (Kitayama & Aiba Reference KITAYAMA and AIBA2002).
Synthesis
Plant communities shift with stand age probably through the interplay of light and soil nutrient availabilities. At the onset of secondary succession, burning causes flushes of NO3-N and other minerals originating from the burnt plants in soils and provides plants with relatively rich nutrients. Under such a high nutrient status, herbaceous/shrub plant communities occur across altitudes (Huber Reference HUBER2006). Soil nutrients (particularly P) become gradually poorer with age and P-use efficient species replace those of less efficient species in the later phase of succession. At the same time, altitude appears to affect the vegetation in the later phase and plant communities split into two altitudinal zones.
AGB accumulates steadily at the rate of 2.42 Mg ha−1 y−1 during the succession for the first 55 y due to the ontogenetic development of plants as well as community shifts. If we extrapolate this rate to predict a longer successional pattern, AGB saturates within 120 y only (becomes an asymptotic state of a climax stage; i.e. 294 Mg ha−1 in a nearby forest; Aiba & Kitayama Reference AIBA and KITAYAMA1999). The secondary forests will, however, need a much longer time to fully recover to a state equivalent to the original vegetation in terms of species composition.
ACKNOWLEDGEMENTS
We are thankful to Ms Rimi Repin for supporting our field survey, and Alim Biun, Dolois Sumbin and Dr John Baptist Sugau for supporting species identification. This research was funded by a research grant from Mitsui & Co., Ltd (R11-G4-1014) to K. Kitayama.
The relationships between ages and altitudes of 25 stands in the upland area between the Kinabalu Park and the Crocker Range Park in Sabah, northern Borneo. There was no significant relationship between the sampled stand age and altitude.

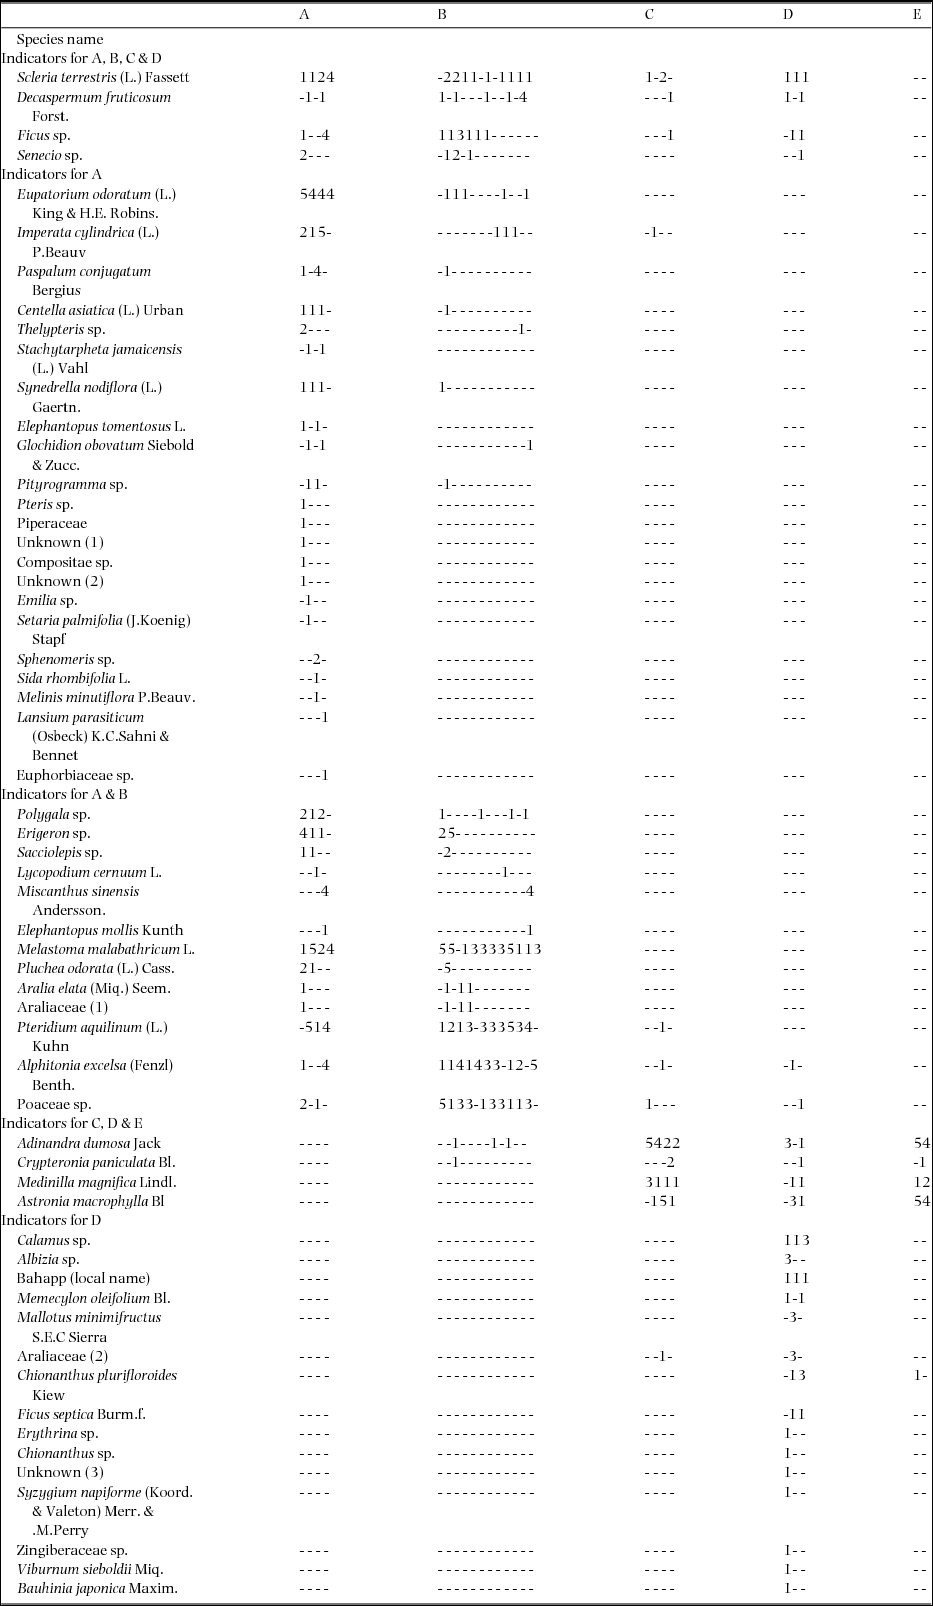
Plant communities, and indicator species differentiated by TWINSPAN. A–E represents five plant communities derived from the 25 stands in the upland area between the Kinabalu Park and the Crocker Range Park in Sabah, northern Borneo. Each entry represents a cover class (5, 20–100%; 4, 10–19%; 3, 5–9%; 2, 2–4%; and 1, < 1%). (A) herbaceous community, (B) shrub community, (C) upper montane short forest community, (D) lower montane short forest community, and (E) forest community.
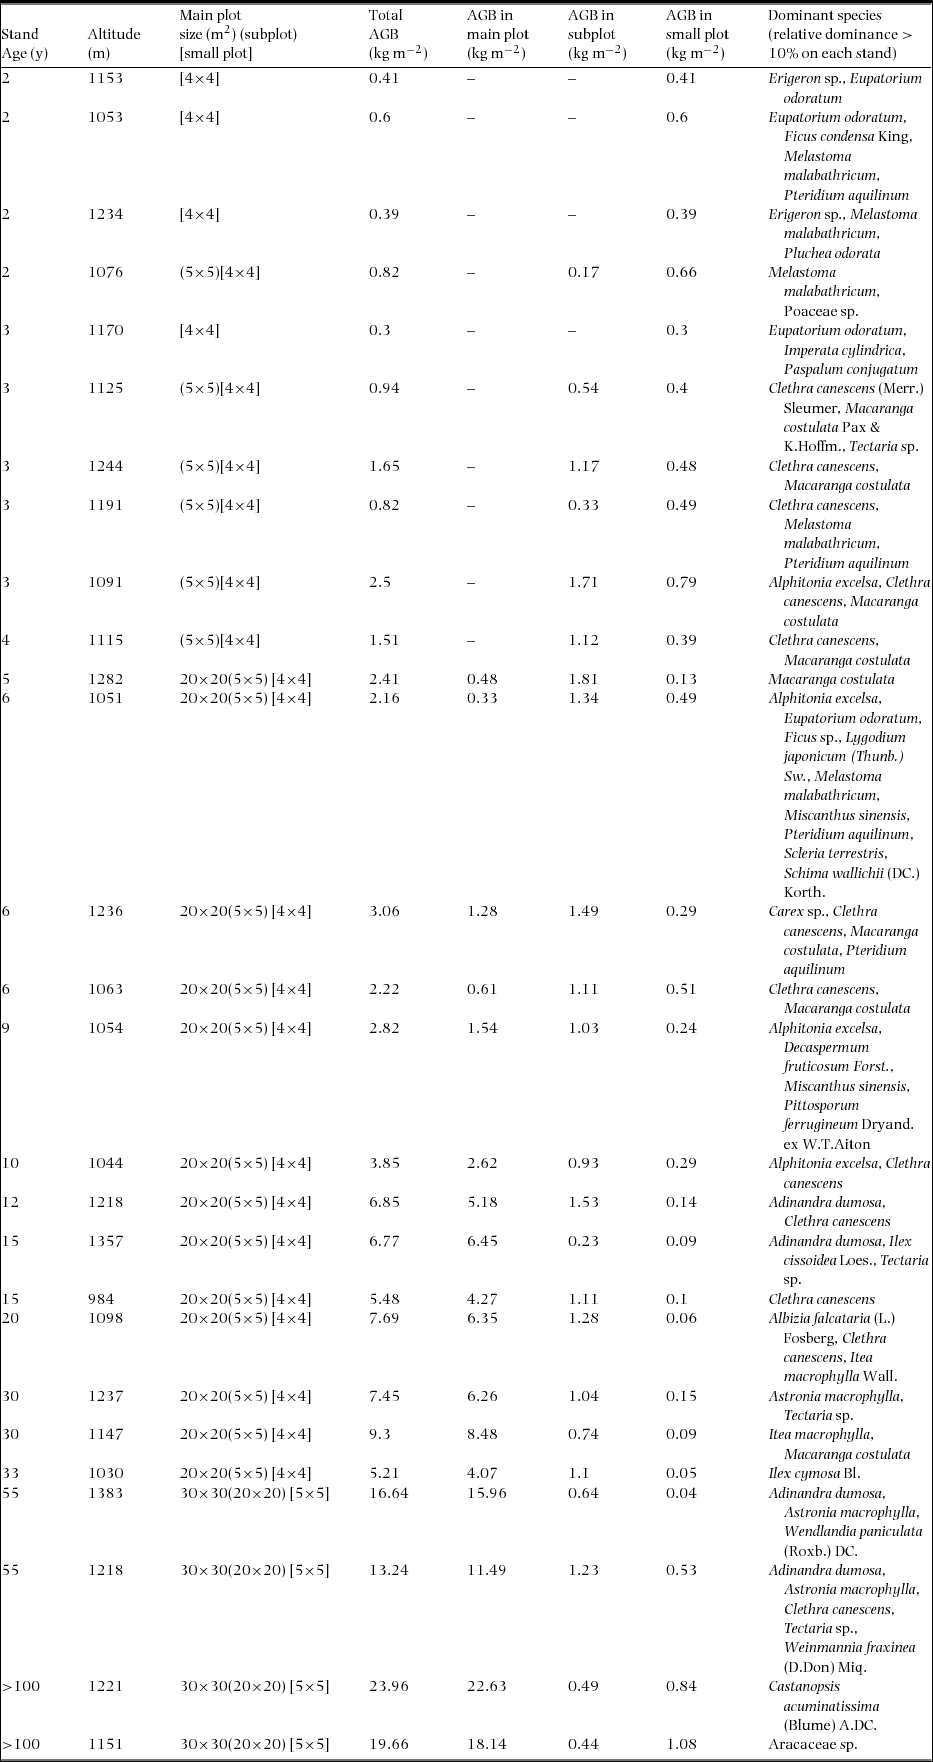
Description of stand age, altitude and AGB and dominant species in each of the 27 vegetation stands in the upland area between the Kinabalu Park and the Crocker Range Park in Sabah, northern Borneo. In main plot, AGB is measured for trees ≥ 5 cm dbh (age < 50 y), and for trees ≥ 20 cm dbh (age > 50 y). In subplot, AGB is measured for trees 5 cm > and ≥ 1 cm dbh (age < 50 y), and for trees 20 cm > and ≥ 5 cm dbh (age > 50 y). In small plot, AGB is measured for grasses or trees < 1 cm dbh (age < 50 y), and for trees 5 cm > and ≥ 1 cm dbh (age > 50 y). The two oldest stands (which are presumably older than 100 y) were not included in the vegetation analyses with TWINSPAN and DCA due to their unknown ages.
The relationship between the concentrations of soil total P and stand ages of 26 stands in the upland area between the Kinabalu Park and the Crocker Range Park in Sabah, northern Borneo for the top 0–5 cm (a) and sub-surface 5–15 cm (b) soil layer. Dashed lines indicate non-significant (P > 0.05) regression lines.

Species diversity (species richness and Shannon–Wiener diversity), soil properties (0–15 cm) and litter nutrients data (N, P, N:P ratio) in one young stand just after slash and burn and two old stands (age > 100 years). These three stands were not included in the vegetation analyses with TWINSPAN and DCA.
Soil chemical properties of 28 stands in the upland area between the Kinabalu Park and the Crocker Range Park in Sabah, northern Borneo. Soil properties include pH (H2O), and concentrations of organic-C, total-N, inorganic N (NH4-N and NO3-N) and total-P on an oven-dry weight basis for the top 0–5 cm and 5–15 cm; values are means ± SD.
The relationship between foliar nutrients (N, P and N:P ratio) and stand ages (left side) and altitudes (right side). Foliar N vs. stand age (a) and altitude (b), foliar P vs. stand age (c) and altitude (d), foliar N:P ratio vs. stand age (e) and altitude (f). Solid and dashed lines indicate significant (P < 0.05) and non-significant regression lines respectively.

The relationship between litter nutrients (N, P and N:P ratio) and stand ages (left side) and altitudes (right side) of 25 stands in the upland area between the Kinabalu Park and the Crocker Range Park in Sabah, northern Borneo. Litter N vs. stand age (a) and altitude (b), litter P vs. stand age (c) and altitude (d), litter N:P ratio vs. stand age (e) and altitude (f). Solid and dashed lines indicate significant (P < 0.05) and non-significant regression lines respectively.