Introduction
Magnetite is a common mineral in various Fe–Cu deposits, which contain a variety of minor and trace elements such as Al, Si, Ca, Mg, Mn, Ti, V, Cr and Ni. The composition of magnetite has been used widely as a petrogenetic indicator (Dare et al., Reference Dare, Barnes, Beaudoin, Méric, Boutroy and Potvin-Doucet2014; Nadoll et al., Reference Nadoll, Angerer, Mauk, French and Walshe2014) and to discriminate various deposit types or ore-forming processes (Carew Reference Carew2004; Singoyi et al., Reference Singoyi, Danyushevsky, Davidson, Large and Zaw2006; Rusk et al., Reference Rusk, Oliver, Brown, Lilly and Jungmann2009; Dupuis and Beaudoin, Reference Dupuis and Beaudoin2011; Dare et al., Reference Dare, Barnes and Beaudoin2012; Nadoll et al., Reference Nadoll, Mauk, Hayes, Koenig and Box2012; Knipping et al., Reference Knipping, Bilenker, Simon, Reich, Barra, Deditius, Lundstrom, Bindeman and Munizaga2015a,Reference Knipping, Bilenker, Simon, Reich, Barra, Deditius, Wälle, Heinrich, Holtz and Munizagab; Huang et al., Reference Huang, Zhou, Qiu and Qi2015a,Reference Huang, Gao, Qi and Zhoub, 2016; Hu et al., Reference Hu, Chen, Zhao, Han and Xia2017; Alaminia et al., Reference Alaminia, Tadayon, Finger, Lentz and Waitzinger2020). Recent studies (e.g. Hu et al., Reference Hu, Li, Lentz, Ren, Zhao, Deng and Hall2014, Reference Hu, Lentz, Li, McCarron, Zhao and Hall2015; Wen et al., Reference Wen, Li, Hofstra, Koenig, Lowers and Adams2017; Yin et al., Reference Yin, Ma and Robinson2017; Huang et al., Reference Huang, Zhou, Beaudoin, Gao, Qi and Lyu2018; Hu et al., Reference Hu, Chen, Beaudoin and Zhang2020) have shown that combined textural and compositional studies are necessary before using these magnetite data for provenance and petrogenetic purposes.
Magnetite in Fe–Cu deposits usually has two crystal habits, i.e. platy and granular (Huang et al., Reference Huang, Qi and Meng2014; Apukhtina et al., Reference Apukhtina, Kamenetsky, Ehrig, Kamenetsky, Maas, Thompson, McPhie, Ciobanu and Cook2017). Platy magnetite is commonly considered to be ‘mushketovite’, i.e. formed by replacement of hematite. Previous studies usually considered platy and granular magnetite as the same type and used their compositional data to discuss their genesis and distinguish different deposit types (Günther et al., Reference Günther, Klemd, Zhang, Horn and Weyer2017; Felipe et al., Reference Felipe, Fanlo, Mateo and Subias2014). However, whether the same mechanism is responsible for these two types of magnetite remains unknown.
The Duotoushan deposit is an important Fe–Cu deposit in the Aqishan–Yamansu metallogenic belt of eastern Tianshan, NW China. A number of studies has been carried out since its discovery in the 1970s. The genesis of this deposit remains controversial. Jia and Zhao (Reference Jia and Zhao2017) suggested that the Duotoushan deposit is a medium–high-temperature hydrothermal magnetite deposit characterised by fracture infill, while Zhang et al. (Reference Zhang, Chen, Peng, Zhao, Lu, Zhang, Yang and Sun2018) concluded, based on the mineralogy, paragenesis and fluid-inclusion studies, that it is similar to the Central Andean iron oxide–copper–gold (IOCG) deposits. Both platy and granular magnetite are common and constitute the major orebody at Duotoushan (Zhang et al., Reference Zhang, Chen, Peng, Zhao, Lu, Zhang, Yang and Sun2018).
In the present investigation, textural and compositional data of two types of magnetite from the Duotoushan deposit are presented. The data are used to discuss the factors controlling the magnetite composition and the links between this and the texture. The origins of the two magnetite types and implications for genesis of the Duotoushan and other similar Fe–Cu deposits are discussed.
District and deposit geology
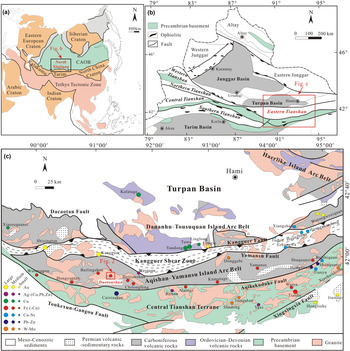
Eastern Tianshan, located between the Tarim and Junggar blocks in north Xinjiang, is an important part of the Central Asian Orogenic Belt (Fig. 1a,b). The Central Asian Orogenic Belt is a tectonic collage of ophiolite suites, magmatic arc remnants, Precambrian massifs and accretionary terranes (Windley et al., Reference Windley, Allen, Zhang, Zhao and Wang1990; Sengör et al., Reference Sengör, Natal'In and Burtman1993; Sengör and Natal'in, Reference Sengör, Natal'in, Yin and Harrison1996) formed from the Carboniferous to Early Triassic collisions among the Siberia and Tarim–Sino–Korean plates along the Solonker suture (Chen et al., Reference Chen, Ni, Fan, Pirajno, Lai, Su and Zhang2007, Reference Chen, Zhai and Jiang2009, Reference Chen, Pirajno, Wu, Qi and Xiong2012; Xiao et al., Reference Xiao, Huang, Han, Sun and Li2010). Eastern Tianshan is divided into the Dananhu–Tousuquan Island Arc Belt, the Kangguer Shear Zone, the Aqishan–Yamansu Island Arc Belt and the Central Tianshan Terrane (from north to south) by nearly E–W-trending faults (Fig. 1c). The Aqishan–Yamansu Island Arc Belt is considered to be one of the most important Fe (–Cu) belts in NW China and hosts numerous high-grade Fe deposits (>45% total Fe), e.g. the Hongyuntan, Bailingshan, Duotoushan and Shaquanzi deposits (Wang et al., Reference Wang, Li, Chen and Liu2005, Reference Wang, Wang and He2006; Zhang et al., Reference Zhang, Sun, Hu, Ji and Chen2012; Huang et al., Reference Huang, Qi, Gao and Zhou2013; Hou et al., Reference Hou, Zhang, Santosh, Encarnacion, Zhu and Luo2014).
Geological map showing the main units in the Eastern Tianshan area and location of the Duotoushan Fe–Cu deposit in the Tugutublak Formation. (a) Location of the Central Asian Orogenic belt (CAOB). (b) Location of Eastern Tianshan. (c) Location and major tectonic units in Eastern Tianshan. (Fig. 1a modified after Sengör and Natal'in (Reference Sengör, Natal'in, Yin and Harrison1996); Fig. 1b simplified after Chen et al. (Reference Chen, Pirajno, Wu, Qi and Xiong2012); Fig. 1c modified after Wang et al. (Reference Wang, Wang and He2006) and Deng et al. (Reference Deng, Wang, Wang, Li, Fang and Mao2014).)

The stratigraphy in the Duotoushan Fe–Cu deposit consists of the Upper Carboniferous Tugutublak Formation composed principally of andesitic–dacitic lava/breccias (Fig. 2). The Tugutublak volcanic–sedimentary rocks were intruded by granodiorite, granite porphyry, monzogranite, and dacite porphyry. These are predominantly located in the eastern-, western- and southwestern parts of the Duotoushan deposit. There are at least two sub-parallel faults (E–W-trending) in this deposit (Sang et al., Reference Sang, Peng and Guo2003; Fig. 2).
Geological map of the Duotoushan Fe–Cu deposit (modified from Sang et al., Reference Sang, Peng and Guo2003).

The ore bodies of the Duotoushan Fe–Cu deposit are mostly stratabound and mainly hosted in the andesitic tuff breccias. Previous exploration reported seven stratabound bodies in the deposit. These ore bodies are 50–248 m long and 4–70 m wide, with average ore grade of 45 wt.% Fe. The copper grade in some ore bodies can be up to 0.7–1.0 wt.% (Sang et al., Reference Sang, Peng and Guo2003). According to the Xinjiang Bureau of Geology and Mineral Resources, the Duotoushan is classified as a medium-sized Fe deposit (usually >0.1 Mt in China), although no ore reserve data have been published (Sang et al., Reference Sang, Peng and Guo2003).
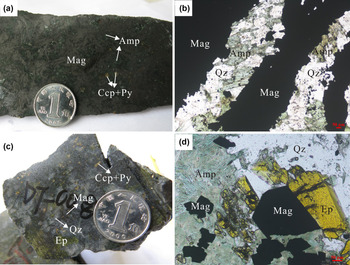
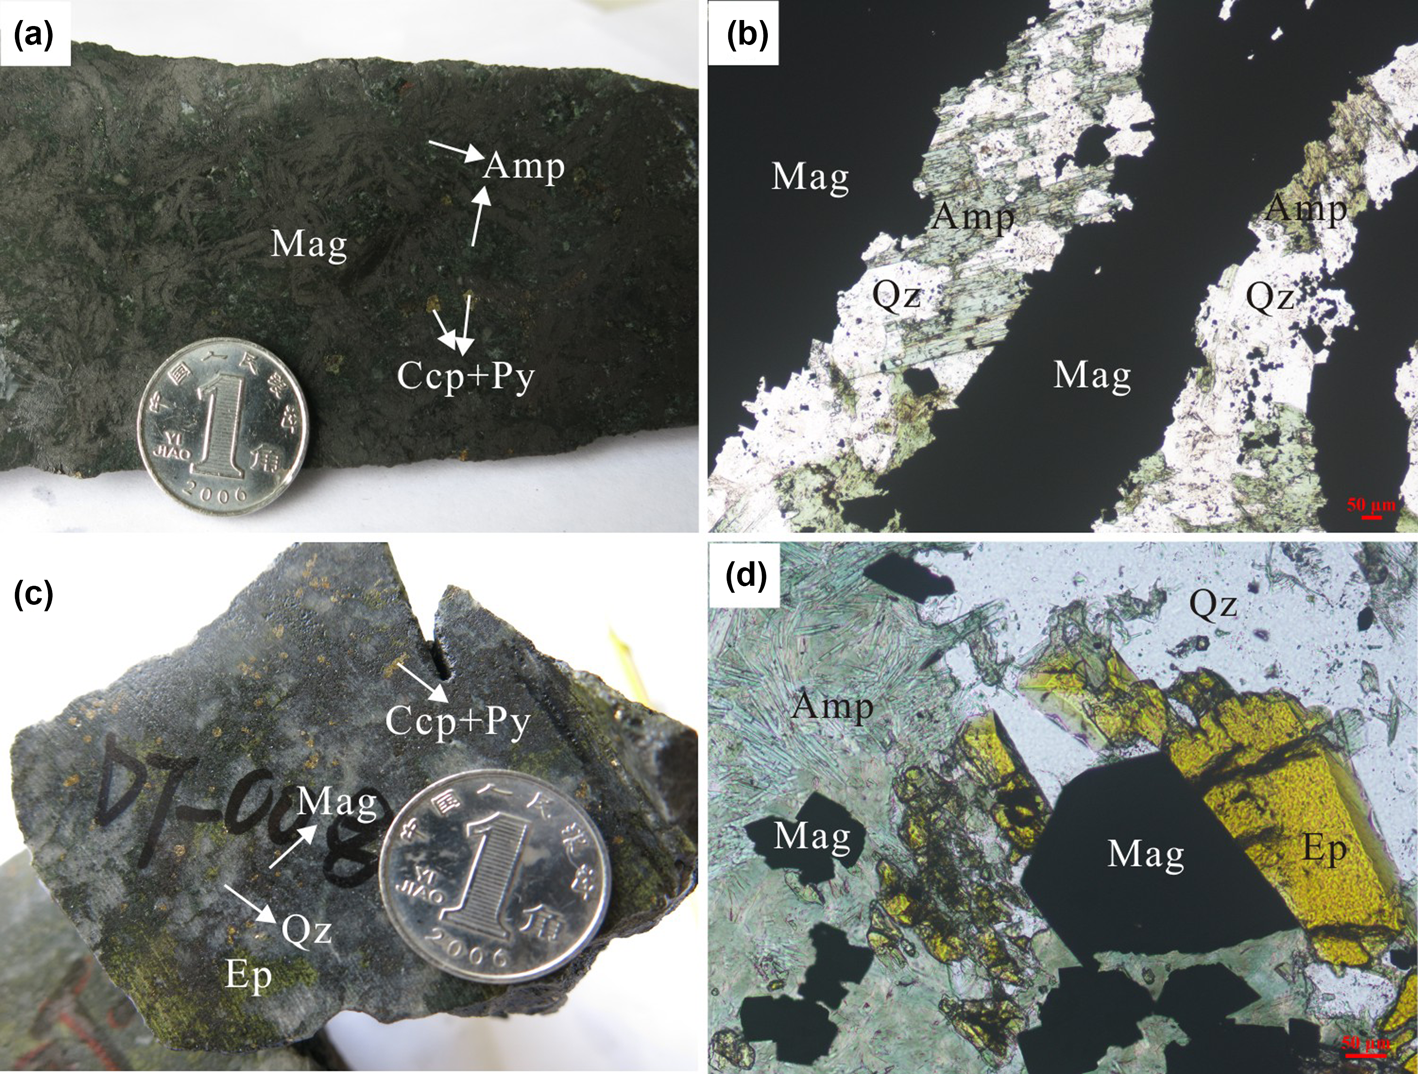
Five stages of alteration and mineralisation were identified at Duotoushan based on detailed petrological studies, including: (I) albite–amphibole stage; (II) garnet–clinopyroxene stage; (III) magnetite mineralisation stage; (IV) sulfide stage; and (V) late veins stage (Zhang et al., Reference Zhang, Chen, Peng, Zhao, Lu, Zhang, Yang and Sun2018). The albite–amphibole stage contains abundant albite and minor amphibole. The coarse pink albite and dark-grey amphibole are usually crosscut by magnetite (Zhang et al., Reference Zhang, Chen, Peng, Zhao, Lu, Zhang, Yang and Sun2018). The garnet–clinopyroxene stage contains major light brown to yellowish-green garnet with minor clinopyroxene, which were partially or entirely replaced by amphibole, epidote and magnetite (Zhang et al., Reference Zhang, Chen, Peng, Zhao, Lu, Zhang, Yang and Sun2018). Stage III is the main stage associated with magnetite at Duotoushan. This stage can be divided into two sub-stages of different mineral assemblages (stage III-A and stage III-B) and correspond to two different types of magnetite. One is platy magnetite in stage III-A which coexists with amphibole, pyrite and chalcopyrite (Fig. 3a). Platy magnetite is commonly intergrown with amphibole replaced by quartz (Fig. 3b), which may indicate broadly coeval formation. Another is euhedral granular magnetite in stage III-B which coexists with epidote, quartz, amphibole, pyrite and chalcopyrite (Figs. 3c). Granular magnetite usually has a straight boundary with epidote and quartz, indicating simultaneous formation (Figs. 3d). The minerals in the sulfide stage are mainly pyrite and chalcopyrite. Pyrite-rich veins crosscutting stage-III magnetite suggest that the sulfide stage is later than the magnetite stage (Zhang et al., Reference Zhang, Chen, Peng, Zhao, Lu, Zhang, Yang and Sun2018). The late-veins stage consist of mainly quartz and calcite veins which cross-cut early-stage minerals.
Photographs of magnetite from the Duotoushan deposit. (a) Platy magnetite ore, contains mainly magnetite, amphibole and a small amount of pyrite and chalcopyrite; (b) platy magnetite intergrown with amphibole; amphibole is replaced by quartz; (c) granular magnetite ore, contains mainly epidote, quartz, pyrite and chalcopyrite; (d) granular magnetite closely associated with epidote and quartz. Mineral abbreviations (from Whitney and Evans, Reference Whitney and Evans2010): Mag: magnetite, Amp: amphibole, Qz: quartz, Ccp: chalcopyrite, Py: Pyrite, Ep: epidote.
Sampling and analytical methods
Representative samples of two different types of magnetite from stage III were selected for the investigation.
Polished thin sections were carbon-coated and then investigated using a ΣIGMA scanning electron microscope (SEM) in back-scattered electron (BSE) mode at the Sun Yat-sen University, Guangzhou, China. The in situ micro-XRD analyses were conducted using a Rigaku D/max Rapis IIR micro-XRD system at the Central South University, Changsha, China. All analyses were carried out at 40 kV and 250 mA (CuKα) with exposure times of 22 min. The X-ray beam was ~40 μm in diameter and was focused on the selected spots on the thin sections. The compositions of magnetite were analysed using a JEOL JXA-8230 electron probe micro-analyser (EPMA) at Southwest Petroleum University. The analyses were carried out at 15 kV, 20 nA beam current and 1 μm spot size. Peak counting times ranged from 20 s to 60 s for various elements. The standards used were: magnetite (Fe); almandine garnet (Si,Mg); diopside (Ca); pyrope garnet (Al); rhodonite (Mn); Ni metal; V metal; rutile (Ti); and synthetic Cr2O3 (Cr). In addition, zoning in magnetite grains was mapped for Fe, Si, Ca and Al, using an accelerating voltage of 20 kV, a probe current of 300 nA, and a beam size of 2 μm. Fe was analysed using a LIF crystal. Si and Al were analysed using a TAP crystal. Ca was analysed using a PET crystal. The dwell time for each point was 100 ms.
Results
Morphology and texture of magnetite
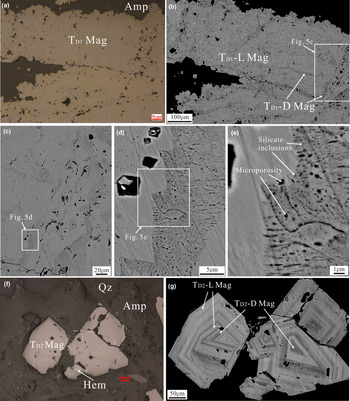
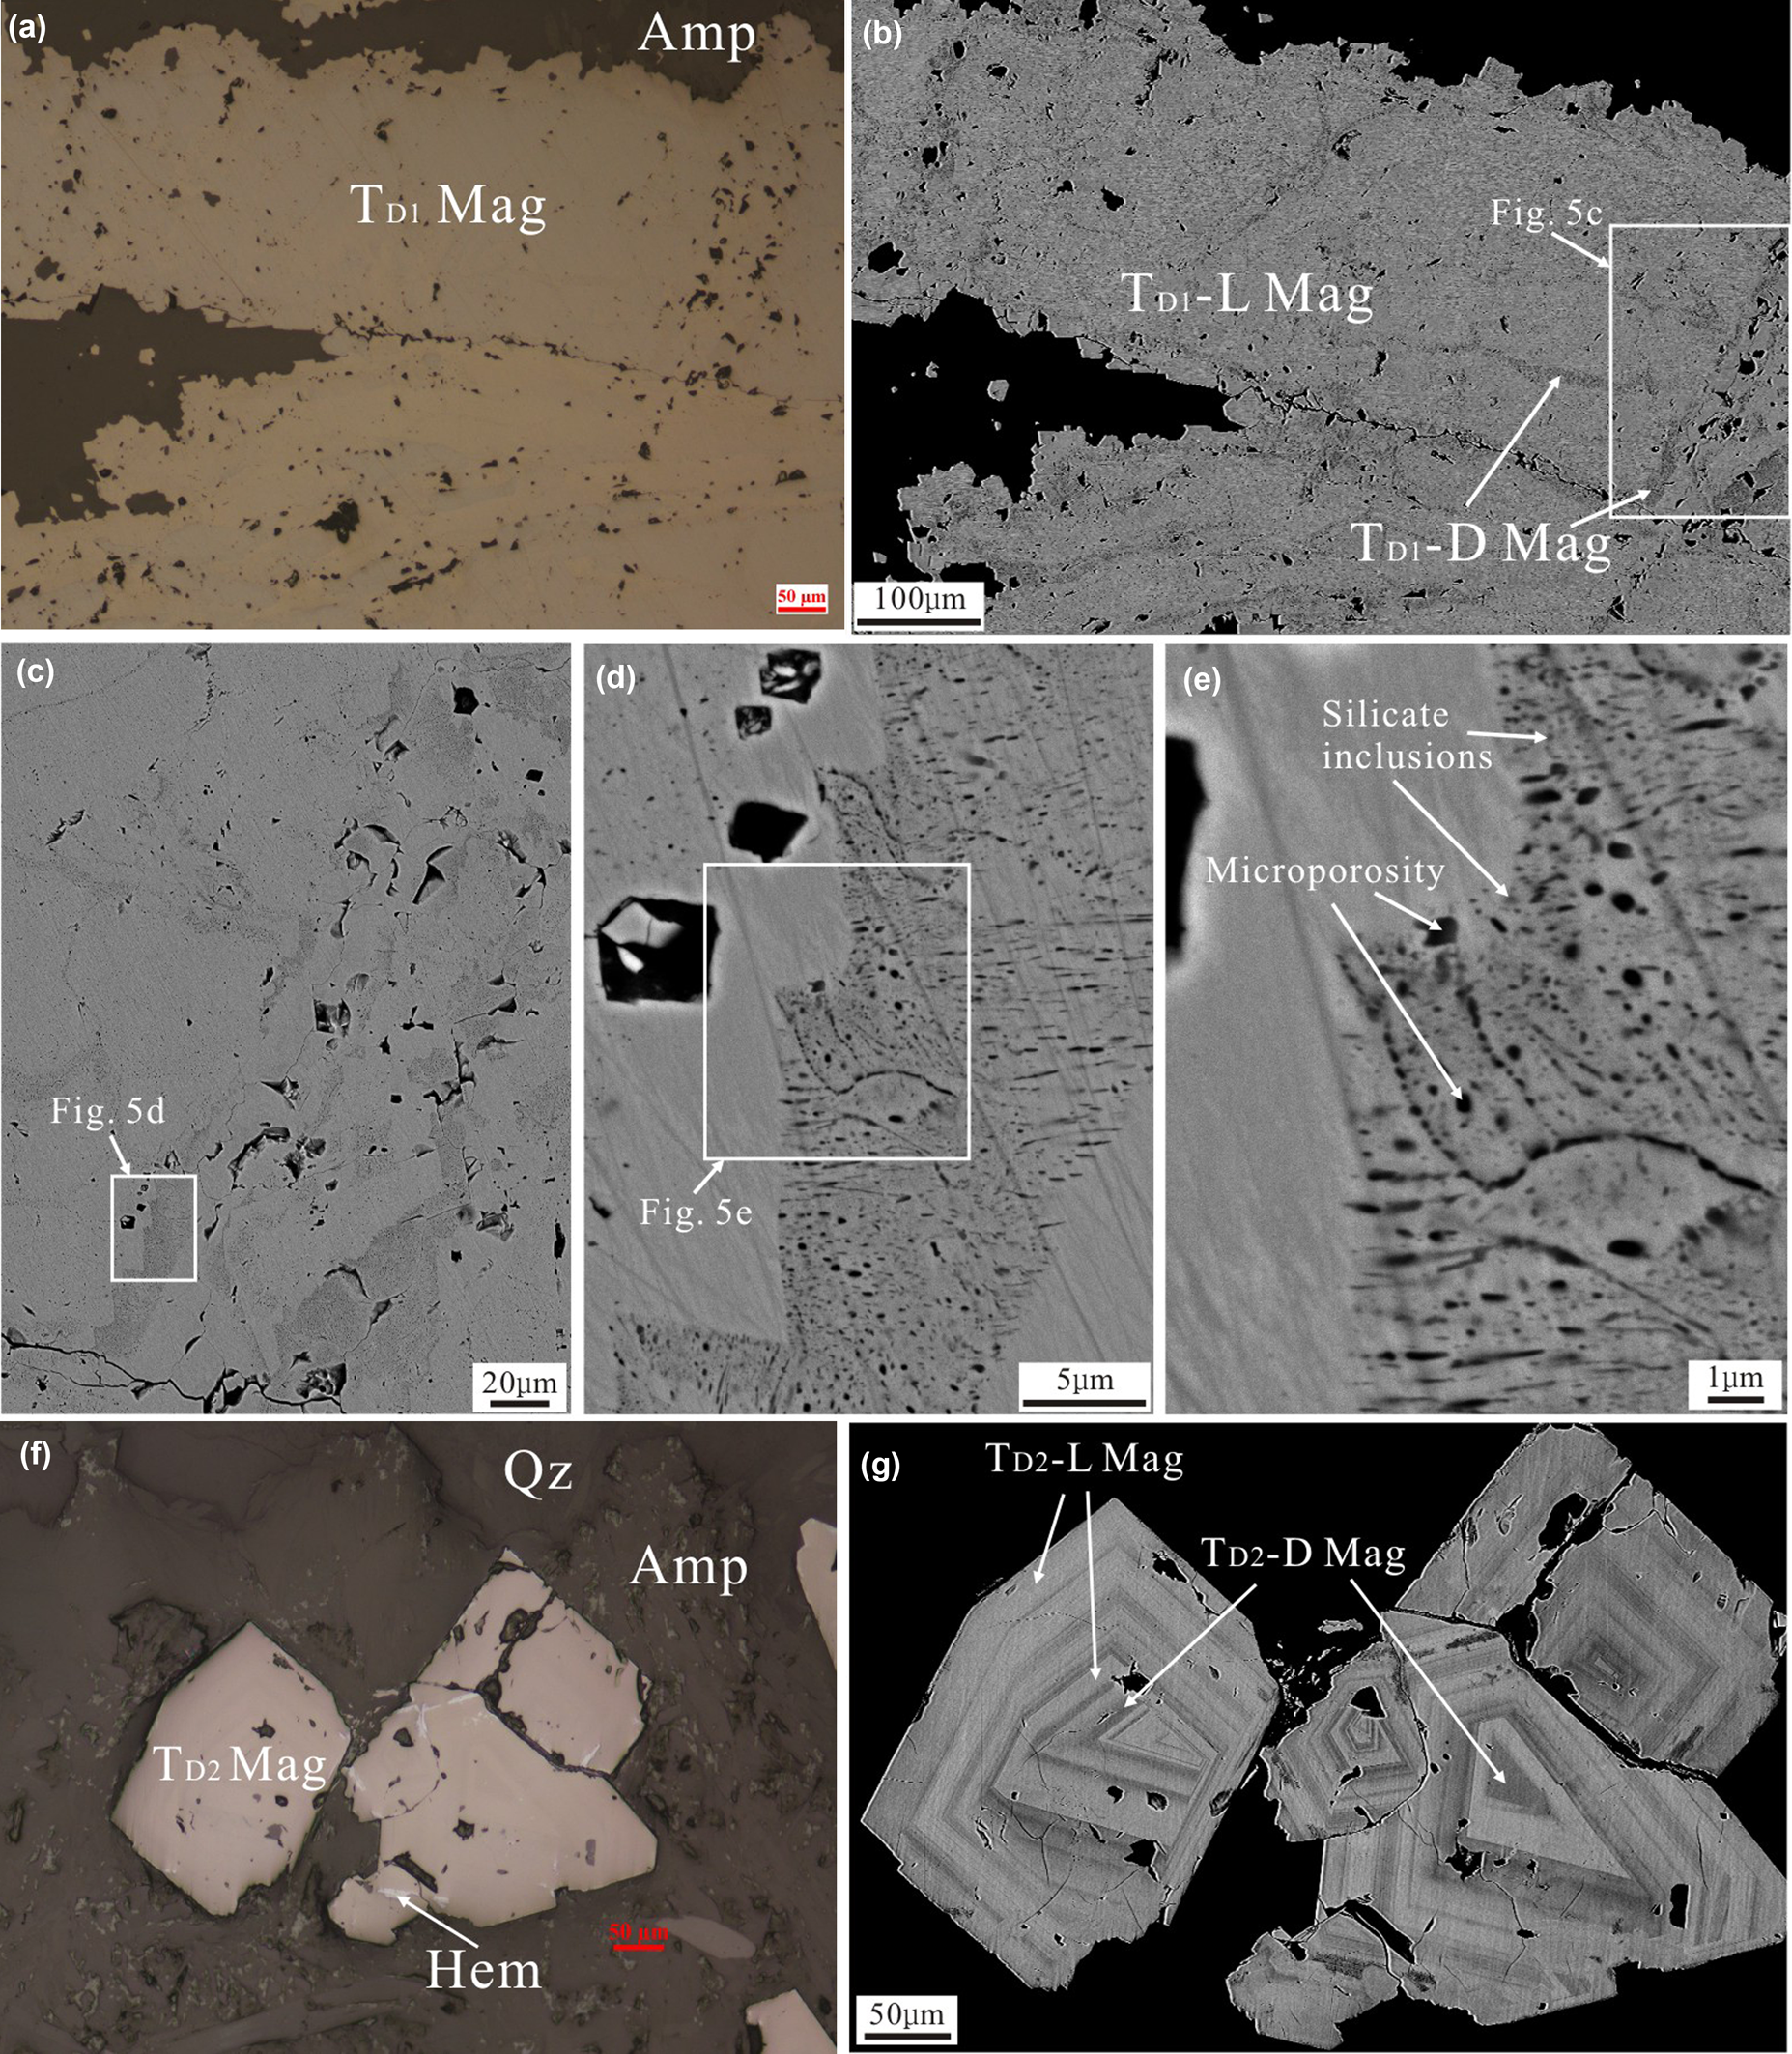
Magnetite in the Duotoushan deposit can be classified into platy (TD1 Mag) and granular (TD2 Mag) types. The TD1 magnetite is commonly intergrown with amphibole (Figs 3b, 4a). It shows two different zones (bright and dark) based on observation by SEM (Fig. 4b). The bright zone (TD1-L Mag) is the main part of the TD1 magnetite and is free of inclusions, whereas the dark part (TD1-D Mag) contains abundant porosity and tiny silicate inclusions (Fig. 4c–e). The TD2 magnetite usually coexists with epidote, quartz and amphibole and was replaced locally by hematite (Figs 3d, 4f). It is commonly euhedral with obvious oscillatory zoning in the BSE images (Fig. 4g).
Photomicrographs (a, f) and BSE images (b–e, g) of the Duotoushan magnetite. (a) Photomicrograph of platy magnetite (TD1 Mag). (b–e) BSE images of platy magnetite, which shows different zones. The TD1-L magnetite is the bright domain. The TD1-D magnetite is the dark domain with abundant microporosity and silicate inclusions. (f) Photomicrograph of granular magnetite (TD2 Mag). (g) BSE image of platy magnetite, which shows obvious oscillatory zones. Mineral abbreviations (from Whitney and Evans, Reference Whitney and Evans2010): Mag: magnetite, Amp: amphibole; Qz: quartz; Hem: hematite.
XRD patterns of magnetite
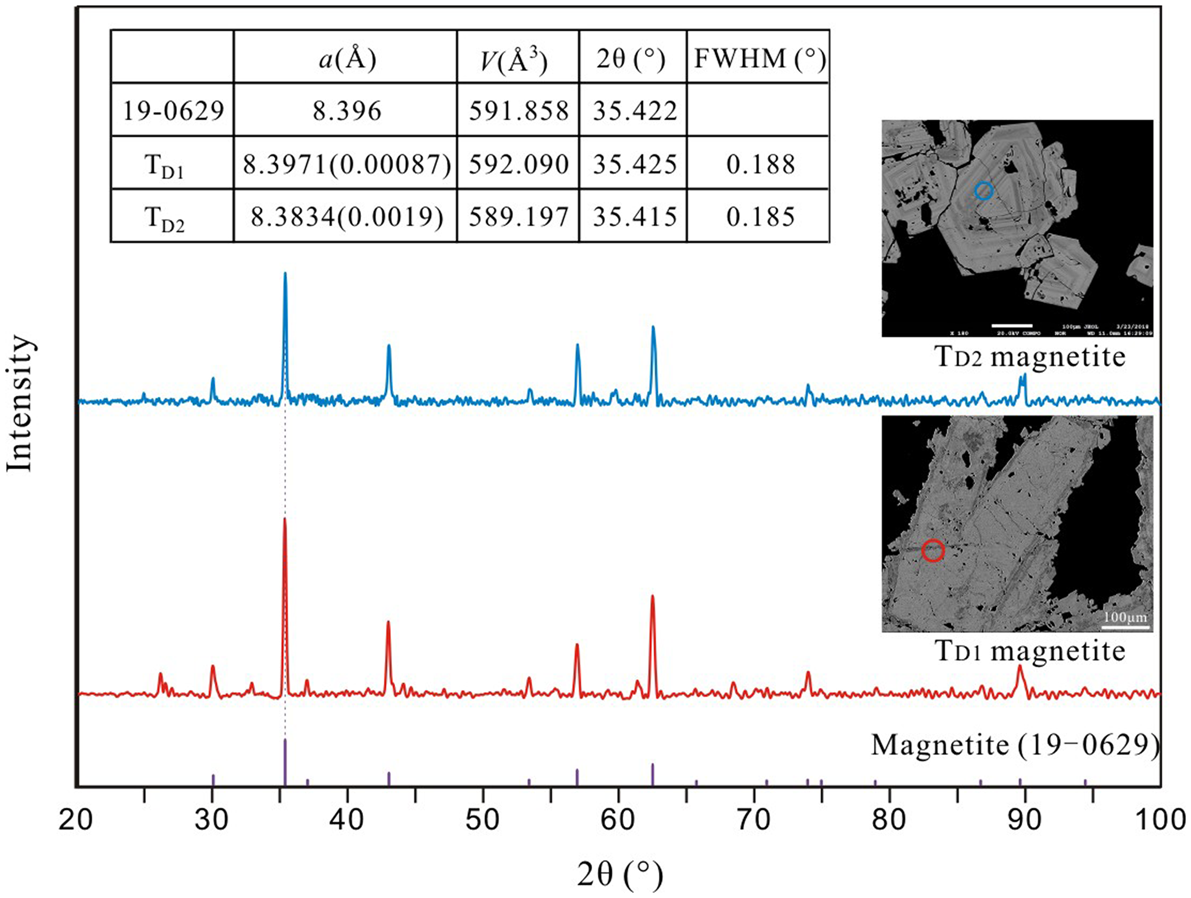
The XRD data for Duotoushan magnetite are presented in the Supplementary Data Table A1. The XRD pattern of the TD1 magnetite has a cell parameter of a = 8.397(1) Å, identical to the standard magnetite (Footnote *PDF No. 19-0629, a = 8.396 Å). The strong intensity, small cell parameter, together with the sharp 2θ of the {311} peak of full-width at half maximum (FWHM) of 0.188° (Fig. 5) indicate that it is well crystallised. The cell parameter of the TD2 magnetite is a = 8.383(4) Å, which is less than both the TD1 magnetite and the standard magnetite. The intensity and the 2θ of {311} peak (FWHM = 0.185°) is similar to that of the TD1 magnetite (Fig. 5).
In situ XRD patterns of magnetite from the Duotoushan deposit compared with the standard magnetite (19-0629). The circles are 40 μm in diameter and represent the test area.
Composition of magnetite
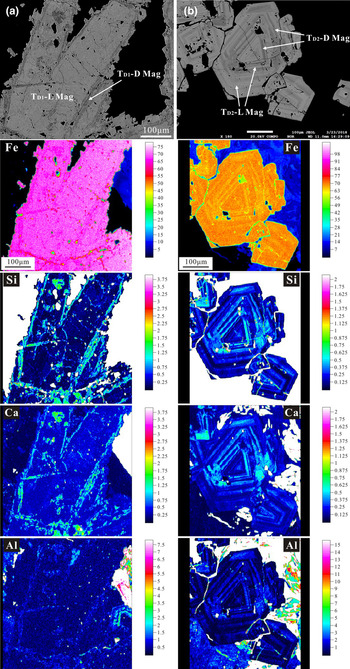
Electron microprobe analysis elemental mapping provided information on major- and trace-element distribution patterns within individual TD1 and TD2 magnetite crystals from the Duotoushan deposit (Fig. 6). The dark zones of TD1 magnetite are characterised by larger amounts of Si, Ca, Al and smaller Fe contents than the bright zones (Fig. 6a). The TD2 magnetite displays similar variations to that of the TD1 magnetite in which the dark domain of magnetite contains more Si, Ca, Al and less Fe than the bright domain (Fig. 6b).
X-ray compositional mapping of selected elements in different types of magnetite from the Duotoushan deposit: (a) platy magnetite; (b) granular magnetite; colour scale is in weight percent.

Representative compositions of the Duotoushan magnetite are presented in Table 1 (extensive data are presented in Supplementary Data Table A2). The platy magnetite from the Duotoushan Fe–Cu deposit forms two compositional groups, corresponding to the bright (TD1-L magnetite) and dark (TD1-D magnetite) domains (Fig. 7). The TD1-L magnetite contains less SiO2 (0.113–0.306 wt.%), CaO (below the detection limits), MgO (0.01–0.024 wt.%), Al2O3 (0.035–0.052 wt.%), Cr2O3 (<0.01–0.021 wt.%) and more total-FeO (92.268–93.433 wt.%), whereas the TD1-D magnetite contains significantly more SiO2 (2.267–3.433 wt.%), CaO (0.222–0.648 wt.%), MgO (0.011–0.288 wt.%,), Al2O3 (0.096–0.338 wt.%), Cr2O3 (0.015–0.032 wt.%) and less total-FeO (88.518–91.011 wt.%). In addition, The TD1-L magnetite has contains similar amounts of MnO (0.036–0.069 wt.%) and slightly less TiO2 (<0.01–0.025 wt.%) than TD1-D magnetite (0.044–0.076 wt.%, <0.01–0.03 wt.%, respectively). Most of the V2O3 and NiO contents of the platy magnetite are below the detection limits.
Box and whisker plots for minor- and trace-element concentrations in magnetite from the Duotoushan deposit. The whiskers represent the minimum and maximum values. The element concentrations below detection limits were excluded from the box and whisker plots.

Mean, minimum and maximum contents (wt.%) for magnetite from the Duotoushan deposit.

n = Number of analyses; b.d.l. = below detection limit
The granular magnetite also contains two compositional groups (Fig. 7). The TD2-L magnetite contains less SiO2 (0.158–1.249 wt.%), CaO (below the detection limit), MgO (<0.01–0.035 wt.%), Al2O3 (<0.017–0.253 wt.%, average: 0.064 wt.%), MnO (0.027–0.094 wt.%), TiO2 (<0.01–0.042 wt.%) and more total FeO (91.547–93.314 wt.%), than TD2-D magnetite which contains more SiO2 (0.984–3.207 wt.%), CaO (0.03–0.644 wt.%), MgO (0.018–0.137 wt.%), Al2O3 (0.221–0.714 wt.%), MnO (0.049–0.135 wt.%), TiO2 (<0.014–0.175 wt.%) and less total-FeO (87.860–91.358 wt.%). The TD2-L magnetite contains similar amounts of Cr2O3 (<0.01–0.032 wt.%) and V2O3 (<0.01–0.023 wt.%) to TD2-D magnetite (<0.01–0.044 wt.%, <0.01–0.025 wt.%, respectively). The NiO contents of the granular magnetite are mostly below the detection limit.
Discussion
Element-substitution mechanisms for magnetite
Magnetite has an inverse spinel structure with the formula Fe2+Fe3+2O4, where tetrahedral sites are occupied exclusively by Fe3+ and octahedral sites are occupied randomly by unequal numbers of Fe3+ and Fe2+ (Lindsley, Reference Lindsley and Rumble1976; Wechsler et al., Reference Wechsler, Lindsley and Prewitt1984; Nadoll et al., Reference Nadoll, Angerer, Mauk, French and Walshe2014). Nadoll et al. (Reference Nadoll, Angerer, Mauk, French and Walshe2014) concluded that divalent cations such as Ca2+, Mg2+, Mn2+, Zn2+ and Ni2+ can enter into the magnetite lattice by substituting for Fe2+, whereas some trivalent cations such as Al3+, V3+ and Cr3+ enter by replacing Fe3+. In addition, some tetravalent cations, such as Si4+ and Ti4+, can also enter into the magnetite structure when substitution is coupled with a divalent cation (Newberry et al., Reference Newberry, Peacor, Essene and Geissman1982; Wechsler et al., Reference Wechsler, Lindsley and Prewitt1984; Westendorp et al., Reference Westendorp, Watkinson and Jonasson1991; Xu et al., Reference Xu, Shen and Konishi2014).
In the present investigation, the lattice parameter of the TD1 magnetite (8.397 Å) is almost equal to that of the standard magnetite (8.396 Å, Fukasawa et al., Reference Fukasawa, Iwatsuki and Furukawa1993), whereas the equivalent value for TD2 magnetite (8.383 Å) is significantly less than the standard magnetite. For TD2 magnetite (including TD2-L and TD2-D) the negative correlations of Fe3+ with Si4+, Fe2+, Al3+, Ca2+ (Fig. 8a, c, d, e) and the positive correlation between Fe2+ and Si4+ (Fig. 8b) might indicate that these elements entered the intracrystalline sites of magnetite by the following substitutions:
 $$^{\rm {IV} } {\rm S}{\rm i}^{4 + } + ^{\rm }\left( {{\rm F}{\rm e}^{2 + },{\rm }{\rm C}{\rm a}^{2 + }} \right)\,\to \,^{\rm {IV} }\!\!{\rm F}{\rm e}^{3 + } + ^{\rm }{\rm F}{\rm e}^{3 + }$$
 $$^{\rm {IV}\!\!} {\rm A}{\rm l}^{3 + }\to \,^{\rm {IV}\!\!\!}{\rm F}{\rm e}^{3 + }$$
In these substitutions, the smaller ionic radii of ⅣSi4+ and ⅣAl3+ than of ⅣFe3+ (0.26 Å, 0.39 Å and 0.49 Å, respectively; Shannon, Reference Shannon1976) can result in the lattice parameter of TD2 magnetite in Duotoushan being less than that of standard magnetite. The TD1-L magnetite which is the main TD1 magnetite, contains the smallest concentrations of these cations and shows no obvious correlations, indicating that little substitution has occurred in the TD1 magnetite. In addition, because we haven't made a further observation on a nanoscale, the possibility that these correlations between Fe and other elements may be caused by silicate nanoparticles cannot be precluded.
The binary plots of magnetite composition from the Duotoushan deposit indicating that trace elements were incorporated into magnetite by substitution of divalent, trivalent and/or tetravalent cations for iron: (a) Si4+ vs. Fe3+; (b) Si4+ vs. Fe2+; (c) Fe2+ vs. Fe3+; (d) Al3+ vs. Fe3+; (e) Ca2+ vs. Fe3+; (f) Si4++Al3+ vs. Fe2++Ca2+.

Compositional zoning in magnetite
At Duotoushan, both the platy and granular magnetites show zoning with different features. In platy magnetite, the TD1-L magnetite is inclusion-poor and has brighter BSE contrast, whereas the darker TD1-D magnetite contains many tiny inclusions (Fig. 4b-e). Granular magnetite exhibits oscillatory zoning composed of bright and dark bands of varying widths (Fig. 4g). These zones are characterised by micrometre-scale bands enriched in Si, Ca and Al alternating with bands depleted in these elements (Fig. 6).
Irregular compositional zones of platy magnetite are very common in some IOCG deposits (e.g. Candelaria deposit; Huang et al., Reference Huang and Beaudoin2019); iron oxide-apatite (IOA) deposits (e.g. Los Colorados, Chadormalu and El Romeral deposits; Knipping et al., Reference Knipping, Bilenker, Simon, Reich, Barra, Deditius, Lundstrom, Bindeman and Munizaga2015a,Reference Knipping, Bilenker, Simon, Reich, Barra, Deditius, Wälle, Heinrich, Holtz and Munizagab; Deditius et al., Reference Deditius, Reich, Simon, Suvorova, Knipping, Roberts, Rubanov, Dodd and Saunders2018; Heidarian et al., Reference Heidarian, Lentz, Alirezaei, Peighambari and Hall2016; Huang and Beaudoin, Reference Huang and Beaudoin2019); Fe skarn deposits (e.g. Chengchao, Yamansu and Paxton deposits; Hu et al., Reference Hu, Li, Lentz, Ren, Zhao, Deng and Hall2014, Reference Hu, Lentz, Li, McCarron, Zhao and Hall2015; Huang et al., Reference Huang, Zhou, Beaudoin, Gao, Qi and Lyu2018); and volcanogenic massive sulfide (VMS) deposits (e.g. Izok Lake and Halfmile Lake deposits; Makvandi et al., Reference Makvandi, Ghasemzadeh-Barvarz, Beaudoin, Grunsky, McClenaghan and Duchesne2016). The compositional variations of different generations/types of magnetite are generally interpreted as the results of dissolution and re-precipitation processes (Putnis, Reference Putnis, Oelkers and Schott2009; Putnis and John, Reference Putnis and John2010; Hu et al., Reference Hu, Li, Lentz, Ren, Zhao, Deng and Hall2014, Reference Hu, Lentz, Li, McCarron, Zhao and Hall2015; Heidarian et al., Reference Heidarian, Lentz, Alirezaei, Peighambari and Hall2016). Primary magnetite (TD1-L) could be replaced extensively by a secondary variety (TD1-D), preferentially along fractures and/or grain boundaries that have abundant porosity (Hu et al., Reference Hu, Lentz, Li, McCarron, Zhao and Hall2015).
The oscillatory zoning of granular magnetite is similar to magnetite from some skarn deposits (e.g. Vegas Peledas and Ocna de Fier-Dognecea deposits; Dare et al., Reference Dare, Barnes, Beaudoin, Méric, Boutroy and Potvin-Doucet2014; Ciobanu and Cook, Reference Ciobanu and Cook2004; Tengtie Fe deposit; Zhao and Zhou, Reference Zhao and Zhou2015), IOCG deposits (e.g. Sossego deposit; Huang and Beaudoin, Reference Huang and Beaudoin2019) and IOA deposits (e.g. Los Colorados and El Laco deposits; Dare et al., Reference Dare, Barnes and Beaudoin2015; Knipping et al., Reference Knipping, Bilenker, Simon, Reich, Barra, Deditius, Wälle, Heinrich, Holtz and Munizaga2015b; Huang and Beaudoin, Reference Huang and Beaudoin2019). This zoning of magnetite is generally interpreted as growth zoning caused by variations in fluid compositions and/or physicochemical conditions such as temperature and oxygen fugacity) during fast crystal growth, which periodically change trace-element partition between magnetite and fluids (Shimazaki, Reference Shimazaki1998; Ciobanu and Cook, Reference Ciobanu and Cook2004; Dare et al., Reference Dare, Barnes, Beaudoin, Méric, Boutroy and Potvin-Doucet2014; Knipping et al., Reference Knipping, Bilenker, Simon, Reich, Barra, Deditius, Wälle, Heinrich, Holtz and Munizaga2015b; Makvandi et al., Reference Makvandi, Beaudoin, McClenaghan and Layton-Matthews2015; Huang et al., Reference Huang, Zhou, Beaudoin, Gao, Qi and Lyu2018). Consequently, the oscillatory zoning of granular magnetite from the Duotoushan deposit might be derived from a fluctuating fluid composition and/or physicochemical conditions.
Factors controlling the compositions of magnetite
As reviewed by Nadoll et al. (Reference Nadoll, Angerer, Mauk, French and Walshe2014), the compositions of hydrothermal magnetite might be mostly controlled by factors such as: fluid composition; host rock; precipitation of associated minerals; temperature (T); and oxygen fugacity ( $f_{{\rm O}_ 2}$) during mineral formation.
The host rocks of both platy and granular magnetite are andesitic tuff breccias which consist mainly of euhedral–subhedral albite and amphibole (Zhang et al., Reference Zhang, Chen, Peng, Zhao, Lu, Zhang, Yang and Sun2018). Thus, the host-rock properties might not be the major controlling factors of the highly-variable compositions of these two types of magnetite. Minerals associated with magnetite may affect the contents of some elements within magnetite because of different partition coefficients (Nadoll et al., Reference Nadoll, Angerer, Mauk, French and Walshe2014; Dare et al., Reference Dare, Barnes, Beaudoin, Méric, Boutroy and Potvin-Doucet2014; Chen et al., Reference Chen, Zhou, Gao and Hu2015). At Duotoushan, the mineral assemblages of the two types of magnetite are different from each other. TD1 magnetite is associated with amphibole which is mainly composed of Si, Mg, Ca and Fe (Zhang et al., Reference Zhang, Chen, Peng, Zhao, Lu, Zhang, Yang and Sun2018). TD2 magnetite is mainly associated with epidote, quartz and minor amphibole. The Duotoushan epidote is mainly composed of Si, Fe, Ca and Al (Zhang et al., Reference Zhang, Chen, Peng, Zhao, Lu, Zhang, Yang and Sun2018). It is expected that co-precipitation of amphibole would have decreased the concentration of Mg for incorporation in TD1 magnetite and co-precipitation of epidote would have decreased Al for incorporation in TD2 magnetite, which suggests that TD1 magnetite should contain less Mg and more Al than the TD2 magnetite. Interestingly, however, TD1-L magnetite has contents of Mg and Al which are similar to those of TD2-L magnetite and TD1-D magnetite contains significantly more Mg and less Al than TD2-D magnetite. This might indicate that the co-precipitation of amphibole or epidote with these two types of magnetite has no significant effect on its composition.
Temperature is considered to be a major composition-controlling factor for hydrothermal magnetite because element-partition coefficients are very temperature dependent (McIntire, Reference McIntire1963). Titanium and Al in Fe oxides are considered to be positively correlated with temperature, with high-temperature magnetite having high Ti and Al contents (Dare et al., Reference Dare, Barnes and Beaudoin2012; Nadoll et al., Reference Nadoll, Mauk, Hayes, Koenig and Box2012; Canil et al., Reference Canil, Grondahl, Lacourse and Pisiak2016). For the TD1 magnetite at Duotoushan, the TD1-D magnetite has similar Ti and slightly greater Al contents than TD1-L (Fig. 9a), indicating that temperature only increases slightly from TD1-L to TD1-D magnetite. For TD2 magnetite, the Ti and Al contents of TD2-D magnetite are apparently greater than for TD2-L magnetite, indicating that temperature obviously increased from TD2-L to TD2-D magnetite (Fig. 9a).
(a) Plot of Al vs. Ti for the Duotoushan magnetite. The high-temperature magnetite typically plots in the high-Ti and Al contents fields; (b) Plot of V concentration for the Duotoushan magnetite. V3+ has the highest compatibility with the spinel structure of magnetite and V5+ is incompatible at high oxygen fugacity levels (Balan et al., Reference Balan, De Villiers, Eeckhout, Glatzel, Toplis and Fritsch2006; Righter et al., Reference Righter, Leeman and Hervig2006). Therefore, a higher V concentration might indicate lower  $f_{{\rm O}_ 2}$.

Oxygen fugacity can also affect the composition of magnetite by controlling element partition coefficients. Some elements, such as V, can occur in various valence states and therefore their behaviours are strongly linked to  $f_{{\rm O}_ 2}$ (Nielsen et al., Reference Nielsen, Forsythe, Gallahan and Fisk1994; Righter et al., Reference Righter, Leeman and Hervig2006). The oxidation state of V in natural environments varies from + 3 to + 5. Among these species, V3+ has the greatest compatibility with the spinel structure of magnetite (e.g. Balan et al., Reference Balan, De Villiers, Eeckhout, Glatzel, Toplis and Fritsch2006; Righter et al., Reference Righter, Leeman and Hervig2006). Vanadium is incompatible at high oxygen fugacity levels due to its 5+ oxidation state. Therefore, the partition coefficient of magnetite/liquid for V decreases with increasing
 $f_{{\rm O}_ 2}$ because V3+ is less stable under these conditions. For Duotoushan magnetite, the mean and median of V contents in TD1-L magnetite are slightly less than those in TD1-D magnetite, indicating that
 $f_{{\rm O}_ 2}$ decreased slightly from TD1-L to TD1-D magnetite (Fig. 9b). Because the V contents in TD1 magnetite are mostly less than the detection limits, however, the indication of such trends in platy magnetite may be limited. Similarly, the mean and median V contents in TD2-L magnetite are slightly less than those in TD2-D magnetite indicating a slightly decreased
 $f_{{\rm O}_ 2}$ from TD2-L to TD2-D magnetite (Fig. 9b). In general, the highly variable compositions of different granular magnetite zones might not be caused by oxygen fugacity.
We can conclude, therefore that the effects of co-precipitating minerals, temperature and  $f_{{\rm O}_ 2}$ on platy magnetite are very limited and the changing or evolving fluid composition might be the major controlling factor for platy magnetite (especially the late TD1-D) of Duotoushan. According to the paragenesis study and stable-isotope compositions of fluids (Zhang et al., Reference Zhang, Chen, Peng, Zhao, Lu, Zhang, Yang and Sun2018), there was a significant mixing of basinal brine or sea water at the late stage, which could change the fluid composition and generate the late alteration. Secondly, the textures of dissolution and re-precipitation along a certain direction (probably a crack) could also indicate late fluid alteration. Thus, an external fluid mixing into the former fluid that formed TD1-L magnetite can be considered as the main reason for fluid composition changes, which subsequently generated the TD1-D magnetite. In addition, the compositional variation of granular magnetite (TD2) might be controlled in the main by temperature.
Origins and evolution of Duotoushan magnetite
According to Dare et al. (Reference Dare, Barnes, Beaudoin, Méric, Boutroy and Potvin-Doucet2014), magnetite can be derived from either silicate melts or hydrothermal fluids. The behaviour of Ni and Cr in magmatic magnetite is quite different from that in hydrothermal magnetite. Their behaviour is coupled in silicate magmas and the Ni/Cr ratio of magnetite ≤1. In contrast, in many hydrothermal environments (i.e. porphyry, IOCG, skarn), their behaviour is decoupled and the Ni/Cr ratio of magnetite ≥1, and this can probably be attributed to a greater solubility of Ni compared to Cr in fluids. Therefore, a plot of Ti vs. Ni/Cr can be used to discriminate magnetite between hydrothermal and magmatic environments (Dare et al., Reference Dare, Barnes, Beaudoin, Méric, Boutroy and Potvin-Doucet2014). At the Duotoushan deposit, both types of magnetite are of hydrothermal origin which is characterised by low-Ti and high-Ni/Cr relative to those of magmatic magnetite (Fig. 10). Moreover, magnetite in the Duotoushan deposit commonly co-precipitated with hydrothermal minerals, e.g. amphibole and epidote (Fig. 3), also suggesting a hydrothermal origin.
Discrimination diagram of Ti (ppm) vs. Ni/Cr in magnetite from the Duotoushan Fe–Cu deposit. Reference fields from Dare et al. (Reference Dare, Barnes, Beaudoin, Méric, Boutroy and Potvin-Doucet2014).

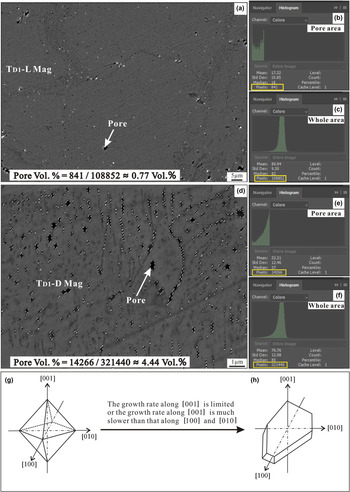
Most investigations refer to the platy magnetite as mushketovite which formed by replacing primary hematite. The transformation of hematite to magnetite may undergo a redox reaction, which results in a volume decrease of 1.64% (Ohmoto, Reference Ohmoto2003; Mucke and Cabral, Reference Mucke and Cabral2005). This figure is established by calculation (using Adobe Photoshop CS4) that the proportion of pore volume in the whole TD1-L magnetite is ~0.77% (Fig. 11a–c), which is significantly less than the theoretical volume of decrease (1.64%). In general, the pores formed by the transformation of hematite to magnetite are distributed homogeneously. But the abundant pores found in the TD1-D magnetite are distributed very unevenly and usually occur along the edge or cracks of TD1-L magnetite (Fig. 4b). In addition, the calculated proportion of pore volume in the whole TD1-D magnetite is ~4.44% (Fig. 11d–f), much greater than 1.64%, indicating that TD1-D magnetite is not the product of hematite transforming to magnetite, but rather resulted from the later fluids as discussed above. Given the evidence, platy magnetite is more likely to be precipitated from the hydrothermal fluid rather than transformation from primary hematite. Magnetite has a cubic inverse spinel structure and usually forms crystals with octahedral morphology (Fig. 11g). Previous studies have shown that some external environmental conditions, e.g. crystal growth rate, growth space, and stress action, will also have an affect on the crystal morphology (Liu et al., Reference Liu, Fu and Xiao2006; Li, Reference Li2008; Wang et al., Reference Wang, Pan and Weng1982). If the growth space along [001] is limited, or the growth rate along [001] is much slower than that along [100] and [010], magnetite might occur as platy crystals rather than octahedrons (Fig. 11h). According to the observation above, TD1 magnetite is generally intergrown with platy amphibole (Fig. 3b). Therefore, magnetite might appear as platy crystals due to the limitation of growth space and the growth habit of coexisting minerals (i.e. amphibole).
Estimation of the pore volume (calculated using Adobe Photoshop CS4) (a–b) and the structure model of magnetite (g–h). The smallest unit of an image is a pixel and thus the area percentage can be represented by the pixel percentage. (a) TD1-L magnetite. White dashed circles are the pores identified by the Polygonal Lasso Tool in the software. (b–c) The pixels representing pore area and the total TD1-L magnetite area calculated by the software, respectively. The ratio of pixels in pore area and whole area, i.e. 0.77%, is the proportion of pore volume in the whole TD1-L magnetite. (d) TD1-D magnetite. Similarly, white dashed circles are the pore identified by the Polygonal Lasso Tool in the software. (e–f) The pixels of the pore area and the whole TD1-D magnetite area calculated by software, respectively. Therefore, the ratio of pixels in pore area and whole area, i.e. 4.44%, is the proportion of pore volume in the whole TD1-D magnetite. (g) The structure model of magnetite octahedrons. (h) The platy crystal of magnetite. If the growth space along [001] is limited, or the growth rate along [001] is much slower than that along [100] and [010], magnetite may have occurred as platy crystals rather than as octahedrons.

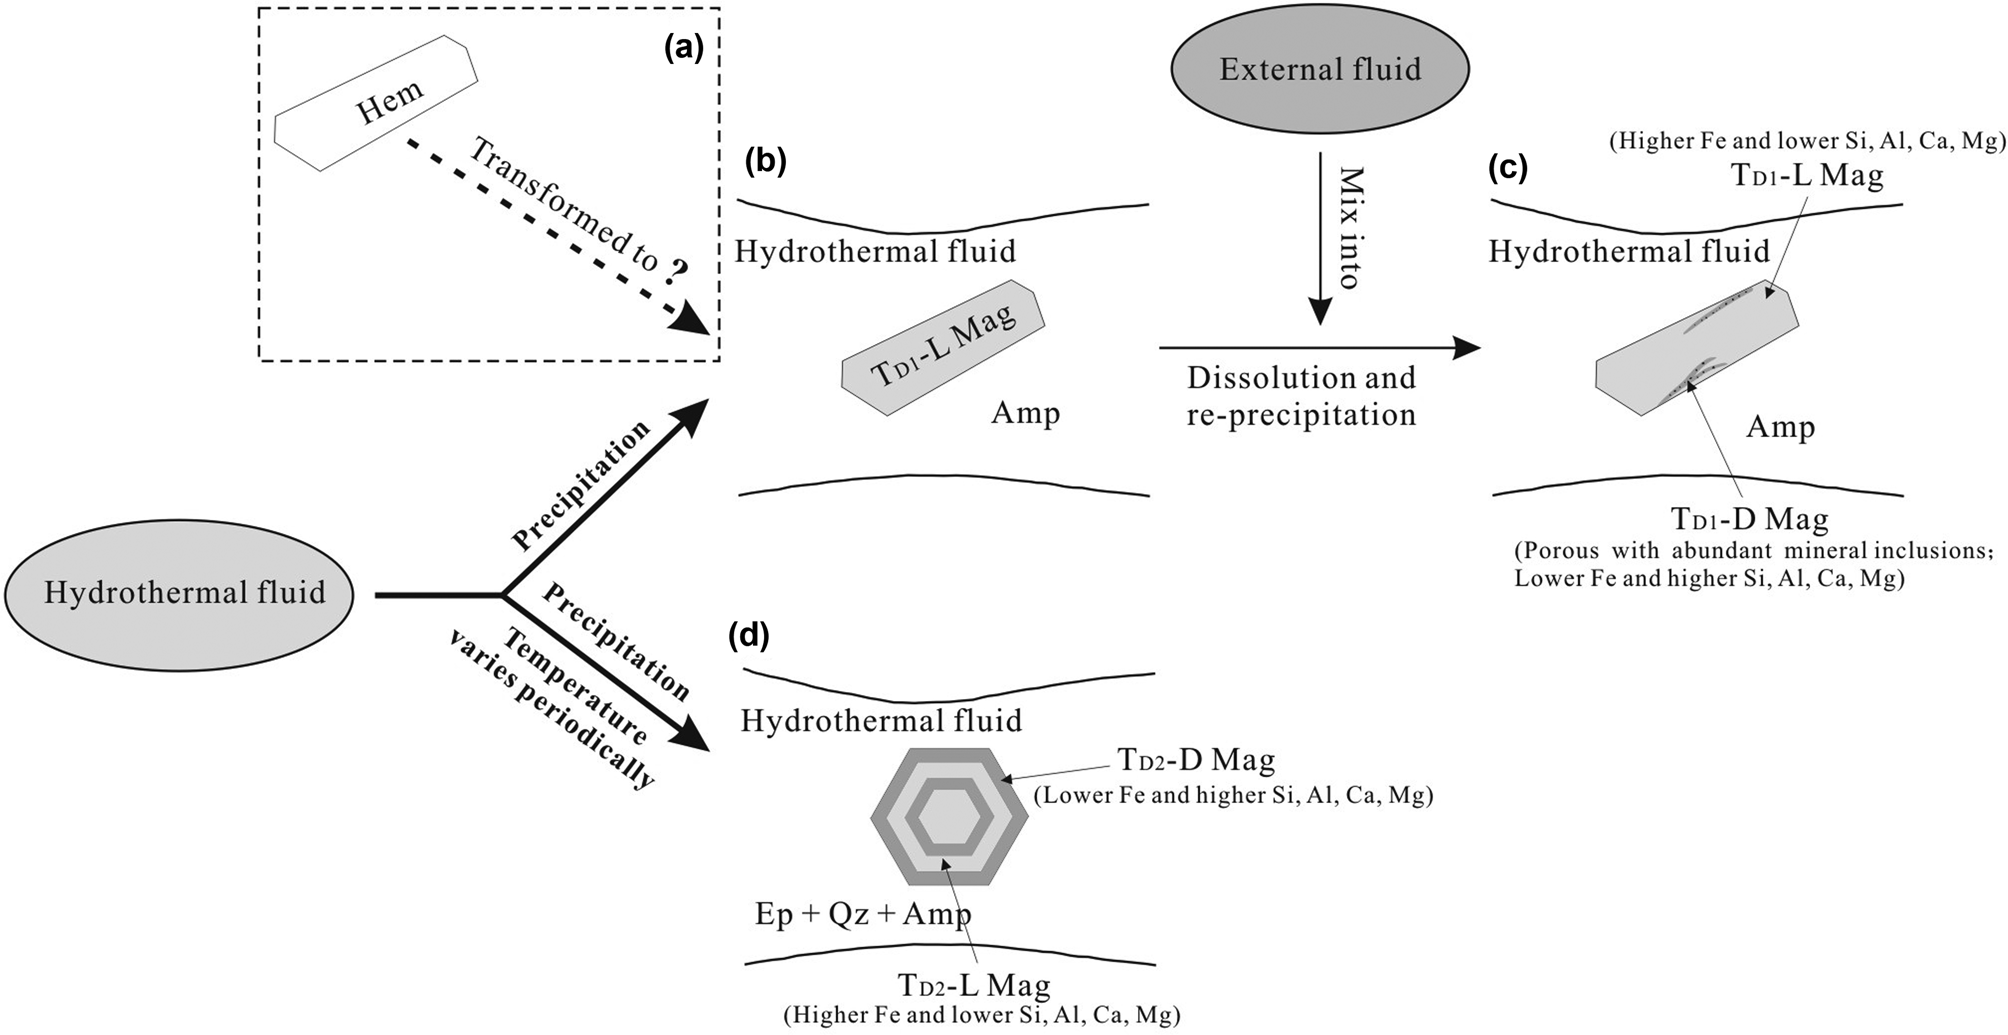
On the basis of the discussion above, we have speculated about the origins and evolutionary processes of magnetite from the Duotoushan deposit and illustrated them schematically in Fig. 12. Although the possibility that platy magnetite transformed from hematite cannot be excluded entirely (Fig. 12a), we suggest that platy magnetite associated with amphibole was originally precipitated from hydrothermal fluid (Fig. 12b). Subsequently, an external fluid may have mixed with the previous fluid and consequently caused the undersaturation of iron in the fluids, leading to dissolution of primary magnetite (TD1-L; greater Fe and lesser Si, Al, Ca concentrations) and re-precipitation of TD1-D magnetite (less Fe and more Si, Al, Ca) with significant porosity and abundant mineral inclusions (Fig. 12c). We observed that TD1-D magnetite usually formed along fractures of the platy magnetite (Fig. 6a). According to the structure model of granular and platy magnetite (Fig. 11g, h), when there is a force along [001], the platy magnetite is more likely to generate fractures than granular magnetite. Therefore, the later external fluid has a significant effect on TD1 but less influence on TD2 magnetite. This external fluid might contain basin brine or seawater with high salinity and Cl– contents and thus enhanced the solubility of Fe, a suggestion which is supported by hydrogen and oxygen isotopic compositions of fluid inclusions (Zhang et al., Reference Zhang, Chen, Peng, Zhao, Lu, Zhang, Yang and Sun2018). By comparison, granular magnetite associated with epidote, quartz and minor amphibole was precipitated from fluid that formed TD1-L magnetite. With periodic variation in temperature, oscillatory zoning (with zones of various widths) was formed in granular magnetite (Fig. 12d) to avoid intensive alteration from late external fluids due to lack of structural weakness. These oscillatory bands are characterised by bands depleted in Si, Al and Ca (TD2-L magnetite) alternating with bands enriched in these elements (TD2-D magnetite).
Sketches illustrating the genesis of magnetite from the Duotoushan deposit. (a) Platy magnetite was probably mushketovite transformed from hematite, which we cannot completely rule out from our data. (b) Platy magnetite (TD1-L) associated with amphibole (Amp) was more probably originally precipitated from hydrothermal fluid; (b) An external fluid mixed into the primary fluid and resulted in the dissolution of TD1-L magnetite and re-precipitation of TD1-D magnetite; (c) Granular magnetite associated with epidote (Ep), quartz (Qz) and amphibole was precipitated from the primary fluid. Then, with the periodic temperature changes, TD2-L magnetite was depleted in Si, Al and Ca; and TD2-D magnetite enriched in these elements was formed.
Implications for genesis of Fe–Cu ore deposits
The origins of magnetite in different types of Fe–Cu deposits are variable. Previous studies have shown that trace elements of magnetite can be used to identify ore-deposit types and genesis of mineral deposits (Dupuis and Beaudoin, Reference Dupuis and Beaudoin2011; Dare et al., Reference Dare, Barnes, Beaudoin, Méric, Boutroy and Potvin-Doucet2014; Nadoll et al., Reference Nadoll, Angerer, Mauk, French and Walshe2014; Chen et al., Reference Chen, Zhou, Gao and Hu2015; Knipping et al., Reference Knipping, Bilenker, Simon, Reich, Barra, Deditius, Lundstrom, Bindeman and Munizaga2015a, Reference Knipping, Bilenker, Simon, Reich, Barra, Deditius, Wälle, Heinrich, Holtz and Munizagab; Heidarian et al., Reference Heidarian, Lentz, Alirezaei, Peighambari and Hall2016; Huang et al., Reference Huang, Qi and Meng2014, Reference Huang, Zhou, Beaudoin, Gao, Qi and Lyu2018). The plot of Ca + Al + Mn vs. Ti + V proposed by Dupuis and Beaudoin (Reference Dupuis and Beaudoin2011) is one of the most widely used discrimination diagrams at present. It can be used to differentiate magnetite from a variety of ore-deposit types (i.e. porphyry, Kiruna, IOCG, BIF, skarn and Fe-Ti-V). This discrimination diagram does not work very well for magnetite in a complex hydrothermal deposit such as Duotoushan in the present study.
As shown in Fig. 13, all TD1-D magnetite data fall in the skarn field and most of the TD1-L magnetite data fall below the skarn field, which probably resulted from dissolution and re-precipitation process. This process caused the magnetite with less Ca, Al and Mn to dissolve and then re-precipitate magnetite with more Ca, Al and Mn and significant porosity and abundant mineral inclusions. Similarly, the composition of TD2 magnetite shows, in general, a much larger elemental dispersion with most TD2-L magnetite plotting in the fields of BIF and all of TD2-D magnetite plotting in the field of skarn. This elemental dispersion might result from the oscillatory zoning (as TD1-D magnetite is rich in Ca, Al and Ti whereas TD2-L magnetite contains less of these elements), resulting from periodic change in temperature during hydrothermal processes.
Plot of Ca + Al + Mn vs. Ti + V (wt.%) in magnetite from the Duotoushan Fe–Cu deposit. Reference fields from Dupuis and Beaudoin (Reference Dupuis and Beaudoin2011).

In summary, trace-element concentrations in most magnetite from Fe–Cu deposits, such as at Duotoushan, are similar to those observed in hydrothermal systems, such as IOCG and skarn deposits. In addition, although the discrimination diagrams based on magnetite composition do provide a good baseline for the ore-genesis discrimination of Fe–Cu deposits, detailed textural characterisation prior to compositional analysis is critical.
Conclusions
The Duotoushan Fe–Cu deposit contains two different types of magnetite (platy and granular) based on textural and chemical characteristics. The platy and granular magnetite may have precipitated from hydrothermal fluids under different conditions. Both the platy and granular magnetite display two types of compositional zoning, although their genetic mechanisms are different. According to our data the zoning of platy magnetite was more likely to have been formed by a dissolution–re-precipitation process caused by change in the fluid composition, whereas that of granular magnetite was caused by precipitation of fluids with cyclical changes in temperature. These oscillatory zones are characterised by bands enriched in Si, Al and Ca alternating with bands depleted in these elements. Magnetite in the Duotoushan Fe–Cu deposit have compositions similar to those in the IOCG and skarn deposits and experienced a very complex evolution process. We further suggest that detailed textural characterisation prior to compositional analysis is critical in the study of the ore genesis and evolution of Fe–Cu deposits.
Supplementary material
To view supplementary material for this article, please visit https://doi.org/10.1180/mgm.2020.29
Acknowledgements
This study was funded by the National Natural Science Foundation of China (U1603244), Chinese National Science Fund (41725009) and Type-B Chinese Academy of Sciences Strategic Pilot Science and Technology Special (XDB18030206). In particular, the authors are grateful to Prof. Xiangping Gu (Central South University) and Xi Chen (Southwest Petroleum University) for their help with XRD and EMPA analyses.