INTRODUCTION
Glacially comminuted rock flour is characterized as being fine grained with strained crystal structures (e.g., Tranter, Reference Tranter2003) and, consequently, having relatively high chemical reactivity. Anderson et al. (Reference Anderson, Drever and Humphrey1997) compared the geochemistry of glaciated and unglaciated watersheds. These authors determined that cation denudation rates in glaciated watersheds are some of the highest in the world. Chemical weathering in glaciated watersheds tends to be dominated by relatively rapid sulfide oxidation and carbonate dissolution (Tranter, Reference Tranter2003; Wadham et al., Reference Wadham, Tranter, Skidmore, Hodson, Priscu, Lyons, Sharp, Wynn and Jackson2010; Hindshaw et al., Reference Hindshaw, Tipper, Reynolds, Lemarchand, Wiederhold, Magnuson, Bernasconi, Kretzschmar and Bourdon2011; Mitchell et al., Reference Mitchell, Lafrenière, Skidmore and Boyd2013; Boyd et al., Reference Boyd, Hamilton, Havig, Skidmore and Shock2014; Stachnik et al., Reference Stachnik, Majchrowska, Yde, Nawrot, Cichała-Kamrowska, Ignatiuk and Piechota2016). A few studies also have found increased Ca2+ release because of silicate weathering in watersheds dominated by silicate rocks with few sulfide minerals (Mitchell and Brown, Reference Mitchell and Brown2008; Moore et al., Reference Moore, Jacobson, Holmden and Craw2013).
Glaciated watersheds have also been shown to be important in hydrobiogeochemical cycles (Anderson, Reference Anderson2007; Slemmons et al., Reference Slemmons, Saros and Simon2013), especially in light of climatic warming (Saros et al., Reference Saros, Rose, Clow, Stephens, Nurse, Arnett, Stone, Williamson and Wolfe2010; Fortner et al., Reference Fortner, Mark, McKenzie, Bury, Trierweiler, Baraer, Burns and Munk2011; Fountain et al, Reference Fountain, Campbell, Schuur, Stammerjohn, Williams and Ducklow2012; Singer et al., Reference Singer, Fasching, Wilhelm, Niggemann, Steier, Dittmer and Battin2012; Nowak and Hodson, Reference Nowak and Hodson2014; Hood et al., Reference Hood, Battin, Fellman, O’Neel and Spencer2015). Mountain landscapes maintain relatively high environmental gradients that are sensitive to climate change and anthropogenic disturbance (Campbell et al., Reference Campbell, Clow, Ingersoll, Mast, Spahr and Turk1995; Beniston, Reference Beniston2003; Slemmons et al., Reference Slemmons, Saros and Simon2013). Primary minerals, including those hosting rare earth elements (REEs), may biogeochemically weather subglacially, in the forefield, proglacially, or as detritus, potentially at great distances downstream (Tranter, Reference Tranter2003; Hodson et al., Reference Hodson, Mumford and Lister2004, Reference Hodson, Mumford, Kohler and Wynn2005; Anderson, Reference Anderson2007; Föllmi et al., Reference Föllmi, Hosein, Arn and Steinmann2009; Wadham et al., Reference Wadham, Tranter, Skidmore, Hodson, Priscu, Lyons, Sharp, Wynn and Jackson2010). REE-hosting minerals often occur in rocks in accessory abundances (<2% by volume) with glacial comminution resulting in increased exposure to chemical weathering compared with temperate and tropical soils (e.g., Tranter, Reference Tranter2003; Anderson, Reference Anderson2007).
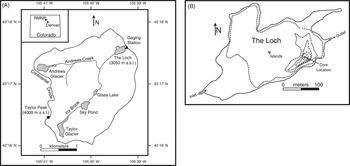
Monazite is an accessory REE-phosphate [(La,Ce,Nd)PO4] that releases REEs to groundwater and surface water when chemically weathering. An increase in water or sediment REE concentrations reflects an increase in chemical weathering and vice versa (e.g., Nesbitt, Reference Nesbitt1979; Kronberg et al., Reference Kronberg, Nesbitt and Lam1986; Condie, Reference Condie1991; Hagedorn et al., Reference Hagedorn, Cartwright, Raveggi and Maas2011; Och et al., Reference Och, Müller, Wichser, Ulrich, Vologna and Sturm2014). Cerium (Ce) is an REE that exhibits trivalent and tetravalent oxidation states, precipitating as a solid when in the latter state. Subsequently, Ce may be used to evaluate changes in redox conditions in watersheds resulting from fluctuations in glaciohydrologic conditions. Shiller (Reference Shiller2010) reported REE concentrations in stream waters collected from the outlet of the Loch Vale watershed (LVW), a small glaciated experimental watershed located in Rocky Mountain National Park, USA (Fig. 1). Weekly REE concentrations across the 4 yr period April 1998 to April 2002 revealed substantial enrichment of La3+, Ce3+, and Nd3+ in stream water relative to the other REEs (Shiller, Reference Shiller2010). Enrichment of these light REEs supports a monazite source.
Maps showing location and physiography of the Loch Vale watershed (A) and bathymetry of The Loch including core location (B). Bathymetry modified from Baron (Reference Baron1992).

Because glacial comminution results in enhanced exposure of accessory phases to chemical weathering, the LVW is an ideal location to study accessory REE mineral weathering since the last glacial maximum (LGM). Because monazite is likely the principal host of REEs in the LVW bedrock, REEs in sediments and stream waters provide proxy data for the chemical weathering of monazite. Presumably, if monazite weathering is occurring, then other reactive bedrock minerals are also likely experiencing chemical weathering.
The purpose of this study is to evaluate chemical weathering in the LVW since the LGM using the REEs as proxy data for the chemical weathering of monazite, and by extension other reactive primary minerals. This is accomplished using a combination of experimental dissolution data, present-day stream fluxes, and sediment collected from The Loch, a lake located at the outlet of the watershed (Fig. 1). Laboratory and present-day stream flux data were used to understand the modern controls on REE behavior and interpret REE data from the sedimentary record. Because the LVW is relatively small at 660 ha and underlain by relatively homogeneous granitic bedrock, variations in sediment sources capable of influencing changes in lacustrine sediment REE chemistry are minimized (e.g., Zhou et al., Reference Zhou, Wang, Guan, Lai, You, Wang and Yang2009; Lee et al., Reference Lee, Yoon, Yoo, Lim, Lee, Kim, Bak and Itaki2012). Analyses of lacustrine sediment permit reconstructions of past watershed environmental conditions that may improve predictions of future changes and natural resource management (Slemmons et al., Reference Slemmons, Saros and Simon2013; Larson et al., Reference Larson, Finkenbinder, Abbott and Ofstum2016).
SITE DESCRIPTION
The LVW ranges in elevation from 3050 m above sea level (asl) at the outlet to 4009 m asl at Taylor Peak on the Continental Divide (Fig. 1). Between 1984 and 2008, mean annual precipitation in the LVW was 98 cm/yr (data of the National Atmospheric Deposition Program), and the mean annual temperature was 1.4 °C (data available at http://www.nrel.colostate.edu/projects/lvws/) (Price et al., Reference Price, Peresolak, Brice and Tefend2013). More than 70% of precipitation occurred as snow with spring snowmelt being the major annual hydrologic event within the watershed.
Approximately 80% of the bedrock in the LVW is 1.8 Ga metasedimentary biotite gneiss (Cole, Reference Cole1977; Braddock and Cole, Reference Braddock and Cole1990; Mast, Reference Mast1992). The remaining ~20% of the bedrock is composed of the 1.5 Ga intrusive Silver Plume granite, which primarily occurs in the lower part of the watershed (Peterman et al., Reference Peterman, Hedge and Braddock1968; Braddock and Cole, Reference Braddock and Cole1990; Mast, Reference Mast1992). Both units are composed of quartz, oligoclase (An27), microcline, and biotite as major minerals along with accessory calcite, apatite, and monazite (Cole, Reference Cole1977; Mast et al., Reference Mast, Drever and Baron1990; Mast, Reference Mast1992).
Bare rock and talus constitute 82% of the watershed, with the tree line occurring at ~3350 m asl (Wardle, Reference Wardle1968; Arthur, Reference Arthur1992). The ~6% of the LVW that is forested (Arthur and Fahey, Reference Arthur and Fahey1990; Mast et al., Reference Mast, Drever and Baron1990; Arthur, Reference Arthur1992) occurs on the thickest soils in the watershed, averaging ~56 cm (Walthall, Reference Walthall1985; Arthur, Reference Arthur1992; Baron et al., Reference Baron, Walthall, Mast and Arthur1992). Forests include Engelmann spruce–subalpine fir just below the tree line and lodgepole pine stands below ~3000 m asl (Wardle, Reference Wardle1968; Arthur, Reference Arthur1992).
The Loch is a cirque lake located at the watershed outlet, has the largest surface area of the LVW lakes at 4.98 ha, and has a maximum depth of ~4.7 m (Fig. 1; Baron, Reference Baron1992). It formed during Pinedale age advances of Taylor and Andrews Glaciers. No thermal stratification is observed in The Loch during the open water season, and inverse thermal stratification occurs during periods of ice cover (Baron, Reference Baron1992). The primary sediment source to The Loch is via Icy Brook, which has produced a small sandy delta at the inlet (Fig. 1). The lake-bottom sediments are fine-grained, organic-rich gyttja.
METHODS
Watershed flux calculations for REEs
REE stream fluxes were calculated for April 7, 1998, to April 6, 2002, based on the weekly concentration data from Shiller (Reference Shiller2010). Daily stream discharge data came from the LVW website (http://www.nrel.colostate.edu/projects/lvws/). Rare earth elemental fluxes were calculated by the weekly chemical concentrations being extended respectively forward and backward halfway to the next and previous sample event on a daily basis. The chemical concentrations were then multiplied by the daily runoff and summed with the final sum divided by the 4 yr sample period to get the average annual flux. Flux values were normalized to the watershed area of 660 ha yielding units of moles per hectare per year.
Monazite characterization
Eleven bedrock samples were collected from outcrops throughout the LVW and included both the metasedimentary biotite gneiss and the Silver Plume granite. Bedrock thin sections containing monazite were examined by scanning electron microscopy (SEM) in secondary electron imaging mode. Carbon-coated thin sections were examined at Princeton University’s Image Analysis Center using a Quanta 200 Environmental SEM. Quantitative energy dispersive X-ray spectroscopy was performed using an Oxford Instruments INCA microanalysis system.
Major element analyses of monazite grains in polished thin sections were completed by electron microprobe analyses (EMPAs) at the Binghamton University Electron Microprobe Regional Facility. The EMPA is a fully automated wavelength dispersive JEOL 8900 electron microprobe analyzer. Accelerating voltage and beam current were 15 keV and 10 nA, respectively, and the beam diameter was 2 μm. Calibration standards for Na, Si, Al, Mg, Fe, Mn, Ti, Ca, K, Sr, and REEs were respectively albite (Amelia), SiO2, orthoclase, MgO, hematite, spessartine, TiO2, diopside, orthoclase, SrTiO3, and REE silicate glass. Accuracy for EMPAs of SiO2, TiO2, MgO, FeO, MnO, and K2O is <2%. Accuracy for analyses of Al2O3, CaO, Na2O, SrO, and REEs is <5%. Precision for all EMPA analytes is <2%.
REE concentrations in monazite were measured on polished thin sections by laser ablation inductively coupled plasma mass spectrometry (LA-ICP-MS) in the Urban Environmental Biogeochemistry Laboratory, Towson University, Maryland, USA. Analyses were performed using an LSX–213 ablation unit with a 213 nm Nd:YAG CETAC laser connected to an Optimass 9500 ICP Time-of-Flight Mass Spectrometer (GBC Scientific Equipment, Braeside, VIC, Australia). Individual monazite crystals were ablated using a 50 µm spot size, and calibration was performed using the National Institute of Standards and Technology SRM glass 610 with the concentration values from Jochum et al. (Reference Jochum, Weis, Stoll, Kuzmin, Yang, Raczek and Jacob2011). Analyses of monazite crystals were completed in groups of three or four, with three standard analyses being performed before and after each monazite group. Neodymium concentrations from EMPA served as the internal standard.
Plug-flow column reactor
Dissolution experiments were performed to examine mineralogical controls on REE release from LVW bedrock, with the hypothesis that monazite dissolution is the primary source of REEs to surface water and groundwater. The experiments were performed with a plug-flow column reactor over 71 days at 20.2±2.9°C. Unweathered crushed bedrock (150–600 µm or 30–100 mesh) from the LVW was used (provided courtesy of M. Schulz, US Geological Service, Menlo Park, CA, USA) and was a slightly finer nonmagnetic subset of that used in similar experiments by White et al. (Reference White, Blum, Bullen, Vivit, Schulz and Fitzpatrick1999a, Reference White, Bullen, Vivit, Schulz and Clow1999b). Two identical 50 cm Pyrex columns were connected in tandem, with each having a 2.4 cm inside diameter and fritted glass supports at the base. To prevent the formation of bubbles, the influent entered at the base of the first column through a 0.45 µm nylon filter and continued from the top of the first column to the base of the second column. Effluent discharged through a second 0.45 µm nylon filter. An average flow rate of 8.4±0.9 mL/hour was maintained by gravity flow through an adjustable hosecock with effluent collection in a 5 L bottle and yielded a solvent residence time of 53 hours. The flow rate was similar to the previous dissolution experiments with this bedrock (i.e., White et al., Reference White, Blum, Bullen, Vivit, Schulz and Fitzpatrick1999a, Reference White, Bullen, Vivit, Schulz and Clow1999b).
Prior to the dissolution experiment, 20 L of pH 2 OmniTrace Ultra HNO3 was passed through the empty reactor over 8 days. Next, the empty reactor was rinsed with the influent for the experiment, a pH 3 OmniTrace Ultra HNO3 solution. Immediately prior to adding the crushed bedrock, an effluent sample of the pH 3 OmniTrace Ultra HNO3 solution was collected to serve as a laboratory blank. The reactor experiment was run until temporal changes in pH and specific conductance values became negligible (71 days). A total of 44 effluent samples were collected and analyzed for major elements and REEs with daily sample collection for the first 30 days, followed by multiple times per week. Specific conductance and pH of each sample were measured in the laboratory using an Oakton PC450 pH/conductivity meter calibrated with standard solutions.
Effluent samples for chemical analyses were removed from the 5 L collection bottle and placed in 30 mL HNO3-washed polypropylene bottles and acidified with OmniTrace Ultra HNO3 to pH<2. Chemical analyses were completed at the Department of Marine Science, Center for Trace Analysis, at the University of Southern Mississippi. Samples were diluted in ultrapure 1% HNO3 containing 2 ppb In as an internal standard. Depending on concentration, samples were diluted between 5 and 550 times. Samples were analyzed using a ThermoFisher Element XR high-resolution ICP-MS. Sample introduction utilized a 100 µL/minute micronebulizer and Peltier-cooler spray chamber (Elemental Scientific Inc., USA). REEs were analyzed in low resolution, whereas other elements were analyzed in medium resolution. Calibration was performed by external standards prepared in ultrapure 1% HNO3. A laboratory blank and standard were run approximately every eight samples to check for instrumental drift.
Mineral contributions to reactor effluent chemistry
Apatite and monazite are the sole phosphate phases in the bedrock, with monazite being the predominant REE host. The contribution of P5+ from monazite dissolution [P5+] Mo was calculated using the expression
 $$\left[ {{\rm P}^{{5\!{\plus}}} } \right]_{\!{Mo}} {\equals}\left[ {{\rm Nd}^{{3\!{\plus}}} } \right]_{{ef}}\, ∙\, \left( {{{S_{{\rm P}} } \mathord{\left/ {\vphantom {{S_{{\rm P}} } {S_{{{\rm Nd}}} }}} \right. \kern-\nulldelimiterspace} {S_{{{\rm Nd}}} }}} \right),$$
where [Nd3+] ef is the molar concentration of Nd3+ in the reactor effluent, and S P and S Nd are the stoichiometries of P5+ and Nd3+ in monazite, respectively. The effluent La3+ concentration was also used for purposes of comparison and yielded nearly identical results. Ce was not used as it has multiple oxidation states and may precipitate as a solid thereby modifying its concentrations in effluent. The contribution of P5+ from apatite was then determined by difference between the total effluent P5+ concentration and that calculated from monazite using Eq. 1.
Mineral sources of Ca2+ to effluent include calcite, oligoclase, apatite, and monazite. The Ca2+ in effluent attributable to dissolution of a given mineral was determined using a sequential mass-balance approach. The relative contribution of Ca2+ to the reactor effluent [Ca2+] was calculated starting with oligoclase (Ol) dissolution as it is the sole source of Na+ and using the expression
 $$\left[ {{\rm Ca}^{{2{\plus}}} } \right]_{{Ol}} \, {\equals}\, \left[ {{\rm Na}^{{\plus}} } \right]_{{ef}} \, ∙\, \left( {{{S_{{{\rm Ca}}} } \mathord{\left/ {\vphantom {{S_{{{\rm Ca}}} } {S_{{{\rm Na}}} }}} \right. \kern-\nulldelimiterspace} {S_{{{\rm Na}}} }}} \right),$$
where [Na+] ef is the molar concentration of Na+ in the reactor effluent, S Ca is the stoichiometry of Ca2+ in oligoclase, and S Na is the stoichiometry of Na+ in oligoclase. The contribution of Ca2+ from apatite (Ap) was similarly calculated using the expression
 $$\left[ {{\rm Ca}^{{2{\plus}}} } \right]_{{Ap}} \, {\equals}\, \left[ {{\rm P}^{{5{\plus}}} } \right]_{{ef}} \, ∙\, {\rm }\left( {{{S_{{{\rm Ca}}} } \mathord{\left/ {\vphantom {{S_{{{\rm Ca}}} } {S_{{\rm P}} }}} \right. \kern-\nulldelimiterspace} {S_{{\rm P}} }}} \right),$$
where [P5+] ef is the fraction of P5+ attributable to apatite dissolution as determined previously. The contribution of Ca2+ from monazite (Mo) dissolution was calculated using the expression
 $$\left[ {{\rm Ca}^{{2{\plus}}} } \right]_{{Mo}} \, {\equals}\, \left[ {{\rm Nd}^{{3{\plus}}} } \right]_{{ef}} \, ∙\, \left( {{{S_{{{\rm Ca}}} } \mathord{\left/ {\vphantom {{S_{{{\rm Ca}}} } {S_{{{\rm Nd}}} }}} \right. \kern-\nulldelimiterspace} {S_{{{\rm Nd}}} }}} \right).$$
The contribution of Ca2+ from calcite dissolution was then determined by difference between the total Ca2+ concentration and that calculated from oligoclase, apatite, and monazite from Eqs. 2–4.
The total contribution of a given element c to the effluent by a specific mineral j dissolving for the period of sampling t was calculated by integrating
 $$\eqalignno{ \matrix{ {A_{{c,j}} &\, {\equals}\, {\int}\limit^{d_{e}}_{d_{o}} {C_{{c,j}} \left( t \right)dt}, } } $$
where C c,j (t) is the concentration of element c attributable to a given mineral j in reactor effluent as a function of time, A c,j is the integrated area under the curve of C c,j as a function time, d o is the start day of measurement period, and d e is the end day of measurement period. The elemental contribution for each mineral was then converted to a percentage.
14C dating of lake-bottom sediment
Sediments from The Loch (Fig. 1) were collected and age dated to determine chemical flux values at the watershed scale through time. Lake-bottom sediment was collected using percussion-coring equipment that followed the design of Reasoner (Reference Reasoner1993). The core was collected on March 6, 2015, through ~1-m-thick lake ice. The 7.6-cm-diameter continuous core was 2.37 m in length and was collected in the deepest part of The Loch (Fig. 1B) at a water depth of ~4.4 m. The deepest part of The Loch was chosen as it is likely to contain the thickest sediment with optimum conditions for preservation of the oldest material. The core was cut into three sections with Zorbitrol added to any void space (Tomkins et al., Reference Tomkins, Antoniades, Lamoureux and Vincent2007), packaged in the field, and placed on ice in a cooler for transport back to the Earth Surface Processes Laboratory at Illinois College.
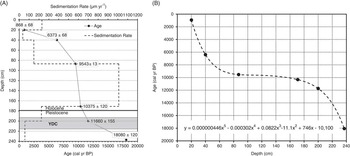
Radiocarbon dating of terrestrial macrofossils extracted from the sediment was performed by accelerator mass spectrometry at Beta Analytical Inc. in Miami, Florida, USA. The dated organic material was dominated by woody material up to several millimeters in size. All ages reported herein are calibrated using the IntCal13 database (Reimer et al., Reference Reimer, Bard, Bayliss, Beck, Blackwell, Bronk Ramsey and Buck2013) and are years before 1950. An age-depth model was established by fitting a fifth-order polynomial to the data.
Sediment physical properties
Bulk density of sediment samples were measured at Illinois College using a 2.72-cm-diameter plastic tube for which volume was calculated. Sample mass was measured before and after oven drying at 105°C to yield wet and dry bulk density and water content.
Samples for particle size analyses were initially prepared at Illinois College by oxidizing organic matter with H2O2. Particle size analyses were completed by the Environmental Soil Analysis Laboratory (ESAL) at the University of Nevada, Las Vegas, USA. At the ESAL, deionized water (purified CAP Type II water with total dissolved solids<0.2 ppm, electrical conductivity<0.4 μS/cm, and resistance >2.5 MΩ) was used throughout the analyses. Approximately 0.2 g of each of the samples was soaked in 5 mL of deionized water for 24 hours, ultrasonically dispersed for 5 minutes, and wet sieved to pass all 0.5 mm material before analysis. The suspensions were collected and analyzed with a Malvern Mastersizer 2000 laser particle size analyzer equipped with a Hydro S dispersant unit (Malvern Instruments Ltd., Malvern, UK). The particle size distribution data were automatically generated using the Mie Theory by the software associated with the instrument, with a material refractive index of 1.544 and absorption index 1.0 as recommended by Ryzak and Bieganowski (Reference Ryzak and Bieganowski2011). Three replications were analyzed for each of the samples, and the means reported. Sediment was subdivided into clay (<2 µm), silt (2–63 µm), and sand (63 µm–2 mm) with units of volume percent.
Sediment REE chemistry
The techniques used to extract easily extractable (i.e., labile) REEs from the lake sediment followed established methods (e.g., Sholkovitz, Reference Sholkovitz1989). The only difference in this study is that organic matter destruction was accomplished by heating to 550°C for 3 hours rather than by oxidation with H2O2. The labile fraction included distinguishing between two forms of REEs (e.g., Tessier et al., Reference Tessier, Campbell and Bisson1979; Sholkovitz, Reference Sholkovitz1989; Tricca et al., Reference Tricca, Stille, Steinmann, Kiefel, Samuel and Eikenberg1999; Wang et al., Reference Wang, Liu and Zhu2013; Freslon et al., Reference Freslon, Bayon, Toucanne, Bernell, Bollinger, Cheron and Etoubleau2014). The “acid-extractable fraction” is the fraction bound to carbonates and Fe-Mn-oxides and [oxy]hydroxides. The “organic fraction” is the fraction bound to organic matter. Preparation of the acid-extractable fraction began by weighing out ~40 mg of dried sediment and adding 40 mL of 0.2 M HCl. This mass of sample and volume of HCl yielded an acid/solid ratio of ~1000, which is necessary to prevent the buffering effects associated with carbonate dissolution (Sholkovitz, Reference Sholkovitz1989). The sediment-acid mixture was then mixed continuously end-over-end for 16 hours to allow for total dissolution of the carbonate and Fe- and Mn-oxides and [oxy]hydroxides (Zhang et al., Reference Zhang, Zhang, Chang, Yang, Lei, Yang, Pu and Lei2009). Samples were centrifuged, and then the supernatant was removed and analyzed for the acid-extractable fraction. The residue was washed and calcinated at 550°C for 3 hours in order to yield the sample for extraction of the organic fraction of REEs. The calcinated residue then followed a similar extraction procedure as that for the acid-extractable fraction except that 1 M HCl was used. Analyses of the acid extracts of the core sediments for REEs followed the same procedures as outlined previously for the reactor effluent samples.
The concentration, C REE, of each REE in nmol/g in the dry sediment is given by
 $$C_{{{\rm REE}}} \, {\equals}\, {{\left( {S_{{{\rm REE}}} \, ∙\, V} \right)} \mathord{\left/ {\vphantom {{\left( {S_{{{\rm REE}}} {\bullet}V} \right)} {m_{{{\rm sed}}} }}} \right. \kern-\nulldelimiterspace} {m_{{{\rm sed}}} }},$$
where S REE is the REE concentration in the extract in nM, V is the volume of HCl reagent used for extraction (40 mL), and m sed is the dry mass of sediment used in extract (~40 mg).
The Ce anomaly (Ce n /Ce* n ) of the sediment was calculated following the method of Shiller (Reference Shiller2010) to be consistent with reported stream values. Because the reduced form is Ce3+ and the oxidized form is Ce4+, the ratio of the two can be used to assess environmental changes that alter the dominant Ce oxidation state. The Ce anomaly calculation used herein provides a ratio of the measured Ce concentration to that predicted from the concentrations of La3+ and Nd3+, whereby
 $${\rm Ce}{\asterisk}_{n} \, {\equals}\, \left( {{2 \mathord{\left/ {\vphantom {2 3}} \right. \kern-\nulldelimiterspace} 3}} \right)\, ∙\, {\rm La}_{n} {\plus}\left( {{1 \mathord{\left/ {\vphantom {1 3}} \right. \kern-\nulldelimiterspace} 3}} \right)\, ∙ \, {\rm Nd}_{n} .$$
The subscript n indicates values normalized to the North American shale composite (Gromet et al., Reference Gromet, Dymek, Haskin and Korotev1984).
RESULTS
Watershed REE flux data and monazite weathering rates
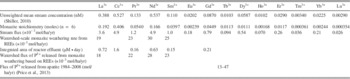
The combined EMPA and LA-ICP-MS analyses yield a monazite with the formula (La0.192Ce0.406Nd0.166Pr0.0540Gd0.0449Sm0.0397Ca0.0668Th0.0690)Si0.0172P0.935O4 (Table 1). Additional REE stoichiometries are provided in Table 1; REEs with stoichiometries less than 0.03 moles have been omitted from the formula for clarity.
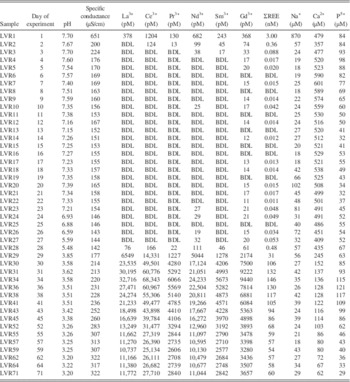
Unweighted mean stream concentration, monazite rare earth element (REE) stoichiometry, weathering rate calculations, and reactor effluent data for the Loch Vale watershed.

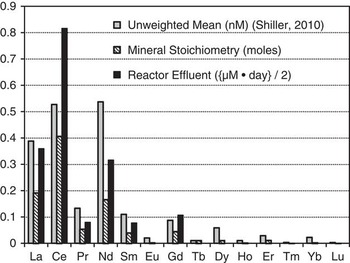
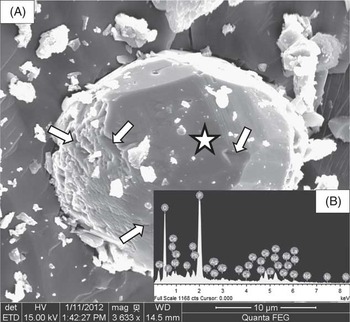
The similarity between the REE stream and monazite stoichiometries (Table 1, Fig. 2) supports the conclusion that any REE sources to stream waters (e.g., atmospheric; e.g., Vázquez-Ortega et al., Reference Vázquez-Ortega, Perdrial, Harpold, Zapata-Ríos, Rasmussen, McIntosh and Schaap2015) other than monazite are likely negligible. The stream Ce concentration is relatively low, likely attributable to Ce3+ oxidizing to Ce4+ and coprecipitating with solids such as Fe-Mn-oxides and [oxy]hydroxides (Fig. 2). Although there is some relative variation in the REE proportions, La3+, Ce3+, and Nd3+ represent 75%–85% of REEs in monazite, stream water, and reactor effluent (Fig. 2), which is strong evidence that monazite is the REE source to groundwater and surface water in the LVW. The small variations in REE proportions shown in Figure 2 likely reflect, at least in part, differences in secondary REE-mineral formation between the watershed and column reactor. SEM images show crystallographically controlled dissolution etch pits on the surface of monazite grains (Fig. 3).
Comparison of outlet unweighted mean stream chemistry (Shiller, Reference Shiller2010), reactor effluent chemistry, and monazite stoichiometry for the Loch Vale watershed.

Scanning electron micrograph (A) and corresponding energy dispersive X-ray spectroscopy (EDS) spectra (B) of a monazite grain from the Loch Vale watershed bedrock. Star on grain indicates location of EDS measurement, and arrows indicate examples of etch pits.

The rate of monazite weathering is determined by dividing each REE stream flux value by its stoichiometry in the mineral. Monazite weathering rates calculated from individual stream REE flux values and the monazite stoichiometry range from 19×10−3 to 30×10−3 mol/ha/yr (Table 1). Monazite weathering rates were only calculated using the four most abundant REEs (La3+, Pr3+, Nd3+, and Sm3+) because the uncertainty increases as the REE concentration decreases. A monazite weathering rate also was not calculated using Ce because of its potential oxidation at the earth’s surface and fractionation from solution to the solid phase. Monazite weathering rates are approximately three orders of magnitude lower than weathering rates of other primary minerals in the LVW (Mast et al., Reference Mast, Drever and Baron1990; Mast, Reference Mast1992; Price et al., Reference Price, Peresolak, Brice and Tefend2013).
Reactor effluent chemistry
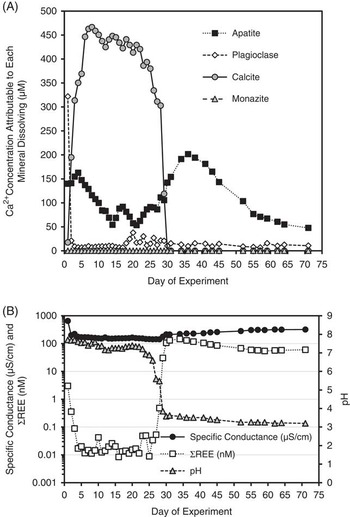
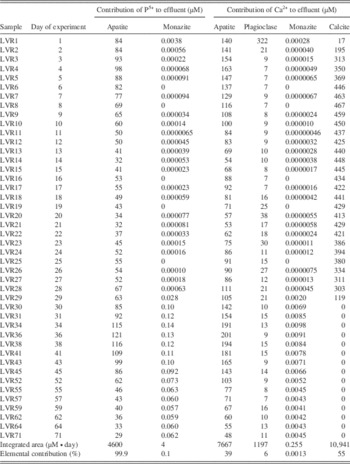
For simplicity, reactor effluent chemical analyses were only completed for those REEs with the highest concentration in monazite (Table 2). The contribution of Ca2+ and P5+ in the reactor effluent from each mineral is provided in Table 3, with the Ca2+ contribution from each mineral as a function of time plotted in Figure 4A. Temporal changes in pH, specific conductance, and ΣREEs are provided in Figure 4B. The time-integrated area under the curve for each REE in the reactor effluent may be calculated using Eq. 5 and is provided in Table 1.
Reactor chemistry data versus time for dissolution of bedrock from Loch Vale watershed. (A) Calcium concentration attributable to each mineral dissolving, and (B) specific conductance, sum of rare earth elements (ΣREE), and pH.

Elemental concentrations in reactor effluent. BDL, below detection limits; REE, rare earth element.

Contributions of P5+ and Ca2+ to reactor effluent by different minerals.

Calcite dissolution begins early and inhibits monazite dissolution (Fig. 4). Calcite dissolution also appears to suppress apatite dissolution with the largest contribution of Ca2+ from apatite peaking on day 36, 6 days after calcite dissolution ends. Plagioclase dissolution does not appear to be suppressed by calcite dissolution with its highest Ca2+ contribution occurring during calcite dissolution on day 20 of the experiment (Fig. 4A). All calcium-containing phases with the exception of calcite were dissolving at nearly steady rates when effluent sampling ended on day 71.
The percentages of the P5+ in the effluent contributed by apatite and monazite are 99.9% and 0.1%, respectively (Table 3). The percentages of Ca2+ in the effluent contributed by apatite, plagioclase, monazite, and calcite are respectively 39%, 6%, 0.0013%, and 55%. The relatively small contribution of Ca2+ and P5+ by monazite dissolution in the reactor is consistent with relatively low field-based monazite weathering rates of 19×10−3 to 30×10−3 mol/ha/yr calculated for the LVW (Table 1).
14C dating of lake-bottom sediment
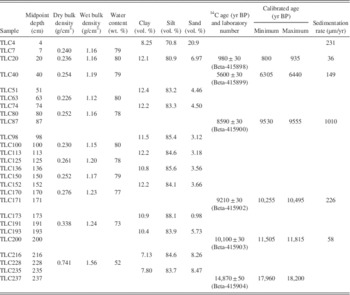
The error bars for 14C dates plotted in Figure 5 are smaller than the size of the markers (Table 4). The age of the deepest sediment is 18,080±120 cal yr BP, reflecting the retreat of glacial ice above The Loch shortly after the LGM. Advance of alpine glaciers during the Younger Dryas chronozone (YDC; 13,200 and 11,100 cal yr BP) reflects a period of climatic cooling (Menounos and Reasoner, Reference Menounos and Reasoner1997; Reasoner and Jodry, Reference Reasoner and Jodry2000). During the YDC, Taylor and Andrew Glaciers (Fig. 1) advanced within the watershed and appear to be associated with an increase in sedimentation rates in The Loch (Fig. 5A). A second increase in sedimentation rates in the The Loch occurs at approximately the Holocene-Pleistocene boundary at 10.5 ka. This increase reflects relatively high sedimentation rates during the Early Holocene when seasonality (Elias, Reference Elias1996), increased climatic stability, and summer temperatures and precipitation increased in the Rocky Mountains (e.g., Markgraf and Scott, Reference Markgraf and Scott1981; Vierling, Reference Vierling1998; Briles et al., Reference Briles, Whitlock and Meltzer2012).
(A) Calibrated sediment ages and sedimentation rates as a function of depth for the sediment core collected from The Loch. Error is provided in the labels as error bars are smaller than the data marker. The sedimentation rate plot assumes the top surface of the sediment is modern. Younger Dryas chronozone (YDC) is also shown. (B) Age versus depth model for chronological data in panel A. See Figure 1 for location.

Physical properties of the lake sediment core collected from The Loch. Sedimentation rate reflects time interval down to the next reported calibrated age. Most recent sedimentation rate assumes the top surface of the sediment is modern.

Sediment physical properties
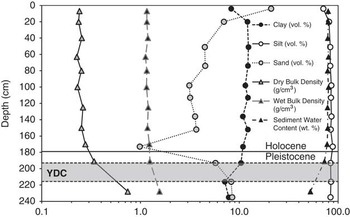
No sedimentary varves, laminations, or stratification were visible in the split core. The sediment appeared as homogeneous gyttja with no diatomaceous sediment at the bottom, as was found in sediment cores collected from Sky Pond upvalley (Fig. 1; Menounos and Reasoner, Reference Menounos and Reasoner1997; Reasoner and Jodry, Reference Reasoner and Jodry2000). All samples have greater than 80% silt except the shallowest sample at 4 cm depth (Table 4, Fig. 6). The shallowest sample at 4 cm depth displays a dramatic increase in sand content associated with a decrease in clay content. These particle size changes may possibly reflect major flooding that occurred in the LVW in summer 2013. In the earliest Holocene there is an abrupt and isolated drop in sand content (Table 4, Fig. 6). Sediment bulk densities are lowest in the bottom of the core and then relatively constant from 191 cm to the top of the core (Table 4, Fig. 6).
Physical properties versus depth for the sediment core from The Loch with the Younger Dryas chronozone (YDC) and Pleistocene-Holocene boundary displayed.

Yuan et al. (Reference Yuan, Koran and Valdez2013) place the Pleistocene-Holocene boundary in the Colorado Rocky Mountains at 10.5 ka, reflecting the largest climatic change in the past 100 ka. The largest sedimentological, physical, and geochemical transitions in our data set occur at ~10.5 ka, corresponding to a depth of ~179 cm. As such, we will retain that age for the Pleistocene-Holocene boundary in the LVW. Sediment below ~179 cm depth reflects glacially dominated sedimentation in The Loch. Although there is some disparity between the estimated ages for paleoclimatic boundaries, a warm and wet climate at the onset of the Holocene is extensively reported (Briles et al., Reference Briles, Whitlock and Meltzer2012; Johnson et al., Reference Johnson, Jiménez-Moreno, Eppes, Diemer and Stone2013).
Sediment REE chemistry
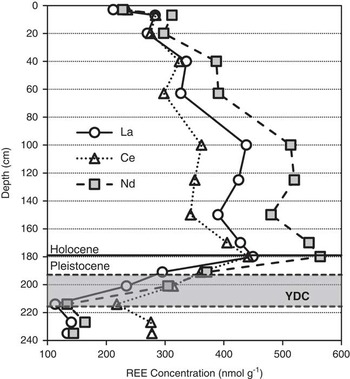
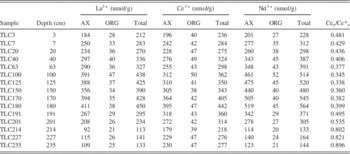
REE concentrations show large down-core variations that appear to correlate with major climate transitions (Table 5, Fig. 7), as discussed in the next section of the article. We limit our discussion to the labile fractions of La3+, Ce3+, and Nd3+ as they have the highest concentrations in monazite, reactor effluent, stream water, and lake-bottom sediments (Figs. 2 and 7; Tables 1, 2, and 5). The results in Table 5 distinguish between the acid-extractable fraction (AX) and the organic fraction (ORG), with the latter being significantly less concentrated than the former.
Changes in total labile rare earth element (REE) concentrations with depth. Younger Dryas chronozone (YDC) is also shown.

Concentrations of major labile rare earth elements in the lake sediment core separated into the acid-extractable fraction (AX) and the organic fraction (ORG).

Changes in total labile REE concentrations with depth exhibit several noteworthy trends that correspond to climatic changes (Fig. 7). The REEs decrease in concentration from the LGM to the onset of the YDC and then abruptly increase. The REE concentrations continue increasing up to the Pleistocene-Holocene boundary where they reach maximum concentrations and begin to decline. At the onset of the YDC, the Ce concentration is higher than La3+ or Nd3+ but is lower than La3+ or Nd3+ by the Pleistocene-Holocene transition because La3+ or Nd3+ increases more rapidly across this period (Fig. 7). A relative reduction in Ce concentrations in lake sediments likely reflects oxidation of Ce3+ to Ce4+ and coprecipitation with secondary phases within the regolith of the watershed upstream from The Loch.
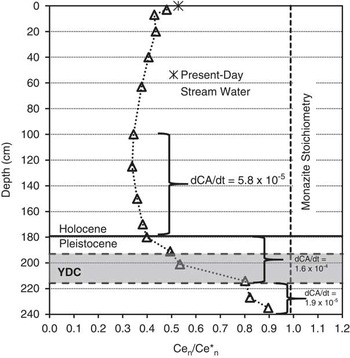
The Ce n /Ce* n ratio in the sediments gives evidence for coprecipitation of Ce with secondary phases. The ratio is highest and closest to that of source monazite (0.988) in the deepest part of the core (Fig. 8). The Ce n /Ce* n decreases steadily until the Holocene-Pleistocene boundary and then remains relatively constant up to ~100 cm. In the top 7 cm of the core, the Ce n /Ce* n begins a small increase toward that of the present-day stream water (0.528; Shiller, Reference Shiller2010). The top 7 cm of sediment reflects the last several hundred years.
Up-core Ce anomaly (Ce n /Ce* n ) trend including the monazite value. Rates of change of the Ce n /Ce* n (dCA/dt) are also shown with units of per year. The present-day stream water chemistry is calculated from data from Shiller (Reference Shiller2010). Younger Dryas chronozone (YDC) is also shown.

Discussion
Monazite weathering in the field and laboratory
Monazite dissolution is the primary source of REEs to stream water based on a comparison of the unweighted mean REE stream concentrations and the time-integrated area under the curve for each REE in the reactor effluent with the stoichiometry of monazite found in the LVW bedrock (Table 1, Fig. 2). The successful use of REEs in mineral weathering rate calculations has been demonstrated by Price et al. (Reference Price, Velbel and Patino2005) and Velbel and Price (Reference Velbel and Price2007). From 1998 to 2002, the monazite weathering rate in LVW based on REEs was 19×10−3 to 30×10−3 mol/ha/yr (Table 1).
Monazite weathering rates determined from watershed-scale REE release and from P5+ release rates are quite comparable. In the column reactor, apatite and monazite dissolution produced 99.9% and 0.1% of P5+, respectively (Table 3). If P5+ contributions from apatite and monazite weathering at the watershed scale are assumed to follow this ratio and apatite contributes 13–47 mol P5+/ha/yr (Table 1; Price et al., Reference Price, Peresolak, Brice and Tefend2013), then monazite contributes 18×10−3 to 28×10−3 mol P5+/ha/yr. Based on P5+ stoichiometry, the monazite weathering rate can then be estimated to be 14×10−3 to 50×10−3 mol/ha/yr, which matches well with the rates of 19×10−3 to 30×10−3 mol/ha/yr calculated from watershed REE fluxes (Table 1).
Labile REEs in lacustrine sediment as tracers of paleoenvironmental conditions
Even though the monazite weathering rate in the LVW is relatively low, the observed trends in labile REE concentrations in the core may reveal climatically influenced temporal changes in paleohydrology and glacial activity in the LVW. From the bottom of The Loch core at 18.1 ka to the onset of the YDC at 13.2 ka, the concentration of labile REEs display an overall decrease (Fig. 7). This period is characterized by gradual warming and deglaciation with a transition from winter to summer precipitation in the Colorado Rocky Mountains (e.g., Briles et al., Reference Briles, Whitlock and Meltzer2012; Krause and Whitlock, Reference Krause and Whitlock2013). The small overall decrease in REEs from 18.1 ka to 13.2 ka likely reflect that the most chemically reactive glaciogenic material, including monazite, was relatively depleted by the time deposition began in The Loch at 18.1 ka BP. The chemical reactivity of glacial sediments is highest immediately following glacial retreat but declines very rapidly within the first few thousand years of exposure to a silicate-dominated regime (Blum, Reference Blum1997; Anderson et al., Reference Anderson, Drever, Frost and Holden2000).
From 18.1 ka to 13.2 ka, the decrease in Ce n /Ce* n ratio along with a relative reduction in Ce concentration in lake-bottom sediments reflects increased oxidation of Ce3+ to Ce4+ and precipitation with solids in the regolith upvalley from The Loch (Figs. 7 and 8). The increase in Ce oxidation from 18.1 ka to 13.2 ka reflects an increase in oxygenation of the proglacial zone of the LVW. Because the bed of a glacier is nearly isolated from the atmosphere (Raiswell and Thomas, Reference Raiswell and Thomas1984; Tranter et al., Reference Tranter, Brown, Raiswell, Sharp and Gurnell1993; Tranter, Reference Tranter2003; Boyd et al., Reference Boyd, Hamilton, Havig, Skidmore and Shock2014), during glacial retreat the proglacial zone progressively increases in area, and consequently, so do the glaciogenic sediments and scoured bedrock exposed to atmospheric oxygen.
From the beginning of the YDC at 13.2 ka (Menounos and Reasoner, Reference Menounos and Reasoner1997; Reasoner and Jodry, Reference Reasoner and Jodry2000) to the Pleistocene-Holocene boundary at ~10.5 ka (Benedict, Reference Benedict1973; Yuan et al., Reference Yuan, Koran and Valdez2013), REE concentrations monotonically increase (Fig. 7). The YDC is a period of cooling climate with advance of Taylor and Andrews Glaciers at elevations above Sky Pond located at 3320 m asl (Menounos and Reasoner, Reference Menounos and Reasoner1997; Reasoner and Jodry, Reference Reasoner and Jodry2000). In addition, the Ce n /Ce* n continues to decrease with time (Fig. 8) indicating oxidation in surface environments is still increasing. The rate of change of the Ce n /Ce* n (dCA/dt) from the onset of the YDC to the Pleistocene-Holocene boundary is 1.6×10⁻⁴/yr (Fig. 8). This value is approximately an order of magnitude higher than that of 1.9×10⁻⁵/yr prior to the onset of the YDC (Fig. 8). Advance of the glaciers will result in increased mechanical weathering and production of fine grained, highly reactive rock flour available for chemical weathering. Thus, a rapid and sustained increase in oxidation during the YDC when alpine glaciers are advancing likely reflects increased chemical weathering. Even though the cooling and glacial advance associated with the YDC is over by 11.1 ka in the LVW, REE concentrations continue to increase to the Pleistocene-Holocene boundary (Fig. 7). The period between the YDC and Pleistocene-Holocene boundary is termed the Preboreal period and reflects increased temperatures and summer rainfall in the southern and central Rocky Mountains (Yuan et al., Reference Yuan, Koran and Valdez2013). The Ce n /Ce* n continues to decrease during the Preboreal period as freshly exposed glaciogenic sediments are exposed to oxygen-rich atmospheric agents in a warmer and wetter climate.
Changes in the sedimentation rate and REE concentrations show that the Pleistocene-Holocene boundary represents a major boundary in the paleoglaciohydrologic conditions of the LVW. The sedimentation rate increases dramatically from ~230 µm/yr to ~1000 µm/yr (Fig. 5), and the percentage of clay, dry and wet bulk density, and sediment water content all stabilize above the Pleistocene-Holocene boundary (Fig. 6). After an increase in REEs during the YDC and Preboreal period, there is an abrupt start of a decline in their concentrations (Fig. 7). Changes in the Ce n /Ce* n are relatively small (dCA/dt=5.8×10−5/yr) above the Pleistocene-Holocene boundary (Fig. 8) indicating a stabilization of redox conditions within the LVW. The Early Holocene climate in the southern and central Rocky Mountains is characterized as a warm stable period with increased summer temperatures and precipitation (Briles et al., Reference Briles, Whitlock and Meltzer2012; Johnson et al., Reference Johnson, Jiménez-Moreno, Eppes, Diemer and Stone2013; Yuan et al., Reference Yuan, Koran and Valdez2013). Increased sedimentation rates associated with a warmer and wetter climate may imply enhanced chemical weathering. However, in the case of the LVW, and globally as well, glacial activity has ended by the Holocene. Thus, chemical weathering rates begin to decrease in the Holocene despite the warmer and wetter climate because the elevated mechanical weathering associated with either Pleistocene glacial advance or exposure of rock flour during retreat has ended.
The two shallowest samples at 7 cm and 3 cm depth display a Ce n /Ce* n trend that is consistent with that of the present-day stream waters (Fig. 8). Shiller (Reference Shiller2010) found that Ce is most mobile during the spring snowmelt when dissolved organic carbon is flushed from the soils and conditions are most reducing. During this time, REEs complex with dissolved organic carbon. The Ce n /Ce* n trend produced when the top two core samples are combined with the present-day stream water data may reflect that the REE behavior observed by Shiller (Reference Shiller2010) began in the last several hundred years.
The labile REE concentrations in the sediment are interpreted to reflect climatically driven paleoglaciohydrologic changes in chemical weathering within the LVW watershed. Although other physicochemical processes operating in the watershed have the potential to influence lake sediment labile REE concentrations (e.g., Och et al., Reference Och, Müller, Wichser, Ulrich, Vologna and Sturm2014), several lines of evidence support climate as the primary driver. For example, increases in Fe-Mn-oxides and [oxy]hydroxides within the sediments would increase sediment REE concentrations (e.g., Vázquez-Ortega et al., Reference Vázquez-Ortega, Perdrial, Harpold, Zapata-Ríos, Rasmussen, McIntosh and Schaap2015 and references therein). However, no visible evidence such as a color change exists within the sediment core indicating oxidation. Additionally, REE concentrations in the period following the LGM and in the Holocene decrease at points when an increase in oxidizing conditions is indicated by rising Ce n /Ce* n values, which is the opposite of the behavior expected if Fe-Mn-oxides and [oxy]hydroxides were increasing. Another possible control on REE behavior is preferential adsorption to the clay-sized fraction of sediment (e.g., Coppin et al., Reference Coppin, Berger, Bauer, Castet and Loubet2002; Bayon et al., Reference Bayon, Toucanne, Skonieczny, André, Bermell, Cheron and Dennielou2015). Bayon et al. (Reference Bayon, Toucanne, Skonieczny, André, Bermell, Cheron and Dennielou2015) report an Laclay/Lasilt ratio of ~1.5 for sediments derived from watersheds underlain by igneous and metamorphic rocks. However, this ratio is small when compared with the relatively large changes in REE concentrations observed in the core. Changes in clay mineralogy from those with lower cation exchange capacity to those with higher cation exchange capacity are also not likely. The LVW is relatively small, and changes in the regions of the watershed being drained would not significantly modify the clay mineralogy being eroded. Furthermore, the kinetics of changes in clay mineralogy attributable to changes in climate operate on time scales greater than 10,000 yr (Price et al., Reference Price, Velbel and Patino2005).
A third possible factor in REE concentrations is that changes in the pH of the waters flowing into and within The Loch may have modified partitioning of the REEs between the dissolved and solid phases. Surface waters having a lower pH should yield a relative increase in dissolved REEs and a subsequent decrease of REEs adsorbed to sediment. Such a scenario would potentially exist when chemical weathering rates are relatively low and groundwater and surface water have a pH closer to that of precipitation. An increase in REE solubility attributable to a reduced pH would also have to hold true for Ce, such that low pH conditions would raise the Ce n /Ce* n . Relatively low pH conditions associated with a reduction in chemical weathering would be reflected in both reduced labile REE concentrations in the sediment and increased Ce n /Ce* n . The only depths in the sediment core where such trends occur are above ~100 cm (Figs. 7 and 8). These observed trends above ~100 cm depth are consistent with a reduction in chemical weathering rates as the most chemically weatherable minerals in the glaciogenic sediments are now depleted, and/or there is a decrease in precipitation associated with weakening of the North American monsoon (Briles et al., Reference Briles, Whitlock and Meltzer2012; Krause and Whitlock, Reference Krause and Whitlock2013; Yuan et al., Reference Yuan, Koran and Valdez2013). Further evidence of a reduction in chemical weathering above ~100 cm depth is that there is a steady increase in the fraction of sand-sized material up-core (Fig. 6). Thus, the available evidence points to climate being the primary driver of REE concentrations in The Loch sediments.
The proxy REE data of this study indicate that the highest chemical weathering rates, at least for monazite, in the LVW over the past 18.1 ka occurred at approximately the Pleistocene-Holocene boundary (Fig. 7). The relatively rapid chemical weathering rates follow the YDC when glaciers advanced at higher elevations in the LVW, producing glacially comminuted rock flour. The combination of glacial erosion and high chemical weathering rates are also likely responsible for the lowest sand concentration observed in the lake sediment core early in the Holocene (Fig. 6). These findings indicate that the highest chemical weathering rates for monazite in glaciated watersheds occur during and immediately after glacial advance, which is consistent with previous findings for sulfide and carbonate dissolution in glaciated watersheds (e.g., Blum Reference Blum1997; Anderson et al., Reference Anderson, Drever, Frost and Holden2000; Tranter, Reference Tranter2003; Wadham et al., Reference Wadham, Tranter, Skidmore, Hodson, Priscu, Lyons, Sharp, Wynn and Jackson2010; Hindshaw et al., Reference Hindshaw, Tipper, Reynolds, Lemarchand, Wiederhold, Magnuson, Bernasconi, Kretzschmar and Bourdon2011; Mitchell et al., Reference Mitchell, Lafrenière, Skidmore and Boyd2013; Boyd et al., Reference Boyd, Hamilton, Havig, Skidmore and Shock2014; Stachnik et al., Reference Stachnik, Majchrowska, Yde, Nawrot, Cichała-Kamrowska, Ignatiuk and Piechota2016). The findings of this study also demonstrate that REE proxy data in lacustrine sediments have the potential to illuminate climate-driven paleoweathering trends.
SUMMARY AND CONCLUSIONS
REE fluxes from the weathering of monazite are comparable for the current watershed and for column experiments. For a column reactor experiment, apatite and monazite yielded 99.9% and 0.1% of the effluent phosphorus, respectively. Using these proportions and the previously determined watershed-scale flux of P5+ from apatite, monazite weathering rates range from 14×10−3 to 50×10−3 mol/ha/yr. These values compare favorably with the watershed-scale monazite weathering rate of 19×10−3 to 30×10−3 mol/ha/yr calculated using REE flux values.
Labile REEs released by monazite dissolution exhibit a net decrease in concentration from the LGM until the onset of the YDC at 13.2 ka when alpine glaciers were melting. Such a trend likely reflects that the most chemically reactive glaciogenic material was already weathered by 18.1 ka. During this same time, the Ce n /Ce* n gradually decreases reflecting increased oxidation within the watershed as glaciers melt and the proglacial zone progressively increases in area.
From the beginning of the YDC at 13.2 ka to the Pleistocene-Holocene boundary at ~10.5 ka, REE concentrations monotonically increase in the lake sediment. The advance of glaciers results in increased mechanical weathering and production of highly chemically reactive rock flour. At the same time, the Ce n /Ce* n continues to decrease, but at an increasing rate, indicating oxidation associated with increased chemical weathering upvalley. REE concentrations in the sediment continue to increase to the Pleistocene-Holocene boundary reflecting increased temperatures and summer rainfall. The Ce n /Ce* n continues to decrease during this time with continued chemical weathering of freshly exposed glaciogenic sediments.
The Pleistocene-Holocene boundary is a major paleoweathering boundary in the LVW. The sedimentation rate increases dramatically above the Pleistocene-Holocene boundary, and REEs start an abrupt decline in concentration. Changes in the Ce n /Ce* n molar ratio are also relatively small above the Pleistocene-Holocene boundary indicating a stabilization of redox conditions within the LVW. This period is characterized by a warm stable climate with increased summer temperatures and precipitation. The lack of Holocene glacial activity within the LVW appears to have lowered mechanical weathering to such levels that chemical weathering rates are greatly reduced. The two shallowest sediment samples at 7 cm and 3 cm depth display an increasing Ce n /Ce* n trend that is consistent with that of the present-day stream waters. This trend reflects that the present-day hydrologic behavior in the LVW began in the last several hundred years.
The findings of this study demonstrate that labile REEs in lake-bottom sediments may be used to illuminate the climate-driven paleoenvironmental conditions of small glaciated watersheds. Furthermore, REEs may be successfully applied to such studies even when host source minerals are dissolving at relatively low rates and yielding very low REE concentrations in surface waters.
Acknowledgments
The authors wish to thank the National Park Service staff, especially P. McLaughlin, who assisted with the acquisition of a Scientific Research and Collection Permit for Rocky Mountain National Park. We also express our gratitude to R. Campbell and W. Marshall who provided assistance during field activities, J. Baron for logistical assistance, and R. Powell who answered numerous questions regarding percussion coring. Appreciation is expressed to reviewers M. Elwood Madden, J. Quade, and associate editor V. Holliday whose thoughtful comments greatly strengthened the manuscript, and D. Booth for editorial handling and providing additional review. Funding for this project was provided by start-up costs to J. Price from Illinois College, and funds provided through the Environmental Studies Program. J. Moore acknowledges support as the Jess and Mildred Fisher Endowed Chair of Geological Sciences in the Fisher College of Science and Mathematics, Towson University. This article is dedicated in memory of Mr. Thomas Hendricks, retired chemistry teacher at Rochelle Township High School, Rochelle, Illinois, who first introduced J.R. Price to the field of chemistry.