INTRODUCTION
The Pleistocene glaciations have been a principal element forming the present geomorphology of the Alps and their foreland. As such, the reconstruction of both the timing and the controls on glacier growth and decay remains a major question in Alpine Quaternary geochronology, in particular with regard to the last glacial cycle. For the Southern Alps, the vast sedimentary sequences deposited onto the foreland plain represent an extensive and unique archive recording sedimentary processes and, thus, environmental conditions throughout the entire last glacial cycle within the southern circum-Alpine area (e.g., Miola et al. Reference Miola, Bondesan, Corain, Favaretto, Mozzi, Piovan and Sostizzo2006; Pini et al. 2009, Reference Pini, Ravazzi and Reimer2010; Fontana et al. Reference Fontana, Mozzi and Marchetti2014a). Absolute chronologies of these sediments are a basic prerequisite to infer past glacier fluctuation. However, for large sectors of the Alps such chronologies are rather scarce and often poorly constrained (cf. Rossato and Mozzi Reference Rossato and Mozzi2016).
Moreover, generating reliable and reproducible ages for high-precision 14C chronologies does not only require the availability of datable material but was also shown to be affected by the sample pretreatment methods applied in the laboratory. ABA (acid-base-acid, also known as AAA=acid-alkali-acid) is the most widely used chemical pretreatment technique for organic material (e.g., peat, wood, soils, macrofossils, charcoal) prior to radiocarbon analysis. It provides a fast and simple cleaning procedure which is generally considered sufficient to generate accurate ages. However, depending on the organic material dated and the remaining 14C activity, limitations and potential drawbacks of the ABA pretreatment have been debated (e.g., Gillespie et al. Reference Gillespie, Hammond, Goh, Tonkin, Lowe, Sparks and Wallace1992; Bird et al. Reference Bird, Ayliffe, Fifield, Turney, Cresswell, Barrows and David1999; Hatté et al. Reference Hatté, Morvan, Noury and Paterne2001; Smith et al. Reference Smith, Bird, Turney, Fifield, Santos, Hausladen and di Tada2001). The main difficulty is posed by unremoved contaminants which might influence the measured 14C age and prohibit a robust 14C age determination, particularly for dating old samples close to the dating limit of 14C. Several studies have reported apparently too young ages for samples analyzed after ABA treatment, both for charcoal samples (Gillespie et al. Reference Gillespie, Hammond, Goh, Tonkin, Lowe, Sparks and Wallace1992; Gillespie Reference Gillespie1997; Bird et al. Reference Bird, Ayliffe, Fifield, Turney, Cresswell, Barrows and David1999; Smith et al. Reference Smith, Bird, Turney, Fifield, Santos, Hausladen and di Tada2001; Higham et al. Reference Higham, Brock, Peresani, Broglio, Wood and Douka2009a; Wood et al. Reference Wood, Douka, Boscato, Haesaerts, Sinitsyn and Higham2012; Bird et al. Reference Bird, Levchenko, Ascough, Meredith, Wurster, Williams, Tilston, Snape and Apperley2014) as well as for wood and paleosol samples (Hatté et al. Reference Hatté, Morvan, Noury and Paterne2001). Thus, alternative pretreatment protocols proposed to improve decontamination include the ABOX wet oxidation (acid-base-oxidation) procedure, mostly combined with stepped-combustion (Bird et al. Reference Bird, Ayliffe, Fifield, Turney, Cresswell, Barrows and David1999; Smith et al. Reference Smith, Bird, Turney, Fifield, Santos, Hausladen and di Tada2001), hydrogen pyrolysis (e.g., Ascough et al. Reference Ascough, Bird, Brock, Higham, Meredith, Snape and Vane2009), and the use of a stronger acid for the final acid wash (Hatté et al. Reference Hatté, Morvan, Noury and Paterne2001). However, the efficiency of these methods is not entirely unambiguous. Studies by Santos and Ormsby (Reference Santos and Ormsby2013) and Hajdas et al. (Reference Hajdas, Hendriks, Fontana and Monegato2016) on radiocarbon dating of old wood samples found that the ABA treatment, in comparison with other preparation methods, is absolutely adequate to reproduce accurate results.
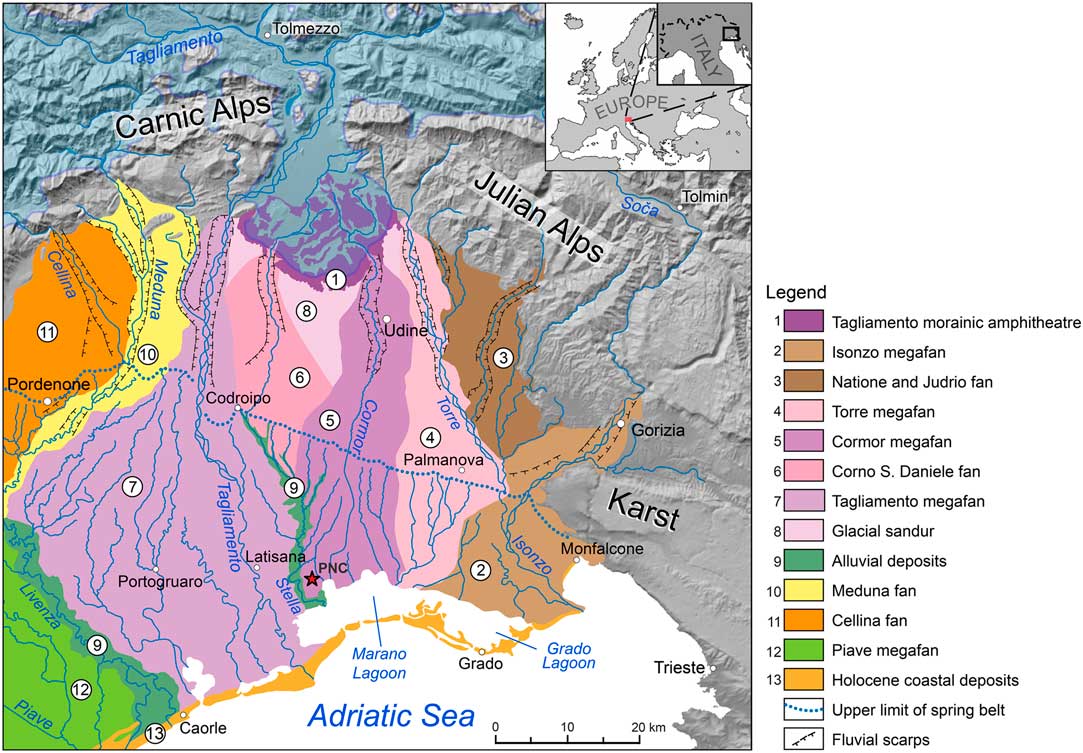
This study was designed to attain two goals: (1) to test the effect of various laboratory pretreatment methods (ABA vs. two ABOX procedures) on 14C ages obtained from peat, and (2) to establish a detailed chronology of fluvial and glaciofluvial sediment deposition on the Southern Alpine alluvial plain based on high-resolution 14C dating of peat and macrofossils. We focus our research on the Tagliamento glacier system (Figure 1). Although this system represents a reference for the reconstruction of LGM glacier evolution in the Southern Alps as well as on the European scale (Luetscher et al. 2015; Monegato et al. Reference Monegato, Scardia, Hajdas, Rizzini and Piccin2017), a detailed chronostratigraphy from the alluvial plain connected to the Tagliamento palaeoglacier is not available so far. Previous research has concentrated on the chronology of the Tagliamento megafan (Pini et al. Reference Pini, Ravazzi and Donegana2009). Attempts to extent the ages even beyond the radiocarbon dating limit using OSL dating of fine grained quartz have proven difficult, especially for the period >70 ka (Lowick et al. Reference Lowick, Preusser, Pini and Ravazzi2010). For the Cormor megafan investigated here, only a few isolated radiocarbon ages are available (Fontana et al. Reference Fontana, Monegato, Zavagno, Devoto, Burla and Cucchi2014b).
Alluvial systems of Friulian plain and the eastern portion of the Venetian Plain (after Fontana Reference Fontana2006, 2014b). The red star marks the coring site of the investigated drilling core PNC1. The light blue color represents the maximum ice extent during the LGM after Ehlers et al. (Reference Ehlers, Gibbard and Hughes2011). (See online version for color.)

STUDY Location
From the southern Alpine foreland, a number of long stratigraphic cores are available. The drilling core PNC1 investigated in this study was taken at the locality of Marianis, near the village of Piancada (coring location: lat. 45°46'N, lon. 13°06'E; elevation +1.4 m asl). close to the Lagoon of Marano (Figure 1). This area is part of the Venetian-Friulian Plain, NE Italy, which consists of Pliocene to Quaternary sediments deposited on the subsiding foreland basin of the southeastern Alps (Carminati et al. Reference Carminati, Doglioni and Scrocca2003). The Venetian-Friulian Plain is characterized by huge alluvial landforms described as alluvial megafans that have mainly formed during the Last Glacial Maximum (LGM) and partly also during the Holocene (Figure 1; Fontana et al. Reference Fontana, Mozzi and Marchetti2014a). Although the formation of these megafans was favored by the tectonic setting, the rate and character of sedimentation has been largely controlled by changes in climate and glacio-eustatic variations governed by the Late Pleistocene glaciations (Fontana et al. Reference Fontana, Mozzi and Bondesan2008; Toscani et al. Reference Toscani, Marchesini, Barbieri, Di Giulio, Fantoni, Mancin and Zanferrari2016). Previous studies provided detailed information on the geomorphology as well as the subsurface sedimentological setting of the plain (e.g., Paiero and Monegato Reference Paiero and Monegato2003; Fontana Reference Fontana2006; Fontana et al. 2008, 2010, Reference Fontana, Mozzi and Marchetti2014a; Zanferrari et al. Reference Zanferrari, Avigliano, Fontana and Paiero2008a, Reference Zanferrari, Avigliano, Monegato, Paiero and Poli2008b).
The PNC1 coring site is in the distal sector of the alluvial megafan of the Cormor River (Figure 1), which was one of the four outwashes fed by the Alpine Tagliamento glacier during the LGM (Castiglioni Reference Castiglioni1997; Fontana et al. Reference Fontana, Monegato, Zavagno, Devoto, Burla and Cucchi2014b). In phases of maximum ice extent during the Pleistocene glaciations, the Tagliamento glacier repeatedly reached onto the piedmont plain creating an extensive set of moraine ridges known as the Tagliamento morainic amphitheater (Figure 1; Paiero and Monegato Reference Paiero and Monegato2003; Monegato et al. Reference Monegato, Ravazzi, Donegana, Pini, Calderoni and Wick2007). With the withdrawal of the Tagliamento glacier from its maximum ice extent at the end of the LGM, the Cormor entrenched into the glaciofluvial sediments previously deposited during glacier advance. This led to a decoupling of large parts of the Cormor megafan from the active system and to an almost complete abandonment of the megafan surface after about 19 ka BP (Fontana et al. Reference Fontana, Monegato, Zavagno, Devoto, Burla and Cucchi2014b).
In the distal sector of the Venetian-Friulian Plain, layers of peat or organic-rich sediment within the LGM clastic deposits are fairly common in the first 20–30 m of subsoil and some display a significant lateral continuity. These layers are also documented in the subsoil of the Cormor megafan, and their formation has been associated with the existence of ponds or fens in temporarily inactive sectors of the megafan that allowed for an in situ accumulation of macrophytes. Peat deposition was sustained by the shallow depth of the groundwater table (within the uppermost 2 m) and by inhibited drainage of the closed basins formed, e.g., between the fluvial ridges (Miola et al. Reference Miola, Bondesan, Corain, Favaretto, Mozzi, Piovan and Sostizzo2006; Rossato and Mozzi Reference Rossato and Mozzi2016). With the reactivation of (glacio-) fluvial sedimentation the organic deposits were buried and preserved.
MATERIAL AND METHODS
Sampling and Material Selection
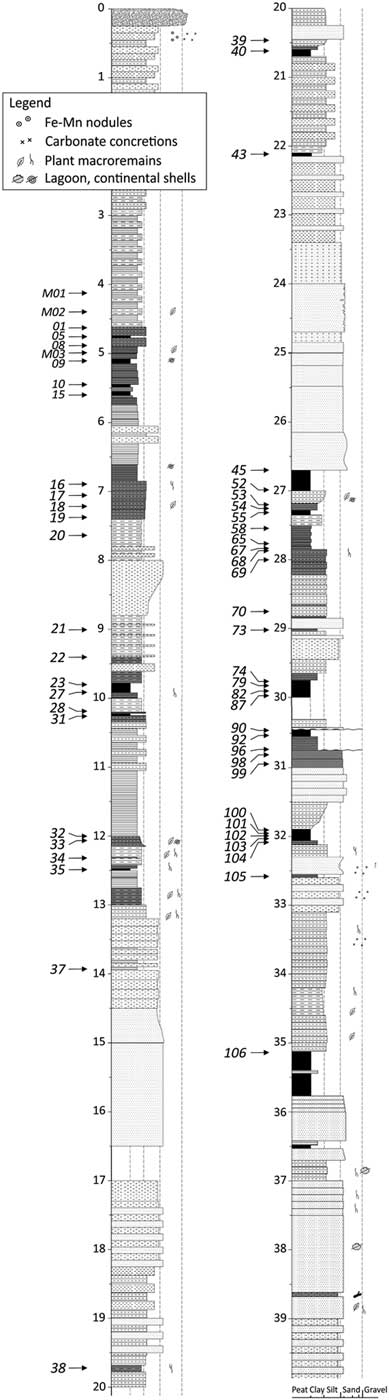
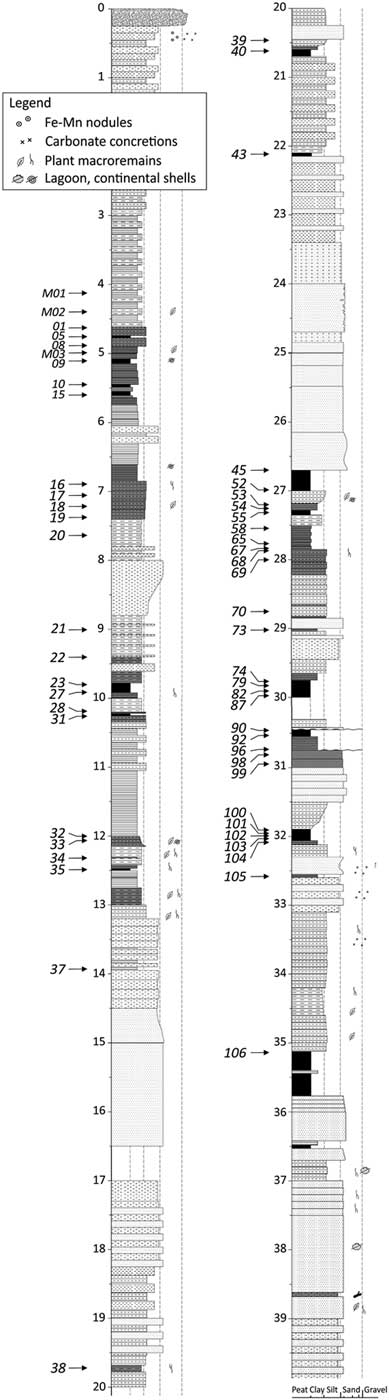
The PNC1 core was drilled by a mechanical probe Atlascocpo with a simple core sampler (Ø 88 mm) and reached a total depth of 65 m. Coring operations were carried out in June 2008 and the cores were immediately enveloped in nylon sheets and stored in the refrigerated room of the Department of Mathematics and Geosciences at the Trieste University. Datable material was taken from the 4–36 m interval and a detailed log of the uppermost 40 m of the core, including the position of all analyzed samples, is illustrated in Figure 2. While the first 4.5 m of the core consists of sands and silts almost without organic material, the interval between 4.5 m and 13 m contains frequent humic silt horizons and peat layers. These peat layers have mostly a thickness of few centimeters to decimeters. The large section between 13 m and 26.7 m depth contains few peat layers embedded between massive sand to silt deposits. The latter include sporadic plant macrofossils. Between 26.7 and 35.8 m depth, the stratigraphic sequence is formed by silty to fine sandy sediments which frequently alternate with thick peat horizons and organic-rich deposits. This interval represents alluvial sediments of MIS 3 to MIS 4. Below 35.8 m depth, lagoon and shallow marine deposits of the last interglacial are present.
Stratigraphic log of the radiocarbon dated section of the PNC1 drilling core showing sampling depths; sample IDs are given as PNC1-x (Table 2).
Samples of 1–4 cm thickness were taken with sampling distances from few centimeters within compact peat sections to some decimeters in organic-poorer sediment intervals. Generally, at least one sample was analyzed from each peat layer. For peat sections thicker than 10 cm, a top and bottom sample from each section was analyzed as well as additional samples in between where feasible. Altogether, we analyzed 59 samples which were separated into 139 sample fractions (=subsamples) of peat and plant macrofossils. All samples were disaggregated in MQ water and washed over 63 µm and 500 µm sieves. Peat samples were separated into two peat fractions: (1) a coarser fraction with organic material larger than 500 µm, and (2) a fraction of finer organics of 63–500 µm size. Whenever possible, macroremains were additionally extracted from the peat to investigate possible age discrepancies between the individual sample fractions. Macroremains were also extracted from silty-clayey sediment samples and include reed, mosses, seeds as well as unidentified macrofossils.
Laboratory Pretreatment and Measurement Procedures
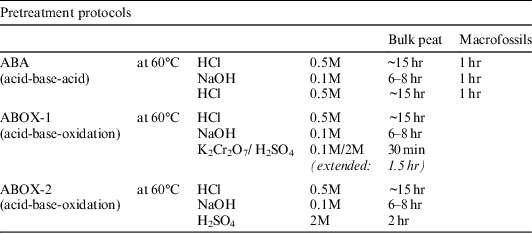
To evaluate the efficiency of different laboratory pretreatment methods and their effect on 14C ages of peat samples, two wet oxidation pretreatment procedures (here termed ABOX-1 and ABOX-2) following the protocols of Bird et al. (Reference Bird, Ayliffe, Fifield, Turney, Cresswell, Barrows and David1999) and Hatté et al. (2001) were tested in comparison to the ABA method (Table 1). All three pretreatment protocols consisted of three cleaning steps. The first cleaning step applied hydrochloric acid (0.5 M HCl) for about 15 hr (overnight) to remove carbonates. This was followed by a base step (0.1 M NaOH) with reaction times of 6–8 hr to eliminate humic acids. For the standard ABA treatment, the third step consisted of another wash with 0.5 M HCl for ~15 hr to remove any atmospheric CO2 introduced during the prior base step. The ABOX-1 treatment applied an oxidation step for the final acid wash using a mixture of 0.1 M K2Cr2O7 and 2 M H2SO4. Samples were left for oxidation for about 30 min which is significantly shorter than proposed by other lab protocols (Bird et al. 1999, Reference Bird, Levchenko, Ascough, Meredith, Wurster, Williams, Tilston, Snape and Apperley2014) but necessary to retain sufficient organic material for analysis. A longer reaction time of 1.5 hr (ABOX-1-ext) was tested for two samples but showed a significant degradation and dissolution of the peat. For the alternative ABOX-2 treatment, the final acid step was performed with a 2 M H2SO4 solution and a reaction time of 2 hr (after Hatté et al. Reference Hatté, Morvan, Noury and Paterne2001). Each chemical reaction step took place in an oven at 60°C with samples being washed neutral with MQ water after each step.
Summary of the different chemical pretreatment techniques applied in this study.

Out of 52 analyzed peat samples, 17 have been cleaned parallel with the ABA and ABOX-1 treatment, five of those additionally also with the ABOX-2 treatment. One sample has been treated parallel with ABA and ABOX-2; the remaining peat samples have been subject to ABA pretreatment only. If available, ABA and ABOX pretreatments were performed on both peat fractions, the 63–500 µm as well as the >500 µm peat fraction. Macrofossil samples and subsamples are very fragile and were cleaned with the ABA treatment only, mostly using chemical reaction times as short as one hour for each step (Table 1; Hajdas Reference Hajdas1993). After chemical pretreatment, samples were dried in an oven at 60°C before being weighed and wrapped into tin cups for combustion and graphitization. Sample sizes for peat and macroremains were about 4.5–5.0 mg and ~2.5 mg (if available), respectively, to provide an equivalent of 1 mg carbon. Samples were combusted in an Elemental Analyser and subsequently graphitized in the fully automated graphitization system AGE (Wacker et al. Reference Wacker, Nemec and Bourquin2010) where reduction of the extracted CO2 gas was performed by addition of H2 (and Fe powder as catalyst) and heating to 580°C. Graphite samples were pressed into aluminium targets and measured at the MICADAS AMS facility at ETH Zurich (Synal et al. Reference Synal, Stocker and Suter2007). Measured 14C/12C ratios were normalized to the Oxalic Acid II standard and corrected for blank and isotopic fractionation (δ13C measured on graphite). Radiocarbon ages were determined following the convention of Stuiver and Polach (Reference Stuiver and Polach1977).
Age Calibration
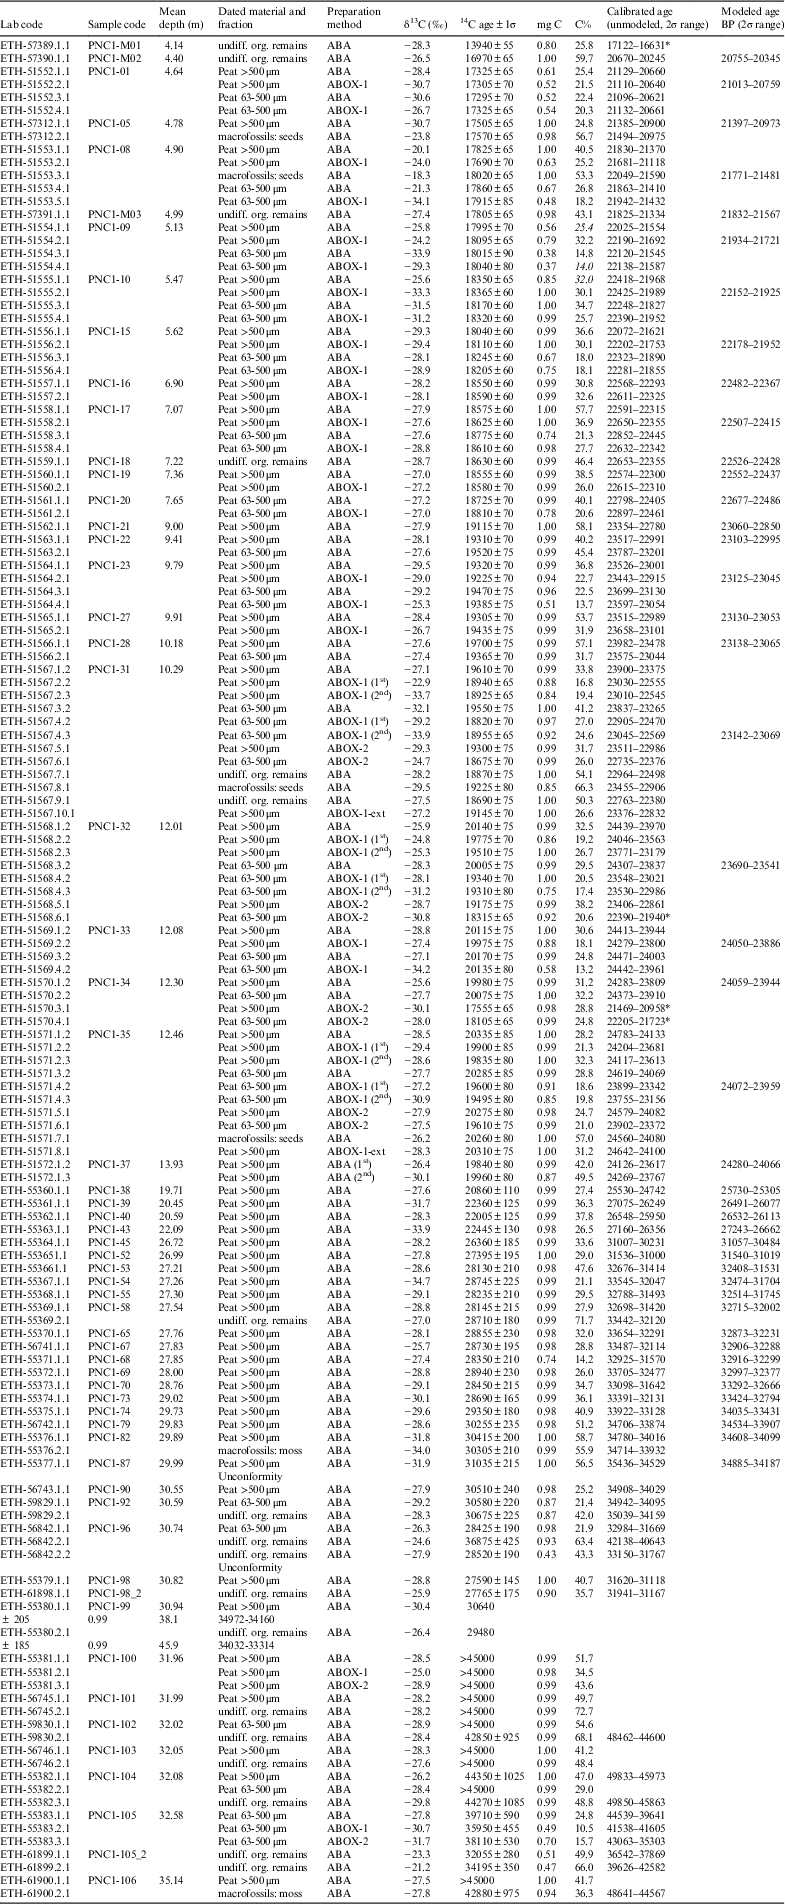
All processed samples are listed in Table 2 providing the sampling depth within the core, the type of the dated material, the sample fraction, the applied pretreatment method, the obtained radiocarbon age, and the calibrated and modeled age range. Analyses marked as “1st” and “2nd” denote that these subsamples have been split again after pretreatment. The clean sample material was separated prior to graphitization and further processed and measured as two individual subsamples. Since results for 6 out of 7 of these split subsamples agree within 1σ, the other one within 2σ, any bias due to the graphitization process can be excluded. Calibration of the 14C ages was done with OxCal v 4.2 using the IntCal13 calibration curve (Ramsey Reference Ramsey2009; Reimer et al. Reference Reimer, Bard, Bayliss, Beck, Blackwell, Ramsey, Buck, Cheng, Edwards, Friedrich, Grootes, Guilderson, Haflidason, Hajdas, Hatte, Heaton, Hoffmann, Hogg, Hughen, Kaiser, Kromer, Manning, Niu, Reimer, Richards, Scott, Southon, Staff, Turney and van der Plicht2013). For ages obtained within 4.4–30.0 m depth, a Bayesian approach using a Poisson based deposition model was applied to develop the age-depth model of the core (Ramsey Reference Ramsey2008).
Radiocarbon ages obtained for the PNC1 drilling core. Subsample ages marked with an asterisk as well as all samples below 30 m core depth were excluded from calculation of the sediment deposition model.

RESULTS AND Discussion
Radiocarbon Ages in the Stratigraphic Context
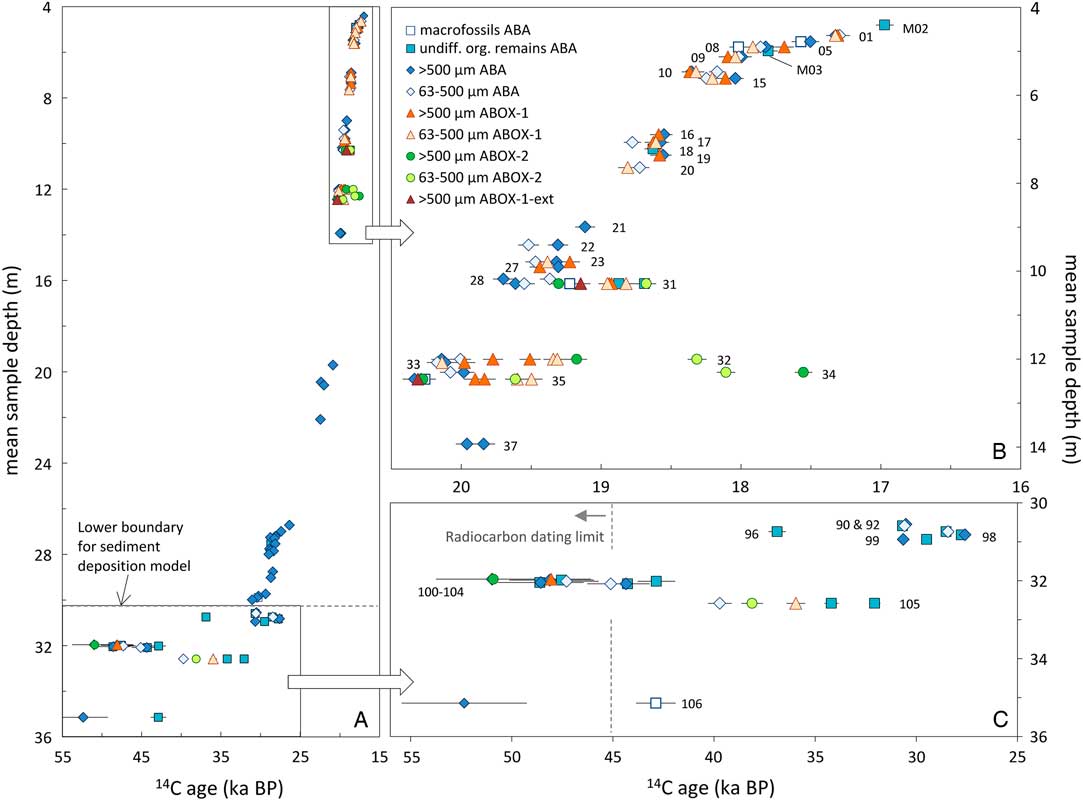
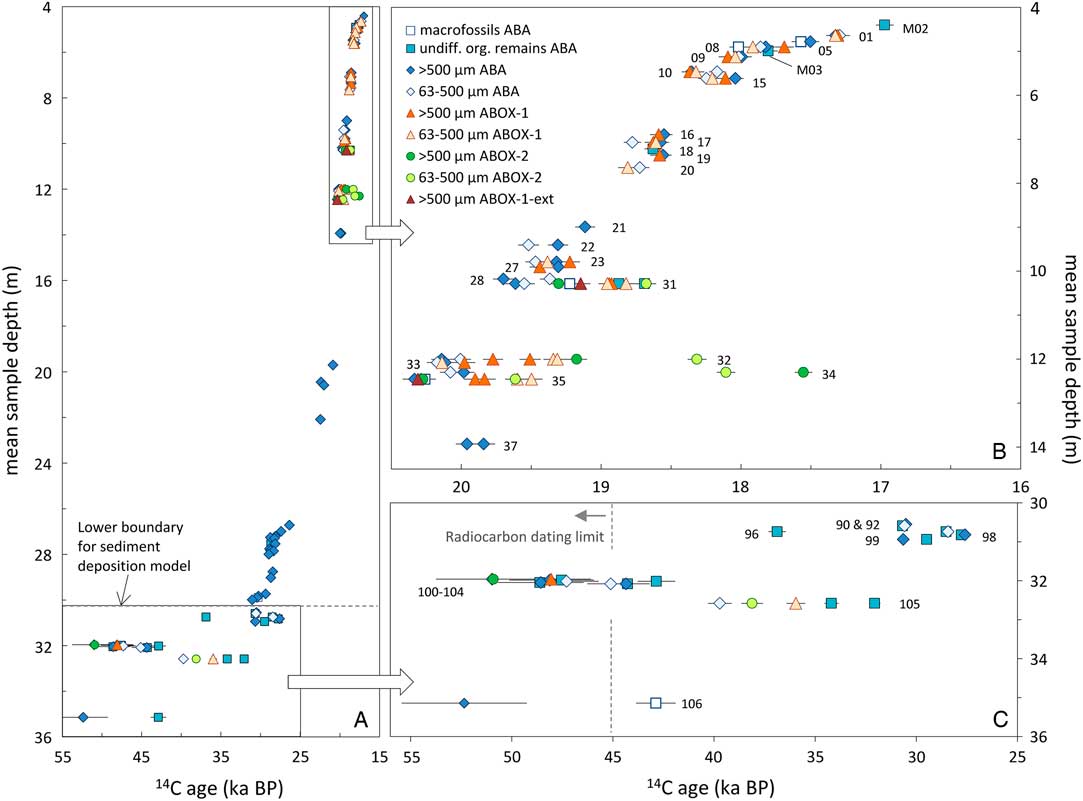
Ages obtained from peat samples range from 17,295±70 14C yr BP at 4.64 m (PNC1-01, 4.64 m) to >45,000 14C yr BP at about 32 m (Figure 3). The two topmost samples retrieved from the core consist of a mix of inseparable, unidentified organic remains yielding ages of 16,970±65 14C yr BP (PNC1-M02, 4.40 m) and 13,940±55 14C yr BP (PNC1-M01, 4.14 m). The latter age is interpreted to result from a younger rootlet. The sample consisted only of few isolated plant remains not embedded into a peat layer. It largely predates the upper peat ages from the PNC1 core as well as other ages constraining the deactivation of the Tagliamento fluvioglacial system and the deactivation of Cormor megafan (cf. Fontana et al. Reference Fontana, Monegato, Zavagno, Devoto, Burla and Cucchi2014b). Moreover, at this time the Tagliamento River was already incising into the glaciofluvial deposits along the western sector of its megafan. For all samples above 10 m core depth, individual subsample ages show a very good agreement without any systematic age trend with regard to the peat particle size or the applied pretreatment method. Results of samples below 10 m depth show a significantly larger variation in their individual ages (Figure 3). However, above the two major discontinuities located at 30.5 and 30.8 m depth, the obtained ages are generally in good agreement with the stratigraphic order (within their 2σ errors; Figure 3A). It is important to note that the scatter in the 14C ages obtained on subsamples in the uppermost 30 m of the core has no significant effect on the final calendar chronology (Table 2), both using the sediment deposition model approach as well as simple data calibration. Below 30 m depth, several significant age inversions occur which strongly point at material reworking and surface erosion. Thus, samples below 30 m depth (below sample PNC1-87) were excluded from the chronology of sedimentation calculated by the deposition model.
Uncalibrated 14C ages (with 1σ error bars) obtained for different sample fractions and variable laboratory pretreatment protocols (cf. Table 1). Small numbers next to the data points denote the sample ID as PNC1-x. Panels B and C represent a larger view on the uppermost and lowermost dated core sections. The data points between 14 and 30 m core depth are only shown in panel A.
A most important aspect in the discussion and interpretation of the obtained 14C ages from peat is the intrinsic heterogeneity of some peat samples. Peat is a compound of various organic particles of different sizes and sometimes also different ages that have grown or accumulated at the site of deposition over a certain time span (cf. Kilian et al. Reference Kilian, van der Plicht and van Geel1995; Nilsson et al. Reference Nilsson, Klarqvist, Bohlin and Possnert2001; Blaauw et al. Reference Blaauw, van der Plicht and van Geel2004). Reworking and erosion of peat or other organic remains farther upstream can lead to an incorporation of older components into younger peat deposits forming downstream. Such mixing of material of different ages is more likely to occur in peat partly affected by pedogenetic degradation or in peat containing some amount of clastic input than in (nearly) purely organic peat deposits, which are formed mainly disconnected from the active channel. On the other hand, the formation of a peat layer over several hundreds to thousands of years implies that roots from plants growing at the surface can penetrate into lower layers and introduce young organic material into the older subsurface peat deposit. Other bioturbation processes like animal burrow activity can generate further complex subsoil mixing. In general, if evident traces of erosion and pedogenesis are absent, radiocarbon ages obtained from the top of a peat section are considered to provide an estimate on the onset of sedimentation sealing the peat. Ages from the bottom of a peat section supposedly represent the end of clastic sedimentation, however, taking into consideration a possible time gap between the final clastic input and the beginning of plant accumulation (cf. Törnqvist and Van Dijk Reference Törnqvist and Van Dijk1993).
ABA vs. ABOX Pretreatment
Different trends in age distribution with regard to the three applied pretreatment protocols can be observed. The good agreement between individual subsample ages from the uppermost 10 m of the core, with ages around 19–17 14C ka BP, suggests an excellent and equally efficient performance of the ABA and ABOX-1 cleaning methods for peat material (ABOX-2 was not used on samples within that core section). Below 10 m core depth, age variations point at two major observations. First, the ABA dates are nearly consistently older than ABOX-1 dates. For example, age discrepancies of about 800 years between the oldest ABA and youngest ABOX-1 age were found for samples PNC1-31, PNC1-32, and PNC1-35 (Figure 3B). Secondly, there appears to be a better general agreement between individual ABA ages from a set of subsamples compared to individual ages obtained for ABOX-1. With one exception (PNC1-28), ABA-treated peat of both particle sizes show identical ages within 2σ. In contrast, peat subsamples treated with ABOX-1 show larger age discrepancy (Figure 3B).
Results for the ABOX-2 pretreatment show a similar trend as for ABOX-1, yielding an even more pronounced discrepancy of the 14C ages for 7 out of 10 analyses with ABOX-2 ages up to 2000 years younger than their corresponding ABA ages (Figure 3). Only for three analyses, the ABOX-2 ages agree with the ABA result within 2σ (PNC1-35, PNC1-100, PNC1-105). Noticeably, the discrepancy between individual subsample ABOX-2 ages (up to 860 years) even exceeds the variability observed for the ABOX-1 treatment. The variable degree of rejuvenation of 14C ages after both ABOX treatments points to the internal heterogeneity of the dated peat samples and a preferential dissolution of older and more fragile organic components by the more aggressive treatment applied in the final ABOX acid steps. The K2Cr2O7+H2SO4 solution as well as the H2SO4 alone have a much stronger corrosive effect on peat than the HCl applied during ABA pretreatment and seem to particularly degrade the older components while younger material can survive longer. The intense degradation of peat by K2Cr2O7+H2SO4 was demonstrated in tests performed on subsamples of PNC1-31 and PNC1-35 allowing longer reaction times (than the usually applied 30 min) for the final ABOX-1 step. Both samples were soaked in K2Cr2O7+H2SO4 for 1.5 and 5 hr, respectively, resulting in a complete dissolution of the peat after the 5 hour period. For samples left to oxidation for 1.5 hr the degradation was still significant but left just enough material for 14C analysis (Table 2). For comparison, Bird et al. (Reference Bird, Ayliffe, Fifield, Turney, Cresswell, Barrows and David1999) reported oxidation of charcoal in K2Cr2O7+H2SO4 of usually 14–24 hr (occasionally up to 72 hr).
Although previous studies found the ABOX pretreatment methods more effective in removing contamination for charcoal, wood, and paleosol samples (e.g., Bird et al. 1999, Reference Bird, Levchenko, Ascough, Meredith, Wurster, Williams, Tilston, Snape and Apperley2014; Hatté et al. Reference Hatté, Morvan, Noury and Paterne2001; Santos et al. Reference Santos, Bird, Pillans, Fifield, Alloway, Chappell, Hausladen and Arneth2001; Higham et al. Reference Higham, Brock, Peresani, Broglio, Wood and Douka2009a; Wood et al. Reference Wood, Douka, Boscato, Haesaerts, Sinitsyn and Higham2012), our findings indicate a very good cleaning efficiency of the ABA treatment for peat. Here, we applied a low-strength, long reaction procedure for ABA. In comparison, studies reporting insufficient decontamination by ABA have often used higher-strength but short-reaction procedures (Hatté et al. Reference Hatté, Morvan, Noury and Paterne2001; Higham et al. Reference Higham, Barton, Turney, Barker, Ramsey and Brock2009b; Wood et al. Reference Wood, Douka, Boscato, Haesaerts, Sinitsyn and Higham2012; Bird et al. Reference Bird, Levchenko, Ascough, Meredith, Wurster, Williams, Tilston, Snape and Apperley2014). The switch from ABA to ABOX, however, did in some cases not just involve the replacement of the final HCl acid step by K2Cr2O7+H2SO4 but also replaced the two previous steps with significantly stronger acid and base reagents as well as longer reaction times (e.g., Higham et al. Reference Higham, Barton, Turney, Barker, Ramsey and Brock2009b; Wood et al. Reference Wood, Douka, Boscato, Haesaerts, Sinitsyn and Higham2012). This suggests that an overall more rigorous sample treatment might be needed to obtain a sufficient decontamination with both, the ABA and ABOX pretreatment methods.
Dating Peat vs. Macroremains
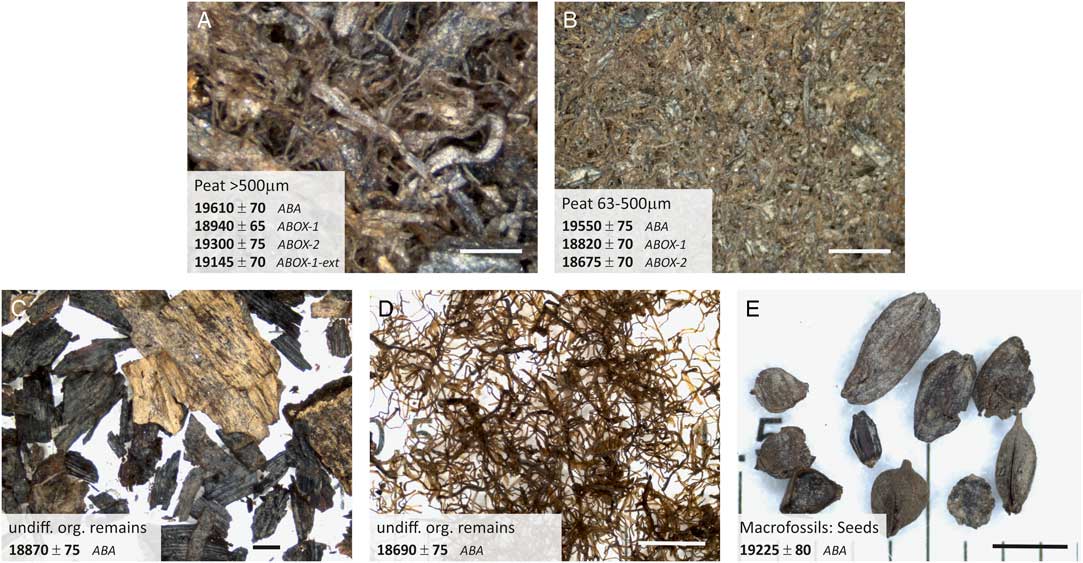
The comparison of peat ages with results for separated macroremains from the same sample provides no clear trend in the age distribution. While most analyses of macrofossils yielded results identical to the associated peat data, few significantly older as well as younger ages for macrofossils also occur. Seeds extracted from the dense peat sections within the uppermost core part (samples PNC1-05, 4.78 m, and PNC1-08, 4.90 m) show consistent ages suggesting very homogenous peat layers. Similar good agreement is found for fragments of reed and briophytes extracted from the peat samples PNC1-58 and PNC1-82, respectively, both collected from ~30 cm thick peat sections at 27.54 m and 29.89 m depth. In contrast, significant differences between the ages of different mixed assemblages of macroremains extracted from a peat layer at 10.29 m depth is recorded in sample PNC1-31 (Figure 4). Individual subsample ages vary by more than 500 years and are all younger by about 900–350 years than the associated peat ages of 19,610±70 and 19,550±75 14C yr BP (ABA), respectively. These notably younger ages from undifferentiated macroremains, that correspond to ages occurring about 1 to 2.5 m higher up in the stratigraphic section, are considered to result from later infiltration of younger organic components into the previously deposited peat. Common sources of contamination are roots that can penetrate deep into the subsurface and thereby introduce too young 14C ages in older layers. The comparatively young age of 18,690±75 14C yr BP from one mixture of macroremains isolated from sample PNC1-31 clearly advocates infiltration and contamination by roots (Figure 4D). In comparison, separated seeds provided a significantly older age (19,225±80 14C yr BP) illustrating the advantage of dating clearly identifiable and separable macrofossils that can be well cleaned from rootlets or other contaminating organic fragments.
Sample fractions separated from sample PNC1-31 (12.01 m depth) with their uncalibrated 14C ages (±1σ); the scale bar is 1 mm. For both peat fractions (A and B), variable laboratory pretreatment methods were applied. Younger ages for separated mixed macroremain assemblages reveal contamination of the samples by younger roots (or other organic compounds).
The incorporation of reworked older material is suspected for sample PNC1-96 (30.74 m depth). Few small pieces of black, charcoal-like material could be isolated and dated to be nearly 800 years older (36,875±4255 14C yr BP) than the peat and extracted macroremains that provided indistinguishable ages of 28,475±135 and 28,425±190 14C yr BP, respectively. Interestingly, an overall good consistency between ages from peat and extracted macroremains is observed within the ~35 cm thick peat layer at around 30.5 m depth. However, individual samples from this narrow section show a significant spread in ages (Figure 3C) indicating substantial compaction of material of different ages. Large age discrepancies over several 1000 years between peat and macroremains continue further downwards in the core for the lowermost samples (below 32 m depth). Since some of the ages scatter around the radiocarbon dating limit, an interpretation of the obtained age range is difficult.
Chronology of Sediment Deposition
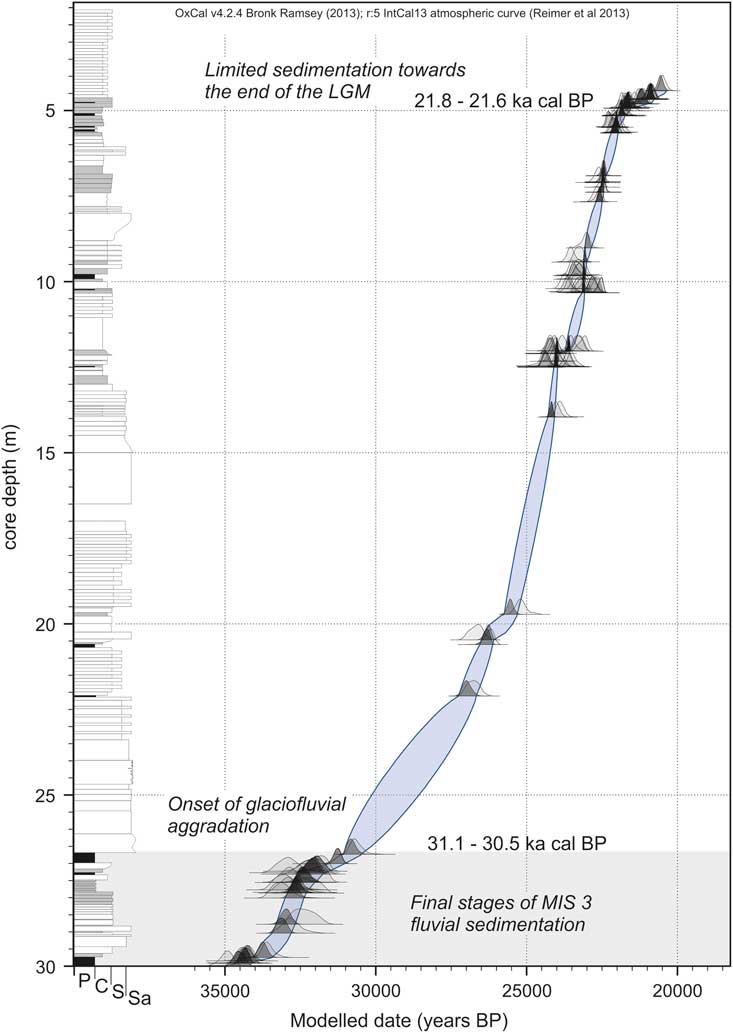
Despite the effect of sample heterogeneity on peat radiocarbon ages, which is evident from the impact variable pretreatment had on the obtained 14C ages, high-resolution sampling allowed establishing an age-depth model (Figure 5), which comprises all age data from 4.4–30.0 m depth (excluding three outliers, see Table 2) regardless of the applied pretreatment method and/or sample fraction. The resulting robust chronology provides the timing for the sedimentary buildup of the Cormor megafan.
Deposition model for the uppermost 30 m of the PNC1 core; calculated using OxCal v 4.2 (Ramsey 2008, Reference Ramsey2009). Samples from below 30 m depth were excluded because of supposed gaps in the sedimentary sequence. Furthermore, a total of three very young ages obtained for samples PNC1-32 and -34 were excluded as outliers from the deposition model (see Table 2 and Figure 3B) as well as the uppermost dated sample (PNC1-M01). P=peat, C=clay, S=silt, Sa=sand.

Sedimentation from 30 m depth onwards initially reflects a fluvial environment and is characterized by continuous and rapid deposition of organic-rich clays and silts and the formation of several thick (up to 30 cm) peat layers between about 34.5 ka and 30.8 ka cal BP (PNC1-87 to PNC1-45, 29.99–26.72 m). The end of MIS 3 fluvial sedimentation is marked by a prominent peat layer accumulated at around 31 ka cal BP, which formed at least over several hundred years (PNC1-52 to PNC1-45, 26.99–26.72 m). The first occurrence of glaciofluvial sediment in the distal portion of the alluvial plain is dated to 31.1–30.5 ka cal BP (above 26.72 m in the core). This age is in close agreement with the age of 31.9–30.5 ka cal BP (recalibrated after Monegato et al. Reference Monegato, Ravazzi, Donegana, Pini, Calderoni and Wick2007), which is associated with the onset of sedimentation at the proximal belt of the Tagliamento sandur, just before the glacier reached the plain and prior to the formation of the morainic amphitheater (cf. Monegato et al. 2007, Reference Monegato, Scardia, Hajdas, Rizzini and Piccin2017; Figure 1). At that time, the Tagliamento River was probably flowing more in a N-S direction, almost at the center of the Friulian Plain (Monegato et al. Reference Monegato, Ravazzi, Donegana, Pini, Calderoni and Wick2007). In this setting it is likely that the Tagliamento River was directly connected to the PNC core site whereas the Cormor River was a minor stream and did not yet significantly aggrade the Cormor megafan. Following the initial stage of glaciofluvial deposition (ca. 31–26 ka cal BP), a phase of apparent stagnation is suggested at 26.5–26.1 ka cal BP (PNC1-39, 20.45 m). This could possibly relate to the onset of Cormor megafan sedimentation after the buildup of the morainic amphitheater and the westward movement of the Tagliamento River towards its present position. An increase in sedimentary activity, thus a pulse in activity of the Tagliamento glacier at the morainic amphitheater, is indicated by the deposition of massive glaciofluvial sands and silts starting from 25.7–25.3 ka cal BP (PNC1-38, 19.71 m). The occurrence of a peat layer at ~12.4 m core depth marks a pronounced shift in the sedimentation regime and a break in sediment activity at ca. 24 ka cal BP. A sharp drop in ages of several hundred years within a few centimeters reflects a sedimentary hiatus allowing for a prolonged time interval of plant growth and accumulation uninterrupted by clastic input. Between ca. 24 to 21.6 ka cal BP, our data record almost continuously ongoing glaciofluvial sedimentation dominated by organic-rich, silty sediments. This time interval is consistent with the final glacier advance of the LGM recorded for the Southern Alps (Rossato and Mozzi Reference Rossato and Mozzi2016; Monegato et al. Reference Monegato, Scardia, Hajdas, Rizzini and Piccin2017).
After about 22 ka cal BP (from 5 m upwards in the core) an increase in peat accumulation and the formation of organic-rich, clayey-silty layers occurred concurrently to an abrupt decrease of clastic input. The uppermost peat layer within the PNC1 core (4.90–4.64 m) provided an age range of ca. 21.6 to 20.9 ka cal BP (PNC1-08 to PNC1-01) from bottom and top, respectively, indicating more than 700 years of time for peat formation, thus a period of quiescence in glaciofluvial sedimentation. The peat is overlain by sediments of floodplain facies those dates give the maximum age of floodplain activity and represent the final period of glaciofluvial aggradation from the Tagliamento glacier (cf. Fontana et al. Reference Fontana, Monegato, Zavagno, Devoto, Burla and Cucchi2014b). Macroremains isolated from the silty sediment 25 cm above the peat layer provide an age of 20.8–20.3 ka cal BP (PNC1-M02) and are attributed to the ultimate glaciofluvial sedimentation within the channel that continues in an identical sedimentation style further upwards, possibly for another several hundred to thousand years. The uppermost 4 m of the stratigraphic succession were deposited at about 21–20 ka cal BP and were closely followed by the abandonment of the Cormor megafan because of the withdrawal of the Tagliamento glacier from the end moraine system (cf. Fontana et al. Reference Fontana, Monegato, Zavagno, Devoto, Burla and Cucchi2014b).
Some of the shorter sedimentary breaks documented in PNC1 core could potentially also relate to shifting of the active channel belt of Cormor River due to avulsion processes that control the formation of this large cone-shaped alluvial landform. Thus, to clearly distinguish a regional climate signal (e.g., a temporary glacier retreat) from a local sedimentary hiatus it needs similar chronologies from other cores in different sectors of the Cormor megafan as well as further megafans connected to the Tagliamento glacier to compare with the PNC1 sequence. However, comparatively detailed chronologies are not yet available for any core from this region.
Conclusions
Our results clearly show that establishing a robust chronology from peat embedded in a sedimentary sequence requires a careful selection of the organic material used for dating as well as an adequate number of analyses to recognize age variations due to the inherent heterogeneity of the peat. Although sample heterogeneity yielded a significant spread of radiocarbon ages for the different types of macroremains or sample fraction chosen for analysis, ages from bulk peat samples with organic particles >500 µm provided the most consistent age data. Comparison of different laboratory pretreatment methods (ABA vs. two different ABOX methods) for cleaning peat prior to radiocarbon analysis suggests that the ABA procedure is fully adequate to remove contamination and to provide robust and reproducible age results. Younger ages repeatedly obtained after wet oxidation imply that these chemically stronger cleaning procedures might preferentially dissolve older and potentially more corroded components from the peat.
The detailed chronology of fluvial and glaciofluvial sedimentation in the distal Cormor megafan shows a good agreement with the timing of glacier activity recorded at the Tagliamento morainic amphitheater. This indicates a close coupling between proximal and distal sectors of the alluvial megafan and demonstrates the immediate transfer of the climate signal along the megafan. The prominent peat intervals dated within the PNC1 drilling core demonstrate highly variable time intervals of peat accumulation ranging from presumably only a few decades to several hundred and up to more than a thousand years. This suggests a relative stability in climate conditions as well as in fluvial channel position in the distal portion of the Cormor alluvial megafan which allowed prolonged plant growth in fens and wetlands without burial by floodplain clastic sediment. The PNC1 core is the only core from the southern Alpine foreland for which the deposition chronology is now established with unprecedented detail. Our record therefore provides a first reference for establishing a detailed LGM subsoil chronology for the entire foreland plain and represents an important proxy to improve the reconstruction of glacier fluctuations during the last glacial cycle.
Acknowledgments
The authors thank Giorgio Fontolan and Fabrizio Antonioli for the possibility to study the PNC1 core, which was collected in the framework of the Project VECTOR (VulnErability of the Italian coastal area and marine Ecosystems to Climatic changes and Their rOle in the Mediterranean caRbon cycles). The Ente Regionale Sviluppo Agricolo of Friuli Venezia Giulia is acknowledged for allowing to core in the area of Tenuta Marianis. We thank Mantana Maurer, Carol Biechele, and Maria Belen Röttig for their help in laboratory and Lukas Wacker for his support in performing the AMS measurements. This work was supported by the COST Action ES0907.