INTRODUCTION
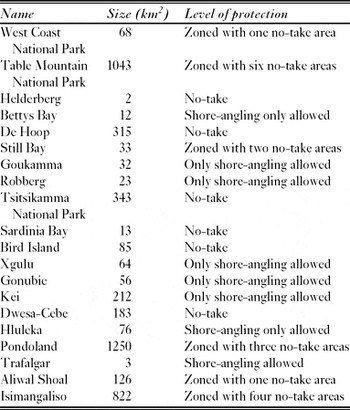
South Africa's Marine Living Resources Act (1998) has been used to establish 20 marine protected areas (MPAs), aimed at protecting marine biodiversity (Table 1). These cover 0.35 % of the 10 71 883 km2 of exclusive economic zone (EEZ), and 23 % of the 3650 km coastline (Lombard et al. Reference Lombard, Strauss, Harris, Sink, Attwood and Hutchings2004). In addition to these exclusively marine areas, 33 of the 250 estuaries nationally are listed as having moderate to high protection (Turpie et al. Reference Turpie, Adams, Joubert, Harrison, Colloty, Maree, Whitfield, Wooldridge, Lamberth, Taljaard and Van Niekerk2002, Reference Turpie, Wilson and van Niekerk2010). A conservation planning assessment suggested that further expansion of marine area under formal protection will need to focus predominantly on offshore areas (Sink & Attwood Reference Sink and Attwood2008), although not all coastal habitats and ecosystems are adequately protected (Lombard et al. Reference Lombard, Strauss, Harris, Sink, Attwood and Hutchings2004).
A description of marine protected areas in South Africa, listed from west to east.

International conventions (United Nations 2002; IUCN [International Union for the Conservation of Nature] 2003) have encouraged South Africa to increase the representation of biodiversity in MPAs. South Africa's National Biodiversity Act (2004) and the Protected Areas Amendment Act (2004) call for a representative network of protected areas in the sea, but provide no operational definition of ‘representative’. This term has been used in a variety of senses (Stevens Reference Stevens2002).
Identification of representative areas requires good knowledge of biodiversity patterns over the planning domain. However, even well-studied regions have insufficient spatially-referenced data on species composition for conservation planning (NECR [Natural England Commissioned Report] 2009). Some use of representative taxa and physical variables, or broad-scale modelled features, is often made, yet the reliability of such surrogates requires testing (see Anderson et al. Reference Anderson, Nichol, Syms, Przeslawski and Harris2011).
Marine biodiversity surrogates have not been tested in South African waters and, given that the establishment of additional MPAs will be contested by industrial interests, empirical approaches are advisable. We evaluated compliance with legal directives and the success of the conservation planning process by conducting a post-hoc assessment of the representativeness of ichthyofauna in South African MPAs (Margules & Pressey Reference Margules and Pressey2000). We focused on this group of vertebrates owing to its exceptional functional diversity and economic importance and because this broad taxonomic group is most heavily impacted by anthropogenic activity in the sea.
An operational definition of representativeness depends partly on the extent to which species composition can be assessed. It is difficult to describe the true species composition of marine fish assemblages, particularly in deep water. Presence-absence records generally overestimate representation of fish species in an area, because the broadcast spawning strategy of most fishes ensures that distributions are usually far wider than the breeding ranges (Carr Reference Carr, Neigel, Estes, Andelman, Warner and Largier2003). A better measure of species representation will take relative abundance into account, yet measurement of relative abundance relies on methods that are biased towards certain kinds of fish. Methods involving SCUBA, baited underwater video and the many different kinds of fishing gear are all selective, over-representing some and under-representing other species (Willis et al. Reference Willis, Millar and Babcock2000; Trenkel et al. Reference Trenkel, Lorance and Mahévas2004; Watson et al. Reference Watson, Harvey, Fitzpatrick, Langlois and Shedrawi2010). A further complication is that no one method can be used in all habitats.
Previous assessments of representativeness of South African MPAs
A cluster analysis of rocky intertidal biota in 50-km segments of coast by Emanuel et al. (Reference Emanuel, Bustamante, Branch, Eekhout and Odendaal1992) divided the coastal habitat into three broad biogeographic regions. Similar analyses of presence-absence data for fishes (Turpie et al. Reference Turpie, Beckley and Katua2000, Reference Turpie, Adams, Joubert, Harrison, Colloty, Maree, Whitfield, Wooldridge, Lamberth, Taljaard and Van Niekerk2002) and seaweeds (Anderson et al. Reference Anderson, Bolton and Stegenga2009) were broadly in agreement with this classification, although the exact location of boundaries varied slightly among these taxa. A common trend is that diversity decreases from east to west as the influence of the Agulhas current diminishes and the frequency of wind-induced coastal upwelling increases.
There have been a number of investigations into the adequacy of the distribution of MPAs in South Africa. Attwood et al. (Reference Attwood, Mann, Beaumont and Harris1997) showed that the west coast and the subtropical east coast were relatively poorly represented, and that sandy beaches and offshore unconsolidated sediments were also under-represented. Pelagic habitats were not considered. Estuarine protection was also considered to be inadequate, as protected estuaries were small and insignificant.
Lombard et al. (Reference Lombard, Strauss, Harris, Sink, Attwood and Hutchings2004) improved on this assessment by using systematic conservation planning software to analyse the above-mentioned presence-absence data for seaweed, intertidal invertebrates and fish, as well as maps of geological and topographical features and threats to biodiversity. They concluded that 23 of the 34 identified ‘biozones’ were entirely unprotected.
Lombard et al. (Reference Lombard, Strauss, Harris, Sink, Attwood and Hutchings2004) criticized assessments based on presence-absence data that were aggregated into large (typically 50-km) sections of coast. The assumption that a MPA represents all the biodiversity within the section in which it is located leads to overestimates in species representation. For example, 98% of fish species were estimated to be represented in MPAs. Data from within the MPAs themselves are required to provide more realistic assessments. Another area for improvement is the reliance on physical and geological data as untested surrogates of marine biodiversity offshore.
This study is an empirical and quantitative assessment of the extent to which MPAs represent fish species in South Africa. To overcome problems associated with presence-absence data, we used relative abundance data from four different sampling techniques, in each case estimating the extent to which protected area (PAs) represent the fish communities and identifying the degree of redundancy in the network. We aim to provide an objective method for assessing compliance with inexplicit policy and legal directives.
METHODS
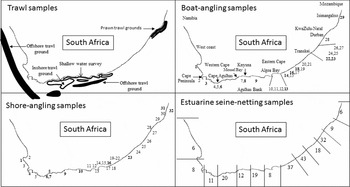
We used data sets from four fishing techniques, namely trawl, boat-angling, shore-angling and estuarine seine-netting, to provide samples of fish communities from protected and exploited areas along the coastline and on the continental shelf of South Africa (Fig. 1).
The distribution of samples used in this study. Boat-angling site numbers refer to samples listed in Table S1 (Appendix 1, see supplementary material at Journals.cambridge.org/ENC). Bold numbers indicate MPAs. Shore-angling site numbers refer to samples listed in Table S2 (Appendix 1, see supplementary material at Journals.cambridge.org/ENC). Numbers plotted inside the coastline indicate estuaries sampled by shore-angling. The numbers of estuaries that were seine-netted in ten coastal delineations are indicated in bottom-right.

Species composition data from commercial trawls were obtained by observers, who recorded catch by subsampling from the trawl net prior to sorting by the crew (Fennessy & Groeneveld Reference Fennessy and Groenewald1997; Attwood et al. Reference Attwood, Peterson and Kerwath2011). The hake-directed trawl data from the Offshore Resources Observer Programme were separated into offshore and inshore grounds, nominally along the 110-m isobath, and then aggregated into 20 minute × 20 minute blocks. The smaller prawn trawl grounds were split along the 50-m isobath into shallow and deep grounds, but not subdivided further.
The South African Department of Agriculture, Forestry and Fisheries has conducted annual trawling surveys using standardized gear similar to the commercial rigs since 1985 (Rademeyer et al. Reference Rademeyer, Butterworth and Plagányi2008). Although commercial trawlers cannot enter MPAs, the same restriction does not apply to survey vessels. We queried survey data from 1986 to 2010, to identify samples from the only two MPAs (De Hoop and Tsitsikamma) that interrupted commercial trawling lanes. Each MPA was considered as a single area and the data were lumped accordingly.
We also included data from a small-mesh trawl survey conducted in water < 30 m deep along the Cape south coast (Wallace et al. Reference Wallace, Kok, Buxton and Bennett1984). Because trawls were sparse, the data were aggregated into 1 degree sections of coast (22°–27° E). Two of these areas included the Goukamma and Robberg MPAs and were assumed to be representative of these MPAs, as insufficient samples existed from these MPAs to provide a reliable estimate of species composition.
Boat-angling is used by commercial and recreational fishers in coastal waters, generally not exceeding 30 km from the shore. Two types of data were available, namely observer surveys of commercial and recreational trips, and scientific surveys. Boat-angling data were available from all regions of the coast, with the exception of the northern part of the west coast (Appendix 1, Table S1, see supplementary material at Journals.cambridge.org/ENC). Survey data were available for 12 MPAs.
Shore-angling is practised by recreational and subsistence fishers, but is also regularly used as a method to survey surf-zone fish communities in MPAs. Surveys of shore-anglers’ catches by trained monitors using access point or roving creel survey methods (Pollock et al. Reference Pollock, Jones and Brown1994) have been conducted in many areas, including MPAs. Only data sets that reported on the full spectrum of catches were analysed (Appendix 1, Table S1, see supplementary material at Journals.cambridge.org/ENC). No-take MPAs were sampled by fishery-independent angling surveys.
Harrison (Reference Harrison2005) conducted seine-netting surveys in 250 estuaries in South Africa between 1993 and 1999, using a consistent method. Catches were assigned to species and enumerated. Three tiny estuaries in the Eastern Cape were eliminated from the data set analysed here, because the samples contained fish assigned only to the family Mugilidae, and not to the species level. All 33 estuarine marine protected areas (EPAs) listed as having high or medium protection were sampled (Turpie et al. Reference Turpie, Wilson and van Niekerk2010).
Multivariate statistics
We used the statistical package PRIMER (Clarke & Warwick Reference Clarke and Warwick2001) to quantify diversity in samples and similarity among fish communities in different areas. Because each sampling method carried its own biases, we examined data from each method separately. Samples were assigned factors depending on whether they represented (1) no-take MPAs, (2) zoned or partial MPAs in which some exploitation was allowed in some or all of the MPA, or (3) fully exploited areas. Shore-angling data were further divided into open coast samples and estuarine samples.
We calculated Shannon-Weiner diversity indices for each site and used the Bray-Curtis measure of similarity to assess similarities between pairs of samples. Samples were standardized such that the quantities of each species summed to 1.0 per sample, limiting the comparisons to species composition. As species abundance varied by up to six-orders of magnitude within a sample, data were 4th-root transformed to prevent the analysis being dominated by abundant species. Similarity matrices were presented as multidimensional scaling (MDS) plots. The extent to which fish communities in MPAs represented all fish communities was taken as the maximum Bray-Curtis similarity, which resulted in groups of samples that each included at least one protected area. This measure considers the presence of species and their relative abundance, but similarities below 60% almost certainly indicate that the lists of species in the samples are not identical.
We calculated the percentage of species included in PAs for each sampling method. The redundancy of the PA network was reflected by the number of PAs that represented each species.
Before considering the results of the multivariate analyses, we also quantified the effects of sampling error, temporal variation and the effects of exploitation, which might confound the interpretation.
Sampling error
Apart from biases associated with each sampling method, finite samples also misrepresented true species composition. To quantify the effects of sampling error on diversity and similarity, samples of various sizes were drawn from a much larger data set that was chosen to represent the true community. The shore-angling survey data from the De Hoop MPA (Appendix 1, Table S2, see supplementary material at Journals.cambridge.org/ENC), which included 43 species and 55 662 fish, was used for this purpose. Random samples varying from 500 to 5000 fish were drawn, such that each fish had an equal chance of selection. We plotted the diversity (alpha and Shannon-Weiner) of the samples against sample size, and calculated the Bray-Curtis similarity index between samples and our true community, using the same transformations described above. This entire procedure was repeated ten times to give average values for the diversity indices and the similarity values. The similarity among the ten replicates of each sample size reflected sampling error in comparisons of real samples.
Temporal variation
Temporal variation was considered because the data spanned three decades. Again, the De Hoop data were used to quantify the error, as these data represented the longest available time-series. Each year from 1989 to 2008 was treated as a separate sampling event, each with approximately 3000 fish. We calculated the similarity among samples to provide a measure of the joint effects of temporal variation and sampling error.
Effects of fishing
Exploitation may cause species composition to change because it is selective, and because of the differing capacities of fish populations to sustain losses. Apparent variation in species composition between a protected and an exploited site may partly reflect the effects of exploitation. To roughly gauge the extent of this effect, the De Hoop data were again used as a model, from which various hypothetical communities were composed for comparison. In the first hypothetical community, the De Hoop composition was left unaltered, representing an unexploited scenario. In the second, it was assumed that exploitation had reduced the population size of half of the species to 50%, to reflect a hypothetical multispecies, maximum sustainable yield scenario. The species that were chosen for reduction included every alternate species in the order of abundance, starting with the first. In the third scenario, the same species were reduced to 10% of their original abundance, to reflect an overexploited scenario. We calculated the Bray-Curtis similarity among these three hypothetical communities.
RESULTS
Diversity
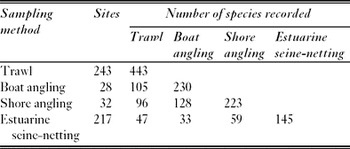
In total, 700 fish species were recorded by the four methods. Most species were sampled by trawls, followed by boat-angling, shore-angling and estuarine seine-netting (Table 2). Each of these methods covered different depth strata, starting with trawls in the deep water, through to estuaries at the shallowest end.
The number of sites that were analysed by each method and the total number of species recorded by each method. The numbers of species common to each pair of methods are listed below the diagonal.

Many species were sampled by more than one method. The number of species common to each pair of methods also showed affinity along depth strata. For example, the number of species shared between trawl samples and each of the remaining sample types decreased from deep to shallow (namely from boat-angling to estuarine-netting). Likewise boat-angling samples had more in common with shore-angling samples than estuarine netting samples.
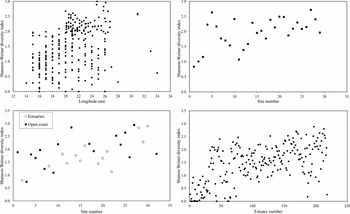
For each survey method, the Shannon-Weiner diversity index increased from west to east, but the pattern and rate of increase varied among methods (Fig. 2). The strongest trend was shown by the estuarine samples, with virtually no diversity on the west coast, increasing to a value in the region of 2.5 on the east coast. The shore-angling data also showed a consistent, but slight, increase in the same direction, with values ranging from 1.0 to 2.2. The boat-angling data showed an increase interupted by a local minimum between Tsitsikamma and Port Elizabeth, before increasing to the highest level on the east coast. The variability of diversity in the trawl data is poorly explained as a function of longitude alone.
Trends in the Shannon-Weiner diversity index for sites sampled by trawl (top left), boat-angling (top right), shore-angling (bottom left) and estuarine seine-netting. All sites are arranged from west to east.

Comparisons of diversity between angling and seine-netting were possible in 12 estuaries that were sampled by both methods. Paired-sample t-tests showed that seine-netting had greater species richness than angling (
 = 12.8, n = 12, p < 0.001), and higher Shannon-Weiner diversity indices (
= 0.42, n = 12, p < 0.001). In contrast, the percentage of samples with Shannon-Weiner indices > 2.0 was 26% and 28% for estuarine seine-netting and trawling, respectively, and 48% and 38% for boat- and shore-angling samples, respectively.
Trawling
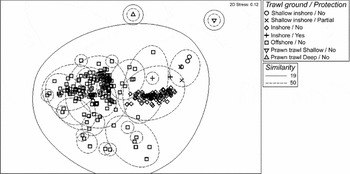
On average, 32 species were recorded per site, with a standard deviation of ± 28 species. Of the total number of species recorded, 121 (27%) were present in MPAs. At 50% similarity, there were 24 clusters of samples, of which three were represented by MPAs (Fig. 3). De Hoop and Tsitsikamma MPAs clustered with other inshore trawl grid-blocks, whereas the segments that included the two shallow MPAs did not cluster with sites from any of the commercial trawling lanes. The prawn trawl grounds formed distinct clusters on their own, but there was also a distinction between offshore, inshore and shallow-water samples. Overall, the representation of fishes from the trawl grounds in MPAs was extremely poor. Even when excluding the prawn trawl grounds, the MPAs represent the fish communities on remaining trawl grounds at a level of only 19%.
A multi-dimensional scaling plot showing Bray-Curtis similarities in fish species composition in trawl samples among sites. Solid and dashed ellipses indicate groupings at the 19% and 50% levels.

Boat-angling
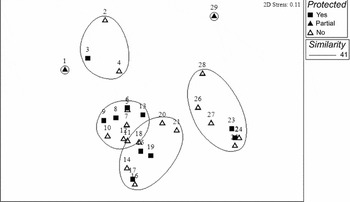
On average, 31 species were recorded per site, with a standard deviation of ± 17 species. Of the total number of species recorded, 153 (66.5%) were present in samples from MPAs. Sites clustered along a continuum from west to east, with the subtropical Isimangoliso forming an outlier (Fig. 4). At a similarity level of 41%, all clusters included MPAs. At a greater level of similarity, a cluster of sites along southern KwaZulu-Natal was unrepresented by MPAs.
A multi-dimensional scaling plot showing Bray-Curtis similarities in species composition in boat-angling samples among sites. Ellipses indicate the highest level of similarity (41%) for which each group has at least one MPA.

Shore-angling
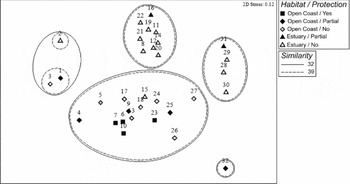
On average, 31 species were recorded per site, with a standard deviation of ± 18 species. Of the total number of species recorded, 164 (72.8%) were present in MPAs. Species assemblages split according to whether the sites were estuarine or open sea habitat, but clustered along a continuum from west to east for both habitat types (Fig. 5). Three major groups formed among the estuarine habitats, corresponding to the west coast (from the Namibian border to the Cape Peninsula), the south and east coast (from Cape Peninsula to Durban) and the north-east coast (from Durban to the Mozambican border). The sites on the open coast clustered in a continuum from west to east, with only the Isimangaliso MPA sample showing a clear separation from every other site.
A multi-dimensional scaling plot showing Bray-Curtis similarities in species composition in shore-angling samples among sites. Solid ellipses indicate the highest level of similarity (33%) for which each group has at least one MPA, and dashed ellipses indicate maximum representativeness (39%) for open-sea sites only.

At a similarity level of 33%, all clusters included MPAs. At 50% similarity, there were 13 clusters of samples, of which three were not represented in MPAs, namely the Berg estuary on the arid west coast and the estuaries of central KwaZulu-Natal. The deep-water Port of Ngqura, a heavily dredged and transformed estuary, more closely resembled an open-sea site. All open-sea sites were represented at the 39% similarity level.
Estuarine seine-netting
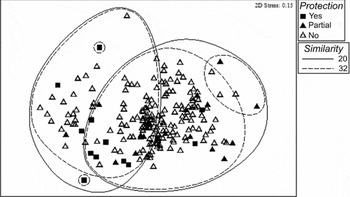
On average, 17 species were recorded per estuary, with a standard deviation of ± 11 species. Of the total number of species recorded, 106 (73.1%) were recorded in protected areas. At 20% similarity, the sites clustered into three groups (Fig. 6). The smallest of these included four estuaries in northern KwaZulu-Natal, one of which is protected. The remainder split into two groups, the smaller of which included short catchments and those with low fish diversity. This cluster contained approximately one-third of the protected estuaries. The larger group was more sparsely represented by EPAs. The largest cluster without any representation included 18 estuaries of southern and central KwaZulu-Natal. At a similarity level of 32%, all estuarine community types were represented in at least one EPA.
A multi-dimensional scaling plot showing Bray-Curtis similarities in species composition in seine-net surveys among the vast majority of South Africa's estuaries. Solid ellipses indicate the highest level of similarity (32%) for which each group has at least one MPA.

Redundancy
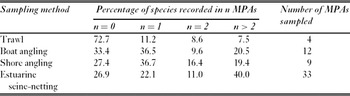
Redundancy was greatest for the EPA network (Table 3). Estuaries contained more PAs and fewer species than open seas. The majority of estuarine fish were represented in EPAs and 40% were found in more than two EPAs. The majority of coastal fishes, as sampled by angling, were also represented in MPAs, but were most commonly represented in only one MPA. The fishes on the trawl grounds were mostly unrepresented in MPAs. Taking the results of all methods together, 49% of fish species were recorded in MPAs.
Percentage of marine fish species found only in the given number of MPAs given as a summary of redundancy in the protected area network.

Analysis of magnitudes of error
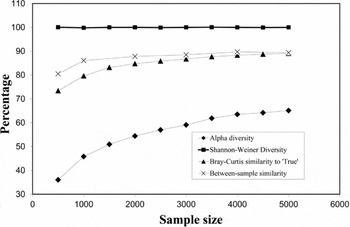
The Shannon-Weiner diversity index is almost entirely insensitive to the sample size in the range 500–5000 (Fig. 7). In contrast, alpha diversity is strongly dependent on sample size and severely underestimates the true diversity, even at a sample size of 5000. Bray-Curtis similarity is dependent on sample size, whether samples are compared to the true community or to each other. The Bray-Curtis similarity between samples of 500 and the true community is 70% whereas the similarity among samples of this magnitude is 80%. These similarities both increase to about 90% at a sample size of 5000, at which point they increase at a marginal rate of about 0.7% for every additional 1000 fish.
Effects of sample size on diversity and similarity measures. The two measures of diversity are expressed as a percentage of the value for the ‘true’ community. The Bray-Curtis similarity between samples of various sizes and the ‘true’ community, and the similarity among ten samples of the same size, are also plotted as percentages.

The average similarity between all pairs of annual samples from De Hoop was 80.9%. This statistic reflects the effects of sampling error and temporal variation. No two years were >90% similar. As the average annual sample sizes were c. 3000, the average similarity was approximately 8% less than that predicted by the sampling error model. This difference may be attributed to interannual variation.
The effects of fishing on similarity were not as great as the combination of the two previous sources of error. The 50% and 90% reductions of half the species resulted in Bray-Curtis similarities of 95.6% and 86.0% when compared to the original set of unexploited quantities.
DISCUSSION
Diversity
The catchability limitations of the sampling methods and the incomplete coverage of the EEZ meant that only about one-third of the c. 2150 South African marine fish species were sampled. Despite this low proportion, the nature of the sampling ensured that these fishes included the vast majority of those directly impacted by fishing. Species richness in the combined samples for each method increased consistently with depth, being greatest in the trawl samples (deep water) and lowest in the coastal samples (shallow water). This conflicts with reported trends in fish diversity (for example see Smith & Brown Reference Smith and Brown2002; Yemane et al. Reference Yemane, Field and Leslie2010; Jonathan &Essington Reference Jonathan and Essington2011), and was probably related to sampling intensity and coverage, as the amount of fish sampled and the amount of area covered by each method increased from shallow to deep waters.
Our results also reflected the west to east increase in diversity reported by Whitfield (Reference Whitfield1999) and Yemane et al. (Reference Yemane, Field and Leslie2010). The only variation that we observed was a drop in diversity in boat-angling samples between Knysna and Algoa Bay, which we attribute to the effects of frequent cold water upwelling along this section of coast (Attwood et al. Reference Attwood, Peterson and Kerwath2011). Between 25 and 50% of species overlapped between sampling methods in adjacent depth zones, indicating that the four sampling methods were largely complementary, covering different habitats and depth strata. Fish communities on continental shelves are stratified by depth (Williams et al. Reference Williams, Koslow and Last2001; Yemane et al. Reference Yemane, Field and Leslie2010).
The patterns in the survey data broadly agreed with the pattern of biogeographic zonation described on the basis presence-absence records of intertidal invertebrates, fishes and seaweeds (Emanuel et al. 1997; Turpie et al. Reference Turpie, Beckley and Katua2000; Anderson 2009). The patterns were clearest in the two angling surveys, which showed a continuum in species compositions from west to east, with clusters corresponding to the west coast (the cold temperate zone), the large and variable southern and eastern Cape (the Aghulhas marine Province), and the subtropical north-east coast.
Representation of fish communities in PAs
The representation offered by EPAs was estimated at 32% and 33% by seine-netting and angling, respectively. Although seine-netting included more samples and proved to be a better means of sampling estuarine fish, it is interesting that these two methods arrived at similar results. Using the methods described here, the representation of fish communities is between 32 to 41% in the coastal zone up to the limit of boat-angling (nominally 50 km offshore). The trawl grounds show variable levels of protection: none for the prawn trawl ground, 50% for the inshore trawl grounds and 20% for the offshore hake grounds. The remainder of the seabed, which constitutes the largest fraction of the EEZ, is practically unexploited, but also unprotected from mining. South Africa's relatively good inshore protection contrasts with the complete lack of protection on trawl grounds deeper than 80 m.
Fish communities from the west coast of South Africa are poorly represented in the PA network. Similar conclusions were reached by Attwood et al. (Reference Attwood, Mann, Beaumont and Harris1997), on the basis of the distribution of MPAs alone, and by Lombard et al. (Reference Lombard, Strauss, Harris, Sink, Attwood and Hutchings2004), on the basis of a complementarity analysis involving physical and biological data. The west coast forms one of the major marine biogeographic zones in South Africa, and one where the coastline is extensively disturbed by mining operations (Malan & Swart Reference Malan and Swart1997). The southern part of the KwaZulu-Natal coast was also found to have insufficient protection for fish. Aliwal Shoal and Trafalgar MPAs, both situated in this region, were not represented in samples, but neither are likely to contribute significantly to fish conservation because of their small size and concessions to exploitation. This is a strong transitional area between the warm temperate and subtropical biogeographic zones, where the community composition changes rapidly along the coast.
Redundancy
Replication of ecological features in protected areas means that ‘more than one site shall contain examples of a given feature in the given biogeographic area’ (CBD [Convention on Biological Diversity] 2008). Whereas replication in South Africa's coastal MPAs is relatively good based on habitat type, particularly on the south coast (Lombard et al. Reference Lombard, Strauss, Harris, Sink, Attwood and Hutchings2004), individual fish species are not represented in many MPAs. South African MPAs have a low level of redundancy regarding fish protection, as the majority of the species are only represented in one MPA or not represented at all. Only a few ubiquitous species are present in five or more MPAs, which was the benchmark used for an assessment of replication of MPAs around the United Kingdom (NECR 2009). A likely reason for low redundacy of MPAs is the exceptional range-restriction imposed on southern African marine biota by the confluence of sharply contrasting water masses (Griffiths et al. Reference Griffiths, Robinson, Lange and Mead2010).
Redundancy in the EPAs was far greater, which may be explained by two large MPAs (Tsitsikamma and Pondoland) which include several adjacent EPAs. Because many of the EPAs are adjacent to each other, the redundancy is falsely optimistic, and does not accord with the low representativeness offered by EPAs.
The method of assessment
This study complements previous assessments based on the extent to which the coastline and EEZ are included in MPAs (see for example Attwood et al. Reference Attwood, Mann, Beaumont and Harris1997), and on presence-absence analyses derived from collections (see Turpie et al. Reference Turpie, Beckley and Katua2000; Anderson et al. Reference Anderson, Bolton and Stegenga2009). Currie et al. (Reference Currie, Sorokin and Ward2009) used a similar method to assess protection of infauna in the Great Australian Bight. They found that groups at 12% similarity were all represented by protected areas, and that 72% of species were represented. An advantage of this method is that it quantifies representation based on species presence (mostly) and relative abundance, which we postulate to be the most practical and defensible characterization of patterns in fish communities. Another important feature is that it can be repeated, whereas studies based on long-term presence-absence data are not repeatable. Repetition may be important in reassessing representation following climate change or environmental degradation.
Assessments of the effectiveness of a large network of MPAs require a large amount of data, and our analysis was limited by the availability and quality of data. Sample sizes varied tremendously, making species-richness estimates incomparable and introducing a c. 15% error in Bray-Curtis similarity. The lack of concurrent surveys introduced additional error, which we estimate to be < 10% in terms of Bray-Curtis similarity over the period in which the data were collected.
The separation of surveys into four gear types should have eliminated most of the error associated with gear selectivity, but even within each of these, methods were not fully standardized. With a great variety of baits and hook sizes in use, angling is a more inconsistently applied method than either trawl or seine-netting. Most of the angling surveys included two or more targetting techniques designed to cover as wide a spectrum of species as possible (see Attwood Reference Attwood2003), and creel surveys measured catches from the full suite of techniques applied by anglers. In contrast, the netting surveys were standardized. Despite this difference, the overall species richness and Shannon-Weiner diversity indices were greater for seine-netting than angling at the same estuarine sites. Although angling may be more selective than the net-based methods, it covered a greater variety of habitat, including sheltered waters and exposed surf, photic and sub-photic reefs and shallow unconsolidated sediment, which may explain the higher overall Shannon-Weiner diversity in angling samples.
Because of the limitations in the comparability of the data sets, the analysis is a coarse assessment of representativeness. The analysis of errors shows that, even with better sampling, it may be impossible to measure representation at a level >80%. The trawl samples confirm this limit. Although trawls had continuous coverage over large tracts of apparently uniform ocean habitat, in very few cases were any two adjacent samples >85% similar.
The quantification of representation depends to some extent on the transformation of data and the index of similarity. These seemingly minor technical aspects heavily influence the implementation of government policy. Given the potentially massive effects of such policies on marine industrial activity and viability, commercial interests keenly question not only the rationale behind such policies, but also the methods used to implement them. It is perhaps a weakness of national policies, and the laws that follow, that the corresponding operational definitions are unclear. Existing approaches have used habitat maps, based on geological and benthic species data, but such delineation of habitat types can be subjective with variable resolution.
Omissions in data coverage
Areas that were omitted need to be considered for their possible influence on the result. The trawl surveys, for example, covered <20% of the EEZ, and the boat-angling survey even less, but they were largely complementary, targeting soft and hard ground, respectively. The offshore component of the analysis was therefore based on exploitable ground, and ignored the biodiversity associated with the remainder of the EEZ, which falls largely on the continental slope and abyss. The shore-angling survey covered a greater proportion of the coast and the estuarine survey covered the vast majority of estuaries. These achievements were related to the accessible coastline and its low fractal index.
The MPAs were therefore assessed on their representation of fish communities on exploited ground only, and then only on those parts of the communities that were susceptible to capture by the most common types of fishing gear deployed in South Africa. As desirable as it may be to overcome this problem, a more comprehensive sampling scheme will be prohibitively expensive, whereas the gear types used here featured in routine fisheries surveys.
The assessment of estuarine fish was the most complete in coverage and selectivity, which was fitting for this environment because of the great variation among estuaries’ catchment size and mouth condition (Whitfield Reference Whitfield1994). Because the threats to estuarine fishes are far more diverse than fishing alone and certainly more diverse than the offshore threats (Whitfield Reference Whitfield1997), it is preferable to sample this habitat with the seine-net, which is the most broadly selective and non-destructive sampling method for this type of habitat (Lapointe et al. Reference Lapointe, Corkum and Mandrak2006).The angling techniques provided good coverage, with the exception of the west coast. This is a relatively underpopulated part of South Africa, where coastal fishing is less prevalent than elsewhere (Brouwer et al. Reference Brouwer, Mann, Lamberth, Sauer and Erasmus1997). The west coast is also relatively poor in fish diversity and the habitat less diverse than the east coast (Turpie et al. Reference Turpie, Beckley and Katua2000). In our survey, sampling omissions here were thus less problematic than elsewhere; there is still no substantial MPA on the west coast of South Africa.
In the case of trawl surveys, very few MPAs interrupt trawling grounds, and those that do impact only on the shallow edge. Overall, the inshore grounds were weakly represented by MPAs. Although only a few MPAs were sampled by trawls, the remainder do not include trawlable habitat, or are far shallower than commercial trawl grounds. For example, the Pondoland MPA includes a part of the EEZ where the shelf is at its narrowest and where strong currents prohibit trawling, and, although this area was not sampled by trawl, it was sampled extensively by boat-angling. Its different bottom habitat and its position in an area usually found to be transitional in biogeography suggests that Pondoland will not represent the hake trawl or prawn trawl grounds.
Not all the protected areas were sampled. Of the 20 MPAs, quantitative data were unavailable for six MPAs (Helderberg, Still Bay, Sardinia Bay, Hluleka, Trafalgar and Aliwal Shoal). These include the smallest MPAs and those for which fishery benefits were not cited as an objective. Helderberg and Trafalgar for example are both <5 km2, which suggests that their contribution to fish conservation at a national scale is insignificant, regardless of what they represent. Nevertheless, their likely influence on the overall representation of the network should be considered. It may not be possible to sample some protected areas, as the objectives for some of them may conflict with potentially damaging and disruptive sampling methods used elsewhere (Field et al. Reference Field, Punt, Methot and Thomson2006). Aliwal Shoal, for example is a popular SCUBA diving site, where conventional fisheries sampling would not be acceptable.
Other survey methods
Some gaps might mave been filled by using data from other survey methods, such as lobster traps, longlines and purse-seines, but none were as widely applied as the four that were used, and few were as non-selective. Limited use of gill-nets, a notoriously broad-spectrum fishing technique, still occurs on the west coast (Hutchings & Lamberth Reference Hutchings and Lamberth2003), and has been used for surveys along part of the south coast (Hutchings & Lamberth Reference Hutchings and Lamberth2002), but further use of this destructive gear is not to be encouraged for any purpose. SCUBA assessments were considered, but the coverage of these data was limited to the eastern part of the country, coincident with warm clear water. SCUBA surveys also seldom penetrate below 30 m depth. Future surveys might use underwater video techniques, which possess some advantages over angling, trawling and SCUBA surveys, but these types of surveys are relatively novel in South Africa.
The pelagic zone had the lowest representation in this study. Pelagic fishes are exploited by pelagic longlines (tuna- and shark-directed), purse-seine and mid-water trawl; the first two gear types are widely applied, but too selective to sample fish communities, whereas the last targets horse mackerel Trachurus trachurus on specific grounds. The identification of recognizable pelagic fish community types is still an unresearched topic in South Africa, although the appropriateness of MPAs for South Africa's pelagic zones has received some attention (Grantham et al. Reference Grantham, Petersen and Possingham2008).
Adequacy of protection
We examined only representation, and made no judgement on whether the MPAs were sufficiently large, situated in source areas, well-managed or achieved any of the other criteria required to ensure that objectives were attained (Carr Reference Carr, Neigel, Estes, Andelman, Warner and Largier2003; Pomeroy et al. Reference Pomeroy, Parks and Watson2003; Von der Heyden Reference Von der Heyden2009). South Africa's MPAs range in size by three orders of magnitude and are managed by four separate agencies, each with varying levels of management performance and social acceptance (Attwood et al. Reference Attwood, Mann, Beaumont and Harris1997; Tunley Reference Tunley2009). Most of the MPAs were selected opportunistically or were based on expert opinion in an era before conservation planning matured as a science and gained acceptance as best practice. It is therefore possible that many of the MPAs do not adequately attain their objectives, which emphasizes the need for additional redundancy.
CONCLUSIONS
Routine surveys of fishes in exploited habitats and MPAs could form the basis of decadal assessments of the extent of representativeness of the MPA network in South Africa. Strong environmental gradients around southern Africa, together with the effects of climate change (Zietsman Reference Zietsman2011) imply that reassessments may need to be frequent. The Bray-Curtis similarity index provides a useful measure of representativeness, and one that is not influenced by the subjectivity of habitat classification and doubts about the reliability of surrogates. The scores were broadly in agreement with the low level of redundancy of MPAs with regard to fishes. Despite the relatively large number of PAs in South Africa and the good coverage of the coastal environments, this study reveals that c. 50% of fish species directly impacted by exploitation remain unprotected. This is more pessimistic than previous assessments based on presence-absence data alone.
ACKNOWLEDGEMENT
We thank Edward Hill for assistance with the preparation of figures.