I. INTRODUCTION
Much recent research has focused on the development of Bi-based piezoelectrics as environmentally compatible alternatives to lead-containing materials such as Pb(ZrxTi1−x)O3 (PZT) since the Bi3+, like the Pb2+ ion, is highly polarizable due to a 6s 2 lone electron pair.Reference Takenaka and Nagata1, Reference Rödel, Jo, Seifert, Anton, Granzow and Damjanovic2 Compounds such as (Bi0.5Na0.5)TiO3 (BNT) and its solid solutions with BaTiO3 (BT), (Bi0.5K0.5)TiO3 (BKT), (K0.5Na0.5)NbO3 (KNN), and other perovskites exhibit usable piezoelectric propertiesReference Sasaki, Chiba, Mamiya and Otsuki3–Reference Lee, Yoon, Lee, Kim and Lee11 and are considered as candidates to replace Pb-based materials.Reference Hiruma, Yoshii, Nagata and Takenaka6, Reference Shrout and Zhang9, Reference Lee, Yoon, Lee, Kim and Lee11 One of the criteria for piezoelectrics intended for actuator applications is the amount of strain S that can be induced with moderate electric fields. Recently, large strain response even surpassing that of standard PZT compositions was found in BNT-based binary and ternary system,Reference Hiruma, Nagata and Takenaka10, Reference Wang, Hussain, Jo and Rödel12–Reference Ullah, Ahn, Hussain, Lee and Kim19 which provides new perspectives on the development of lead-free piezoceramics. As these systems have a lot of potential, a good understanding of their phase diagrams is crucial for further development and improvement, especially, since a large part of the observable strain is not due to the normal piezoelectric effect but to a phase transition from a ferroelectric (FE) phase to an antiferroelectric (AFE) (the so-called “AFE” has been clarified with a “nonpolar” phaseReference Jo, Granzow, Aulbach, Rödel and Damjanovic20; the existence of “AFE” phase proposed based on the observation of a double P-E loop is merely a consequence of an electric-field-induced relaxor-to-FE transitionReference Jo, Schaab, Sapper, Schmitt, Kleebe, Bell and Rödel21) induced by external electric fields.Reference Kounga, Zhang, Jo, Granzow and Rödel5 When the phase boundary between FE and “AFE” phases can be achieved at ambient temperature, the strain always reaches its maximum value at the FE–“AFE” phase transitions.Reference Guo, Gu, Luo, Liu and Withers13 Based on the above, BNT-based binary systems with large strain, e.g., BNT–KNbO3,Reference Hiruma, Nagata and Takenaka10 BNT–Ba(Al1/2Sb1/2)O3,Reference Hiruma, Nagata and Takenaka14 were reported.
On the other hand, high-performance lead-free electrostrictors have been also aroused more and more concernsReference Bobnar, Malič, Holc, Kosec, Steinhausen and Beige22–Reference Li, Wang, Qin, Xu and Shi27 recently due to the increase of public awareness on the fact that most of currently used electrostrictors are still lead-based materials. Electrostriction is a general property of all dielectric materials but it is significantly large in FEs just above the Curie temperature (T c), where an electric field can induce energetically unstable FE phase. By contrast, relaxor FEs can exhibit a relatively high electrostrictive strain in a wide temperature range due to the diffused phase transition and the large dielectric permittivity εr.Reference Haertling28 If the phase transition temperature is close to room temperature (RT), the electrostrictive effect can be very largeReference Zhang, Yan, Yang and Cao25 due to the appearance of the large εr at RT. Therefore, one may adjust the composition in lead-free relaxor FEs to achieve a pseudocubic/cubic crystal structure at RT, which might produce a good lead-free electrostrictor. Based on the above, Zhang et al.Reference Zhang, Kounga, Jo, Jamin, Seifert, Granzow, Rödel and Damjanovic24, Reference Zhang, Yan, Yang and Cao25 proposed a new concept of using lead-free BNT-based ceramics as electrostrictors, which can provide high strain and minimal losses at RT combined with weak temperature dependence.
KNN addition can decrease the FE–“AFE” phase transition temperature of BNT-based ceramics and enhance the dielectric relaxor behavior at RT.Reference Zhang, Kounga, Jo, Jamin, Seifert, Granzow, Rödel and Damjanovic24, Reference Zhang, Yan, Yang and Cao25 For the (1−x)BNT–xKNN system, although a morphotropic phase boundary (MPB) between a rhombohedral and a tetragonal phase was found at x ≈ 0.07 and largest piezoelectric coefficient d 33 was also achieved in this region,Reference Kounga, Zhang, Jo, Granzow and Rödel5 the existing research results of the system are still not comprehensive so far because at higher KNN content, a possible tetragonal and pseudocubic phase boundary is ignored, and the electrostriction for compositions with pseudocubic phase is still unnoticed. Besides, it is necessary to complete the phase diagram of the system. Based on the above, (1−x)BNT–xKNN system at higher KNN content with 0.08 ≤ x ≤ 0.19 was designed in this work, and the phase–structure transitions, relaxor behavior, and electrostrictive properties of the ceramics were studied.
II. EXPERIMENTAL PROCEDURE
(1−x)(Bi0.5Na0.5)TiO3–x(K0.5Na0.5)NbO3 (abbreviated as BNT–xKNN, x = 0.08–0.19) ceramics were prepared by a conventional ceramic fabrication process using reagent-grade metal oxides or carbonate powders of Bi2O3, Nb2O5, TiO2, Na2CO3, and K2CO3(>99.9%; Alfa Aesar, Tianjin Co., Ltd., China) as raw materials. The stoichiometric BNT and KNN powders were first synthesized at 850 °C for 4 h and 880 °C for 5 h, respectively. After the calcinations, BNT and KNN powders were weighed according to the formulas and then ball-milled for 24 h. The dried mixtures were pressed to form disks using 8 wt% polyvinyl alcohol (PVA) as a binder. After burning off the PVA, the disk samples were finally sintered at 1150–1180 °C for 2 h in air.
The apparent density of the sintered samples was determined by applying the Archimedes method. The grain size was determined by averaging over the total number of grains in a scanning electron microscopy (SEM) (Model, JSM EMP-800; JEOL, Tokyo, Japan). The crystal structure and phase purity of powders ground from the sintered samples were examined using x-ray diffraction (XRD) (Bruker D8 Advance, Karlsruhe, Germany) with Cu Kα radiation. For the temperature-dependent structural analysis, a reflective XRD apparatus (Bruker D8 Advance) equipped with a furnace was used using Cu Kα radiation. Raman spectra were recorded on polished sintered pellets using 488-nm excitation with a Jobin-Yvon LabRam HR800 (Horiba Jobin Yvon Inc., Paris, France). For the electrical measurements, silver paste was coated on both sides of the sintered samples and fired at 600 °C for 10 min to form electrodes. Dielectric properties were measured using a HP 4284A precision LCR meter (Agilent, Palo Alto, CA) in the temperature range of 20–500 °C. Thermally stimulated depolarization currents (TSDC) were measured on poled samples using a Keithley 6517A electrometer/high resistance meter (Keithley Instruments, Cleveland, OH) at a heating rate of 2 °C/min to determine the depolarization temperature (T d). The electric-field-induced polarization (P-E) and strain (S-E) measurements were carried out using a FE test system (Precision Premier II; Radiant Technologies Inc, Albuquerque, NM) connected with a miniature plane mirror interferometer and the accessory laser interferometer vibrometer (SP-S 120/500; SIOS Mebtechnik GmbH, llmenau, Germany). For the measurement of piezoelectric properties, samples were poled in silicone oil bath at RT with a DC electric field of 70 kV/cm for 20 min. After aging for 24 h, the piezoelectric constant d 33 was measured using a quasistatic d 33 meter (ZJ-6A; Institute of coustics, Beijing, China).
III. RESULTS AND DISCUSSION
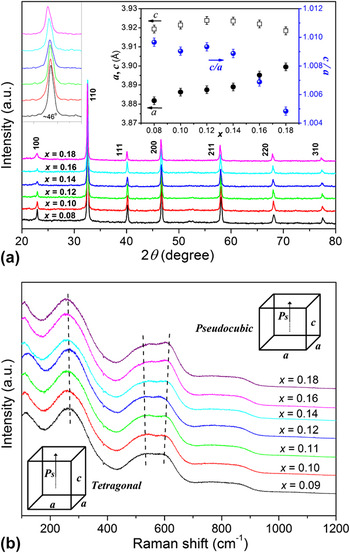
XRD analyses of the sintered and then crushed samples of BNT–xKNN ceramics as presented in Fig. 1(a) show a single perovskite structure without apparent trace of secondary phases. All the peaks could be indexed based on a cubic perovskite structure as evident by the undetected splitting of any of the peaks. The absence of a noncubic distortion of these samples as found in BNT–BKT-based ceramicsReference Wang, Hussain, Jo and Rödel12, Reference Seifert, Jo and Rödel16 contradicts all the macroscopic properties reported in this system.Reference Kounga, Zhang, Jo, Granzow and Rödel5 In the present work, we assume that the noncubic distortion is beyond the detection limit of conventional XRD techniques, and it is possible that the cubic symmetry evidenced by the current diffraction experiments could be a consequence of the presence of a rhombohedral symmetry with a very small distortion, as was proposed by Jones et al.Reference Jones, Kreisel and Thomas29 To further confirm the phase structure of the studied samples, Raman spectroscopy, which could probe a local ionic configuration with short length scale usually less than 10 nm, was utilized to complement the XRD resultsReference Wang, Xu, Tang, Wang, Shi and Leung17 that usually reflected the large length-scale average structures. From the Raman data as shown in Fig. 1(b), the mode corresponding to Ti–O vibration centered around 260 cm−1 changes little, while high-frequency overlapping bands in the range of 450–650 cm−1 become broader and start splitting into two bands that shifted apart from each other, indicating particular photon behavior in the structure evolution induced by the addition of KNN. Previous reportReference Kounga, Zhang, Jo, Granzow and Rödel5 suggested that dominated tetragonal phase was observed in BNT–xKNN system at the KNN content >7.5 mol%. In our work, the characteristic doublet at 450–650 cm−1 as shown in the Raman spectra also indicates that all compositions favor tetragonal symmetry. As KNN content increases, it seems that the samples undergo a phase transition due to the appearance of splitting and broader overlapping bands in the hardening of the high frequency mode from 450 to 650 cm−1, especially, evident by the change of the relative intensity for Raman peaks at 526 and 595 cm−1. To further study the structure evolution, lattice parameters of the ceramics as a function of KNN content were calculated from the diffraction peaks based on the tetragonal (P4bm) space group and were shown in the inset of Fig. 1(a). A notable change of the lattice parameters is the decrease of the tetragonality c/a due to an increase in the a-axis lattice constant as larger (K0.5Na0.5)+ and Nb5+ ion substitutes for a smaller Bi3+ and Ti4+ ion, respectively. Especially at x > 0.14, the tetragonality c/a is close to 1, suggesting an emergence of a pseudocubic phase.Reference Ullah, Ahn, Hussain, Lee and Kim19
(a) XRD patterns as a function of 2θ and (b) Raman spectroscopy data for BNT–xKNN ceramics at RT [the inset of (a) is the enlarged XRD patterns for the (200) peak at 2θ = 46° and variation of the lattice parameters of the ceramics].

The B–O–B bond anglesReference Ito, Tezuka and Hinatsu30, Reference Lee, Huang, Tsao and Wu31 and tolerance factorReference Lee, Huang, Tsao and Wu31 [ $t = {{(R_{\rm{A}} + R_{\rm{O}} )} \mathord{\left/ {\vphantom {{(R_{\rm{A}} + R_{\rm{O}} )} {\sqrt 2 (R_{\rm{B}} + R_{\rm{O}} )}}} \right. \kern-\nulldelimiterspace} {\sqrt 2 (R_{\rm{B}} + R_{\rm{O}} )}}$, where R A, R B, and R O are the radii of the A and B ions and oxygen ions, respectively] are usually used for explaining the structural transformation in perovskite materials. In the present work, the ionic radius of Nb5+ (r = 0.64 Å) is larger than that of Ti4+ (r = 0.605 Å). Therefore, the B–O–B bond angle will be decreased as the ionic radius of the B site ion increases, which means that the distortion of the crystal structure from the ideal cubic perovskite structure increases as the ionic radius of the B site ion increases. So based on the B–O–B bond angles model, the distortion of the crystal structure should be increased, which hinders the appearance of a pseudocubic phase. However, on the other hand, the addition of KNN into BNT slightly increases the tolerance factor of the BNT–xKNN ceramic due to the larger tolerance factor of KNN (t = 1.010) than that of pure BNT (t = 0.977), which signifies that the deviation from the ideal cubic perovskite structure is smaller at higher KNN content. Considering the B–O–B bond angles and tolerance factor influence on the structure of the studied system, it seems that the tolerance factor plays a more essential role on the phase transitions of the system.
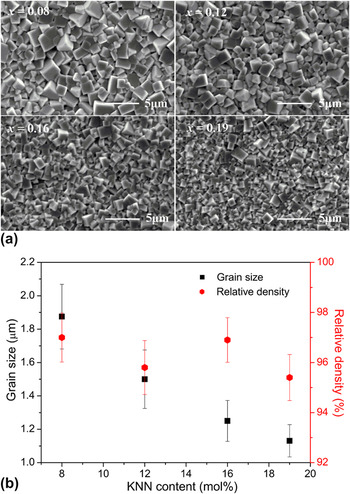
Figure 2(a) provides SEM micrographs of the surface of BNT–xKNN ceramics with x = 0.08, 0.12, 0.16, and 0.19. The microstructure appears homogeneous and almost fully dense without any apparent pores. Addition of KNN has significant influence on the grain size while little impact on the density of the ceramics. The average grain size decreases gradually from ∼1.9 to ∼1.0 μm with the increase of KNN content, whereas the relative density is 96% ± 1% in all compositions [Fig. 2(b)].
(a) SEM micrographs of the surface of BNT–xKNN ceramics with x = 0.08, 0.12, 0.16, 0.19. (b) Average grain size and relative density as function of KNN content.

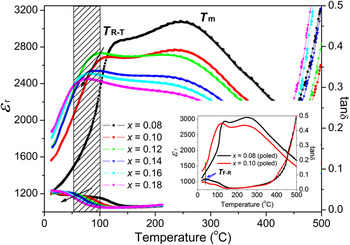
Figure 3 displays the temperature dependence of dielectric permittivity εr and loss tangent tanδ measured at 1 kHz for BNT–xKNN samples. There are two distinct anomalies evident in εr (T) for all samples, which are also reflected in the corresponding loss tangent curves. At high temperatures, a peak, denoted by the temperature of maximum permittivity, T m, provides a tetragonal to a cubic phase transition. The addition of KNN within x < 0.16 has almost no influence on T m as T m = 252 °C for 8 mol% KNN and is virtually unchanged for 16 mol% KNN with T m = 254 °C, while further increasing KNN content slightly increases the T m up to 265 °C for 19 mol% KNN. The other dielectric anomaly at lower temperatures denotes that the rhombohedral–tetragonal phase transition T R-T, which is strongly dependent on KNN content, shifts continuously to lower temperature with the increase of KNN content. Moreover, besides the above two obvious dielectric peaks, there is still a weak dielectric anomaly T F-R at much lower temperatures determined by the frequency-independent peak in the dissipation factor in poled specimens as shown in the inset of Fig. 3. T F-R denotes the transition from FE to relaxor stateReference Sapper, Schaab, Jo, Granzow and Rödel32 and is only valid for poled samples.Reference Wang, Hussain, Jo and Rödel12 Generally, T F-R obtained from dielectric measurement has also been referred to as depolarization temperature T dReference Guo, Gu, Luo, Liu and Withers13, Reference Hiruma, Nagata and Takenaka14, Reference Hiruma, Nagata and Takenaka33; however, recent study by Anton et al.Reference Anton, Jo, Damjanovic and Rödel34 demonstrated the difference between T F-R and T d, where T d is measured by TSDC using poled samples. In the present work, for different compositions, T F-R varies in position, which are 43, 37, and 33 °C for samples with x = 0.08, 0.09, and 0.10, respectively. However, no distinctive T F-R is observed in samples with x ≥ 0.11, which implies that T F-R has been shifted below RT. The shift of T F-R with KNN content indicates compositionally induced FE-to-relaxor phase transition, and this can be well confirmed by the results of Fig. 10.
Temperature dependence of dielectric permittivity εr and loss tangent (tanδ) for BNT–xKNN ceramics at 1 kHz (the inset shows temperature dependence of εr and tanδ for poled samples with x = 0.08 and 0.09).

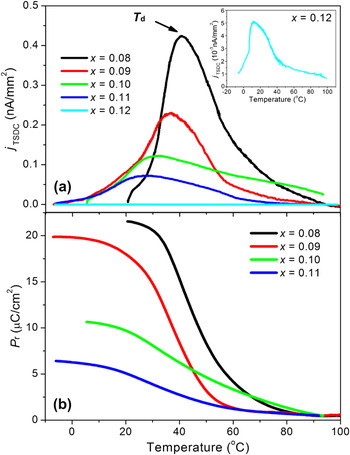
To determine the depolarization temperature T d of the studied system, temperature dependence of depolarization current (j TSDC) for poled samples with different KNN content was carried out and shown in Fig. 4(a). It is interesting to see that the temperature-dependent j TSDC curve is distinctively diffusive at higher KNN content, and T d values are 40, 35, 29, 24, and 12 °C for samples with x = 0.08, 0.09, 0.10, 0.11, and 0.12, respectively, which are 2–4 °C lower than the previously determined T F-R values. The same trend that T d is lower than T F-R was also reported in BNT–BT, BNT–BKT–KNN, and BNT–BKT–SrTiO3 (ST) systems.Reference Wang, Hussain, Jo and Rödel12, Reference Sapper, Schaab, Jo, Granzow and Rödel32, Reference Anton, Jo, Damjanovic and Rödel34 A possible explanation is that the macroscopic domain structure first decays at T d, whereas the coherence of dipoles within the domains extends over a wider temperature range.Reference Wang, Hussain, Jo and Rödel12, Reference Sapper, Schaab, Jo, Granzow and Rödel32Figure 4(b) presents temperature-dependent polarization obtained from TSDC measurements for ceramics with different KNN content. The temperature-dependent polarization P(T), which equals P r for poled FEs, was calculated according to the following equation,  $P = \int {j(T){\rm{ }}dt} $, by integrating j TSDC over time (t). Samples with x = 0.08 and 0.09 are denoted by the rather sharp decay of P r near T d, whereas the depolarization behavior is highly diffused for ceramics with higher KNN content (x = 0.10, 0.11), as shown that P r is lost in a very wide temperature range with a slow decrease near T d. A similar behavior was observed in BNT–BT–KNN and BNT–BKT–ST materials, and the diffused depolarization was rationalized by assuming the coexistence of a relaxor phase and polar phases over a wide temperature range.Reference Wang, Hussain, Jo and Rödel12, Reference Tan, Aulbach, Jo, Granzow, Kling, Marsilius, Kleebe and Rödel35
Temperature dependence of (a) depolarization current j TSDC and (b) calculated P r for poled BNT–xKNN samples with x = 0.08–0.12.

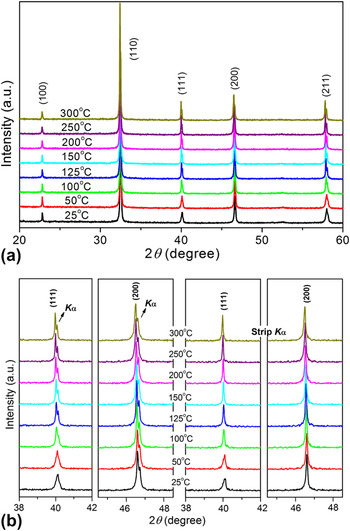
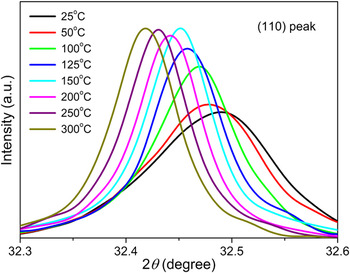
Figure 5(a) shows XRD patterns of BNT–0.08KNN ceramics at selected temperatures from RT to 300 °C. As the measured temperature increases, the characterization of (111) and (200) peaks, as shown in Fig. 5(b), provides no obvious changes (no peak splitting other than Kα1 and Kα2) from 30 to 300 °C, besides minor fluctuations in intensity and a shift in the reflex due to thermal expansion. The result seems to suggest that no evident phase transitions occurred in the studied sample, which is quite inconsistent with the appearance of the dielectric permittivity peak (T R-T, T m). However, the changes in intensity of the (110) reflection as shown in Fig. 6 indicate that there are at least two successive structural changes taking place.Reference Dittmer, Jo, Damjanovic and Rödel36 Note that a discontinuous change in the intensity of (110) reflection is clearly seen in the temperature range of about 150–200 °C as reported in BNT–BT–0.18KNN ceramics.Reference Dittmer, Jo, Damjanovic and Rödel36
(a) XRD patterns of BNT–0.08KNN ceramics in the 2θ range of 20–60° at different temperatures, (b) the (111) and (200) reflections for samples at selected temperatures.

The (110) reflection for BNT–0.08KNN ceramics at selected temperatures.

For the reported BNT–BT–KNN ceramics, Hinterstein et al.Reference Hinterstein, Knapp, Hölzel, Jo, Cervellino and Ehrenberg37 demonstrated by combining neutron with XRD techniques that the introduction of KNN to BNT–6BT stabilizes the high temperature P4bm phase at RT; the lattice distortion of which is so small [c/a ∼ 1.000(3)] that the phase can only be assigned to be tetragonal from the presence of superlattice reflection, which is properly detectable only by neutron diffraction. Furthermore, Webber et al.Reference Webber, Zhang, Jo, Daniels and Rödel38 suggested that there is still an additional phase P4/mbm or P4/mmm, which is paraelectric but ferroelastic, between the tetragonal P4bm and the cubic Pm  $\overline {\rm{3}} $m in the BNT–BT system. Based on the above, Dittmer et al.Reference Dittmer, Jo, Damjanovic and Rödel36 gave the structural evolution of BNT–BT–0.18KNN in terms of the XRD length scale as follows:
 $$P{\rm{4}}bm{\rm{(FE}}/{\rm{FEla)}}\buildrel {{\rm{\tilde\,160 \,\,}}^{\rm{o}} {\rm{C}}} \over \longrightarrow P4{\rm{/}}mbm{\rm{(PE}}/{\rm{FEla)}}\buildrel {{\rm{\tilde\,\,250\,\, }}^{\rm{o}} {\rm{C}}} \over \longrightarrow Pm\overline 3 m{\rm{(PE}}/{\rm{PEla)\quad,}}$$
where FE, PE, FEla, and PEla denote ferroelectric, paraelectric, ferroelastic, and paraelastic, phases, respectively. In our work, we suggest that BNT–0.08KNN may also underwent the similar structural evolution (without regard to the phase transition temperature), as temperature increases due to the discontinuous change in the intensity of (110) reflection similar to that in BNT–BT–0.18KNN samples. However, the observed phase transition showed by the high temperature XRD measurements is not well corresponded with the dielectric anomalies (especially, for the first dielectric anomaly T R-T observed below 130 °C), which are generally induced by the change of the phase structure, and this should be ascribed to the relaxor nature of the BNT-based ceramics.Reference Dittmer, Jo, Damjanovic and Rödel36 On the other hand, the detection limit of the x-ray apparatus that generally reflected the large-length-scale average structures may be the other reason for the undetectable structural change observed from the XRD study. In this sense, Raman spectroscopy, which could probe a local ionic configuration with short length scale usually less than 10 nm, should be more useful to reflect the structural changeReference Wang, Xu, Tang, Wang, Shi and Leung17 [see detailed discussion of Fig. 12(a)]. This inconsistency between the dielectric properties and the high temperature XRD measurements is still not clear in this work and is left to us for further studies.
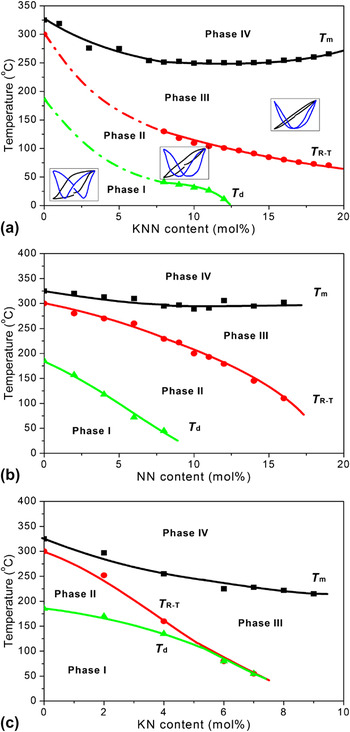
Based on the obtained phase transition temperatures T d, T R-T, and T m, we sketch the phase diagram for BNT–xKNN as a function of temperature, which is displayed in Fig. 7(a). The data for samples with x < 0.08 were derived from Refs. Reference Kounga, Zhang, Jo, Granzow and Rödel5 and Reference Laoratanakul, Yimnirun and Wongsaenmai39. Meanwhile, the transition in hysteresis behavior is schematically illustrated in the inset of this figure. Additionally, the phase diagrams of BNT–xNaNbO3 (NN) and BNT–xKNbO3 (KN) based on Hiruma et al.Reference Hiruma, Nagata and Takenaka10 are displayed in Figs. 7(b) and 7(c) for comparison. In these figures, the phases at temperatures of T < T d, T d < T < T R-T, T R-T < T < T m, and T > T m were denoted as phases I, II, III, and IV, respectively. Hiruma et al.Reference Hiruma, Nagata and Takenaka10 suggested that the crystal structure of phases I and II is rhombohedral (R3c) for BNT–xNN and BNT–xKN systems. While for BNT–xKNN, tetragonal (P4mm) should not be excluded in both phases I and II as that in BNT–BKT–Bi(Zn1/2Ti1/2)O3 systemReference Patterson, Cann, Pokorny and Reaney40 because of the existing rhombohedral/tetragonal boundary at x = 0.07.Reference Kounga, Zhang, Jo, Granzow and Rödel5 Also, pseudocubic should be included in phase II in BNT–xKNN system. The crystal structure of phase III was a pseudocubic because of the very small lattice anisotropy, and phase IV is generally described as a cubic phase for BNT-based solid solutions.Reference Hiruma, Nagata and Takenaka10 For the diagram of BNT–xKNN, both T d and T R-T almost linearly shift to lower temperatures with increasing x. T d reaches RT at x = 0.10–0.12, and T R-T is expected to reach RT at approximately x = 0.30 according to its decreasing slope.
Phase diagram for (a) BNT–xKNN as a function of temperature [phase diagrams for BNT–xNN and BNT–xKN based on Hiruma et al.Reference Hiruma, Nagata and Takenaka10 are displayed in (b) and (c), respectively, for comparison].

BNT-based solid solutions were reported to have three types of phase diagramsReference Hiruma, Nagata and Takenaka10: type A [BNT–xNN system as shown in Fig. 7(b)], type B [BNT–xKN system as represented in Fig. 7(c)], and type C (BNT–xBKT and BNT–xBT systems). In our work, it can be found that BNT–xKNN solid solution has a type A phase diagram, as that formed in BNT–xNN system. Normally, it is difficult to completely form homogeneous solid solutions with a type A phase diagram,Reference Hiruma, Yoshii, Nagata and Takenaka6, Reference Hiruma, Nagata and Takenaka10 and BNT–xNN was thought as the only solid solution with a type A phase diagram that can be completely formed without the appearance of secondary phases.Reference Hiruma, Nagata and Takenaka10 While our work shows that BNT–xKNN solid solution is another one that formed type A phase diagram without any secondary phases-in the whole composition range.Reference Zuo, Fang and Ye41 In this study, although BNT–xKNN forms a type A phase diagram as BNT–xNN system, it is interesting to find out that this system exhibits more similar electrical characteristics as BNT–xKN system with a type B phase diagram. The diagram shows that saturated polarization hysteresis behavior with a typical butterfly-shaped strain hysteresis loop dominates at low KNN concentrations <0.09, while as the KNN content increases from 0.10 to 0.12, there is a transition from FE to “pinched” loops with a significant reduction in remanent polarization and coercive field and also with the absence of the negative strain S neg. This is followed by a transition to a pseudolinear behavior at compositions above 13 mol% KNN. In BNT–xNN system, previous reportReference Hiruma, Nagata and Takenaka10 suggested that the disappearance of the virgin strain S v (which is essentially the same as the negative strain S neg) corresponds to the shift of both T d and T R-T to RT. Once S v vanishes, samples possess the nature of the “AFE” phase. However, in this work, even the T R-T of the studied samples with x > 0.12 is still above RT; these samples show a predominantly “AFE” structure as evident by zero S v. That is the difference between the two systems BNT–xKNN and BNT–xNN.
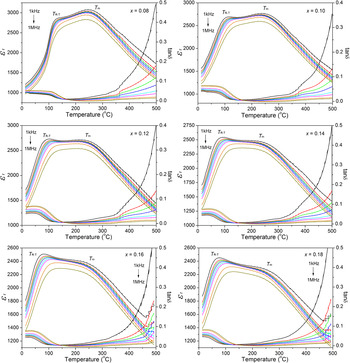
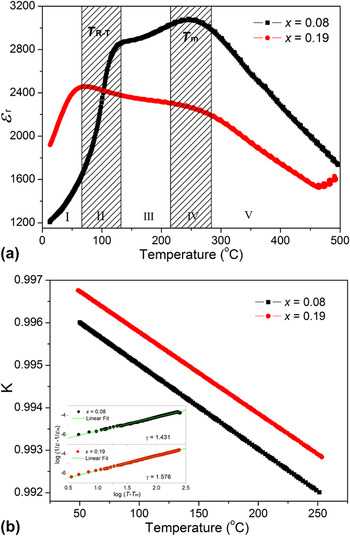
Figure 8 shows frequency dispersion of the dielectric properties of BNT–xKNN ceramics with different KNN content. All indicated samples show evidence of diffuse phase transition, which is typical for relaxor FEs. Two obvious dielectric anomalies, which correspond to T R-T at low temperature and T m at high temperature, respectively, are exhibited by these materials. Generally, T m stands for the temperature corresponding to the maximum value of εr, which is also called the Curie temperature T c, and εr at T R-T is much smaller than εr at T m. However, in this work, we find an interesting phenomenon that maximum εr of samples with “AFE” phase (x > 0.12) are not achieved at the Curie temperature T m but at a transition temperature of T R-T. Besides, a stronger frequency dispersion of εr is clearly seen for those with the “AFE” phase: εr decreases and its maximum at T R-T significantly shifts to higher temperatures as the measurement frequency increases. It seems that the relaxor behavior of the ceramics with “AFE” phase is stronger than that of samples with FE phase. To further characterize the dielectric dispersion and diffuseness of the phase transition, the modified Curie–Weiss lawReference Uchino and Nomura42 and microdomain–macrodomain transition theoryReference Zhang and Yao43, Reference Gao, Liu, Xu, Hu, Cao, Hong and Tian44 described in the following were used to illustrate the relaxor behavior of the BNT–xKNN system.
Frequency dispersion of the dielectric properties of BNT–xKNN ceramics with different KNN content.

It is well known that the diffuseness of a phase transition can be determined from the modified Curie–Weiss lawReference Uchino and Nomura42, Reference Gao, Liu, Xu, Hu, Cao, Hong and Tian44:
 $$<![CDATA[$$1/{\rm{\varepsilon }}_{\rm{r}} - 1/({\rm{\varepsilon }}_{\rm{r}} )_{\rm{m}} \, = \,(T - T_{\rm{m}} )^{\rm{\gamma }} /C\quad,$$
where γ and C are all constants and the γ value is between 1 and 2. The limiting values γ = 1 and γ = 2 obey the equation of Curie–Weiss law, which are the characteristics for the case of normal FE and for an ideal relaxor FE, respectively.Reference Uchino and Nomura42 The logarithmic plots related to this equation for samples are shown in the inset of Fig. 9(b). A linear relationship of log(1/ε − 1/εm) and log(T − T m) was obtained, and the slope of the fitting curves is used to determine the γ value. As x increases, γ increases from 1.43 at x = 0.08 to 1.58 at x = 0.19, suggesting that the relaxor characteristic of the ceramics has been enhanced by increasing KNN content.
(a) The sketch map of microdomain–macrodomain transition for BNT–xKNN ceramics with x = 0.08 and x = 0.19. (I: Macrodomain region; II: Macrodomain + microdomain; III: Microdomain region; IV: Microdomain + Polar micro region; V: Polar micro region.) (b) The microdomain stability of BNT–0.08KNN and BNT–0.19KNN ceramics (inset shows the diffusion coefficient γ of the ceramics).

(a) P-E hysteresis loops and associated I-V curves for BNT–xKNN samples. (b) The bipolar strain responses of the BNT–xKNN ceramics measured at a frequency of 10 Hz.

The model of the stability of microdomain–macrodomain transition proposed by Zhang and YaoReference Zhang and Yao43 has been successfully applied to describe the relaxor behavior of the Pb-based complex perovskite relaxor FE. For FE ceramics, three states, macrodomain, microdomain, and polar micro region, appear in order with the increase of temperature. The microdomain–macrodomain transition is a quantum transition process, and the heating force and energy force are mainly the driving forces. The stability of microdomain–macrodomain transition can be judged by both the activating energy and state parameter. According to Gaussian distribution equation, the function of the amount of microdomain (N) and the Curie temperature (T m) can be expressed asReference Zhang and Yao43:
 $$<![CDATA[$$N\,\,{\rm{ = \,\,}}N_{\rm{0}} \exp [ - (T - T_{\rm{m}} )^2 /2{\rm{\sigma }}^2 ]\quad,$$
while the volume percentage of microdomain (ϕ) can be calculated from:
 $$<![CDATA[$$\varphi = N/N_0 = \exp [ - (T - T_{\rm{m}} )2/2{\rm{\sigma }}^2 ]{\rm{\quad,}}$$
where N 0 is the total number of the polar microregions, and σ is the temperature range of diffusion phase transition. From Eq. (3), it can be deduced that the main factors influencing ϕ are T m and σ. So Eq. (3) can be simplified to Eq. (4),Reference Zhang and Yao43 which is a new criterion to judge the stability of microdomain:
 $$<![CDATA[$$K = \exp [ - T/({\rm{\sigma }}T_{\rm{m}} )]\quad,$$
where K stands for the stability of microdomain. The larger the K value is, the more stability of microdomain is, and the more energy is needed for the microdomain–macrodomain transition. Thus, the stronger relaxor behavior emerges.
For BNT-based ceramics, it is suggested that the microdomain–macrodomain transition occurs at T R-T,Reference Gao, Liu, Xu, Hu, Cao, Hong and Tian44 corresponding to rhombohedral–tetragonal phase transition. And microdomains will be separated to form polar microregions at Curie temperature T m, which is related to tetragonal–paraelectric phase transition. So based on the above, the sketch map of microdomain–macrodomain transition for the indicated ceramics (BNT–0.08KNN, which is typical FE, and BNT–0.19KNN, which lies deep in “AFE” phase) is shown in Fig. 9(a). There are five parts (I–V) in the sketch map, where T R-T lies in the second part corresponding to microdomain–macrodomain transition. Based on Eq. (4), the K values for the two compositions in the temperature range from 50 to 250 °C are obtained and presented in Fig. 9(b). It can be clearly found that the K value of samples with the composition x = 0.19 lies deep in the “AFE” phase is larger than that of samples possess FE phases (x = 0.08), indicating that microdomains of samples lie deep in the “AFE” phase are more stable than those of samples with FE phases. As a result, it is hard for samples with x = 0.19 to take microdomain–macrodomain transition, i.e., the formation of “AFE” phase will enhance the stability of microdomain and make it difficult to grow from microdomain to macrodomain, which can be well confirmed by the weak FE of these samples.Reference Zhang and Yao43 Accordingly, enhanced relaxor behavior occurs. Based on the above, it can be easily to explain why samples dominated by “AFE” phase exhibited stronger relaxor behavior compared with those dominated by FE phase.
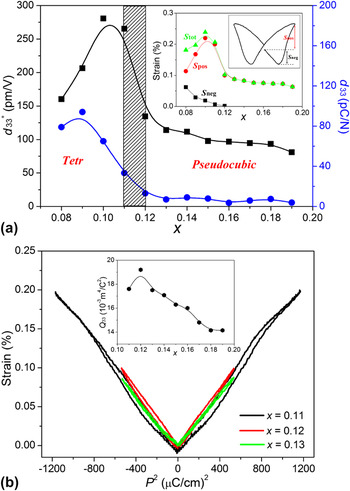
Since the depolarization temperature T d of BNT ceramics has been shifted to RT by adding a small amount of KNN, it is expected that the “AFE”-like behavior, which can be very helpful for enhancing the electric-field-induced strain, will occur in the BNT?xKNN system. Figure 10(a) shows P-E hysteresis loops and associated I-V curves for BNT–xKNN samples at a frequency of 10 Hz. The P-E loop of BNT–0.08KNN displays a saturated typical FE behavior (actually, a slight trace of constriction of the loop exists in this composition as evident by the emergence of additional current peakReference Wang, Xu, Tang, Wang, Shi and Leung17), while a small amount of KNN weakens the FE activity of the ceramics with a significant reduction in the coercive field (E c) as well as the remanent polarization (P r), whereas the maximum polarization (P m) is essentially unchanged. For BNT–0.11KNN samples, “pinched” hysteresis loop appeared, suggesting that the long-range FE order is disturbed by the addition of KNN.Reference Zhang, Kounga, Aulbach, Ehrenberg and Rödel15, Reference Seifert, Jo and Rödel16 This means the dominant state changes from a FE to an “AFE” phase as KNN content increases, and this can be confirmed by the fact that the decrease in P r is more pronounced than that in P m since the presence of the “AFE” ordering is less influential to P m than P r.Reference Kounga, Zhang, Jo, Granzow and Rödel5, Reference Zhang, Kounga, Aulbach, Ehrenberg and Rödel15 The compositionally induced FE–“AFE” phase transition from 0.08KNN to 0.12KNN can also be verified by bipolar strain measurements, as provided in Fig. 10(b). BNT–0.08KNN shows a typical butterfly-shaped strain hysteresis loop whose maximum strain level contributing to the unipolar strain is 0.11% and whose negative strain [the definition for negative strain is given in the inset figure in Fig. 11(a)] that is only visible during the bipolar cycles is 0.06%. On the other hand, as KNN content increases, the strain loops show a drastic deviation from typical FE behavior, which is evident from the absence of the negative strain that is closely related to domain back switching during bipolar cycles. Instead, a pronounced enhancement of the strain response affecting entirely the unipolar strain is noted. Maximum strains of 0.22% and 0.20% are observed for x = 0.10–0.11, respectively. Beyond this region, the maximum strain drastically decreases, whereas the negative strain totally vanished as shown in the inset figure of Fig. 11(a). In addition, we noted that samples with x > 0.12, which lie in the “AFE” phase at RT, exhibit very slim P-E and S-E profiles and also maintain relative large strain level of 0.06–0.10%. So these materials have great potential in the fabrication of high performance lead-free electrostrictors.
(a) Compositional dependences of piezoelectric constant d 33 and normalized strain d 33* for BNT–xKNN ceramics [the inset is composition-dependent negative strain (S neg), positive strain (S pos), and total strain (S tol)]. (b) S-P 2 curves of the indicated samples, indicating electrostrictive effect (the inset shows the electrostrictive coefficient Q 33 for BNT–xKNN ceramics with the composition lies in the AFE phase).

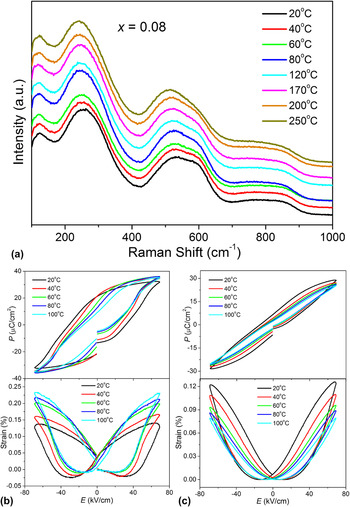
(a) Raman spectroscopy data for BNT–0.08KNN compositions with increasing temperature, showing the tetragonal to cubic transition, (b) and (c) P-E hysteresis loops and the S-E loops as a function of temperature for BNT–0.08KNN and BNT–0.11KNN ceramics, respectively, measured at 10 Hz.

Figure 11(a) shows the piezoelectric constant d 33 and the normalized strain d 33* (=S max/E max) under unipolar driving at an applied field of E = 80 kV/cm for BNT–xKNN. Although the maximum d 33 value of 94 pC/N was obtained at x = 0.10, this decreased markedly to 28 pC/N at x = 0.12, and nearly, no piezoelectric response (d 33 < 10 pC/N) was observed at x > 0.12. Meanwhile, the electric strain rapidly increased at x = 0.09–0.11 for BNT–xKNN ceramics. In the present work, although the BNT–xKNN system shows the same composition dependence of electrical properties behavior as those reported in BNT-based systems with a type B phase diagram,Reference Hiruma, Nagata and Takenaka10, Reference Wang, Hussain, Jo and Rödel12, Reference Hiruma, Nagata and Takenaka14, Reference Hirum, Nagata and Takenaka45 and the studied system also undergoes a tetragonal–pseudocubic phase transition, the enhanced strain in this system can still not be ascribed to the role of the MPB [a MPB between the rhombohedral and relaxor pseudocubic (tetragonal) phases, reported by Hiruma et al.Reference Hiruma, Nagata and Takenaka10, Reference Hiruma, Nagata and Takenaka14]. One noticeable reason is that the system has a type A phase diagram, which is similar to BNT–xNN system.Reference Hiruma, Nagata and Takenaka10 On the other hand, the limited enhancement in the strain response achieved in this system is not derived from the role of MPB, while induced by the appearance of FE–“AFE” transition at RT.
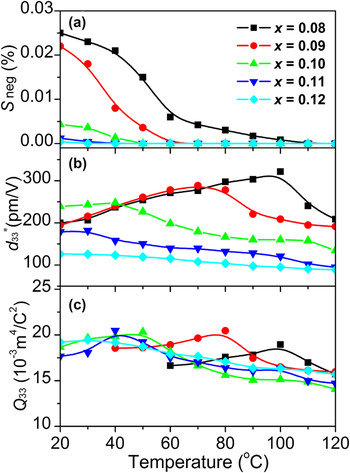
Figure 11(b) shows the plots of S and P 2 derived from the RT S-E curve of Fig. 10. The slope of this curve corresponds to the electrostriction coefficient.Reference Zhang, Kounga, Jo, Jamin, Seifert, Granzow, Rödel and Damjanovic24 Inset figure is the variation of electrostrictive coefficient Q 33 as a function x. In the present work, the S-P 2 curves deviate slightly from linear relations, which means that the contribution of electrostriction strain should be predominant. The averaged electrostrictive coefficient (Q 33) is calculated to be of 0.017–0.019 m4/C2 for samples with x = 0.11–0.15, and these values is comparable to the reported lead-based electrostrictive material [for Pb(Mg1/3Nb2/3)–PbTiO3,Reference Zhang, Yan, Yang and Cao25Q 33 is reported to be about 0.017 m4/C2]. Moreover, this class of materials is not only attractive for RT properties but is predicted to have low temperature dependence in electrostrictive strain also. The electrostrictive coefficients for BNT–0.12KNN samples are found to have little temperature dependence in the temperature range examined. Even at the temperature as high as 120 °C, the Q 33 still maintains >80% of its initial value, suggesting the good temperature stability of the studied samples [see Fig. 13(c)]. These results demonstrate that this material is suitable for high precision positioning devices and actuators.
Summary of (a) negative strain values, (b) normalized strain d 33*, and (c) electrostrictive coefficient Q 33 of BNT–xKNN (x = 0.08–0.12) system as a function of temperature.

It is well demonstrated that enhanced bipolar strain up to 0.22% could be obtained for BNT–0.11KNN at RT with the assistance of a FE to “AFE” phase transition. However, since the stability of the FE phase depends not only on composition but also on temperature, the temperature-dependent strain was investigated. It is found that at high temperature, the ceramics will be electrically broken down when the applied field reaches 80 kV/cm. Therefore, when carrying out the temperature-dependent electrical measurements, the applied field is fixed at a relative low field of 70 kV/cm. Figure 12 provides temperature dependence of bipolar strain curves of (b) 0.08KNN and (c) 0.11KNN, and the detailed data for d 33*, S neg, and Q 33 at different temperatures are summarized in Fig. 13. To confirm the phase transition, temperature-dependent Raman spectra of 0.08KNN were recorded and presented in Fig. 12(a). At RT, three modes located at roughly 270, 526, and 595 cm−1 were detected. When temperature increases from 60 to 80 °C, we can clearly see the abrupt change of the 260 cm−1 mode in its relative intensity. According to Petzelt et al.,Reference Petzelt, Kamba, Fabry, Noujni, Porokhonskyy, Pashkin, Franke, Roleder, Suchanicz, Klein and Kugel46 in BNT single crystal, a phase transition occurs near 100 °C, accompanied by the disappearance of the 65 cm−1 mode and a sudden relative intensity change of the 270 cm−1 mode. Considering the results in Fig. 3, we are inclined to attribute the observed change of relative intensity of 270 cm−1 mode between 60 and 80 °C to a FE–“AFE” phase transition, Furthermore, as temperature is increased, the 595 cm−1 mode shifts down and decreases in relative intensity, showing a softening behavior. At 250 °C, the mode tends to disappear and almost overlaps with the 526 cm−1 mode. This indicates the occurrence of “AFE”–paraelectric transition,Reference Zhang, Kounga, Aulbach and Deng47 which is consistent with results in Fig. 3. For temperature dependence of bipolar strain curves of (b) BNT–0.08KNN, the S–E curve exhibits a butterfly shape, which is typical for materials with FE order. However, when the temperature extends beyond T d (40 °C) reaching 60 °C, only little “negative strain” can be observed [Fig. 13(a)], indicating a FE–“AFE” phase transition at this point. With further increasing temperature up to 100 °C, the shape of the strain curve does not change anymore, while the strain further increases. The sight increases of strain observed at temperatures higher than T d should be ascribe to the increase of usable strain resulting from the reduction of remanent strainReference Wang, Hussain, Jo and Rödel12 as evident by the continuous declining remanent polarization P r beyond T d. By contrast, due to the dominant presence of the “AFE” phase for (c) BNT–0.11KNN, no S neg is observed in the whole measurement temperature range, and consistent decrease of strain with increasing temperature is observed.
IV. CONCLUSIONS
The effects of KNN on the phase structure, relaxor behavior, and electric field-induced strain properties of BNT–xKNN system were investigated. Results showed that BNT–xKNN system underwent a phase transition from a tetragonal to a pseudocubic phase with increasing KNN content. The relaxor behavior of the ceramics was enhanced by increasing KNN content, and this behavior can be well explained by the microdomain–macrodomain transition theory with calculating criterion K. Moreover, the addition of KNN adjusted the depolarization temperature T d to RT and correspondingly induced an enhancement of the unipolar strain, which is 0.22% at x = 0.10–0.11. Furthermore, high electrostrictive response with large electrostrictive coefficient Q 33 (0.017 ∼ 0.019 m4/C2) and good temperature stability comparable with that of traditional Pb-based electrostrictors was achieved in compositions with x = 0.12–0.15, revealing that these materials should be very promising for practical applications as lead-free electrostrictive materials.
ACKNOWLEDGMENTS
The authors would like to acknowledge the support from the National Natural Science Foundation of China under Grant No. 50932007 and Shanghai Municipal Natural Science Foundation under Grant No. 12ZR1434600.