Introduction
Fire is a potentially important ecological disturbance for insects living in parklands and boreal forests of Canada (McCullough et al. Reference McCullough, Werner and Neumann1998; Boulanger and Sirois Reference Boulanger and Sirois2007), especially in fire-prone jack pine woodlands (Cayford and McRae Reference Cayford and McRae1983). Wildfires vary in intensity and frequency, thereby increasing landscape heterogeneity and biodiversity (Cobb et al. Reference Cobb, Langor and Spence2007), but also causing direct mortality of many insects, simplifying some aspects of habitat structure, and decreasing resource availability through combustion of plant biomass (Bond and van Wilgen Reference Bond and van Wilgen1996; Andersen et al. Reference Andersen, Parr, Lowe and Müller2007; Parr and Andersen Reference Parr and Andersen2008; Matsuda et al. Reference Matsuda, Turchak, Brehme, Rochester, Mitroic and Fisher2011). After a fire, it is typical to observe few changes in ant species richness (Houdeshell et al. Reference Houdeshell, Friedrich and Philpott2011) and total ant (Hymenoptera: Formicidae) abundance (Andersen et al. Reference Andersen, Parr, Lowe and Müller2007; Parr and Andersen Reference Parr and Andersen2008). It is also typical for particular ant species to increase while others decrease in occurrence post-fire (Farji-Brener et al. Reference Farji–Brener, Coreley and Bettinelli2002; Lafleur et al. Reference Lafleur, Parsons, Bradley and Francoeur2006; Verble and Yanoviak Reference Verble and Yanoviak2013).
These observations have been explained in terms of interspecific competition (Andersen and Yen Reference Andersen and Yen1985; Lafleur et al. Reference Lafleur, Parsons, Bradley and Francoeur2006), duration of woodland regeneration (Lafleur et al. Reference Lafleur, Parsons, Bradley and Francoeur2006), changes in leaf litter (Christiansen and Lavigne Reference Christiansen and Lavigne2010), and changes in vegetation and canopy structure (Andersen et al. Reference Andersen, Parr, Lowe and Müller2007; Parr and Andersen Reference Parr and Andersen2008). The role of life history and organismal traits in promoting post-fire survival, however, has not been carefully assessed. Insects with traits that enhance survivorship during and after a fire are expected to benefit in a post-fire environment and therefore increase in abundance (as measured through pitfall catch), and unlike the majority of ground-dwelling insects, ants may possess just such traits (McCullough et al. Reference McCullough, Werner and Neumann1998; Lafleur et al. Reference Lafleur, Parsons, Bradley and Francoeur2006; Parr and Andersen Reference Parr and Andersen2008; Houdeshell et al. Reference Houdeshell, Friedrich and Philpott2011).
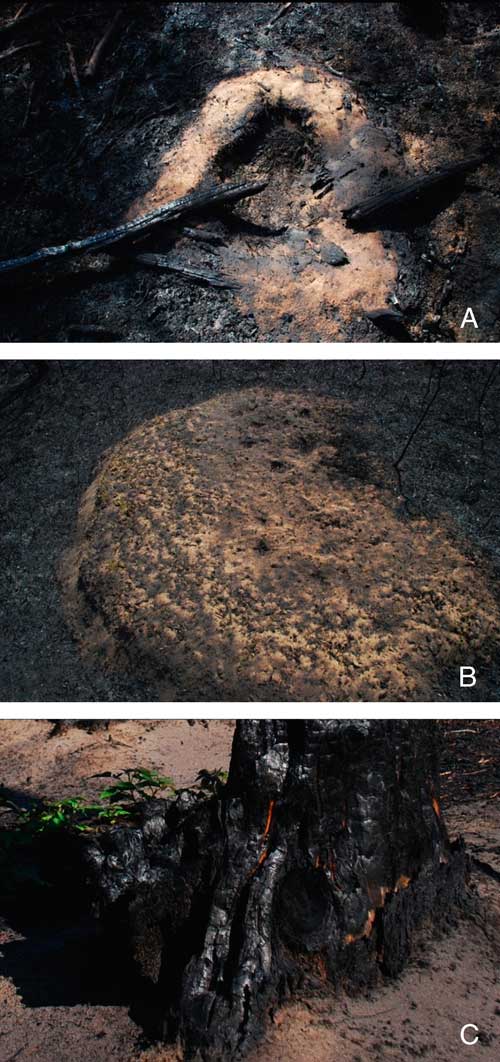
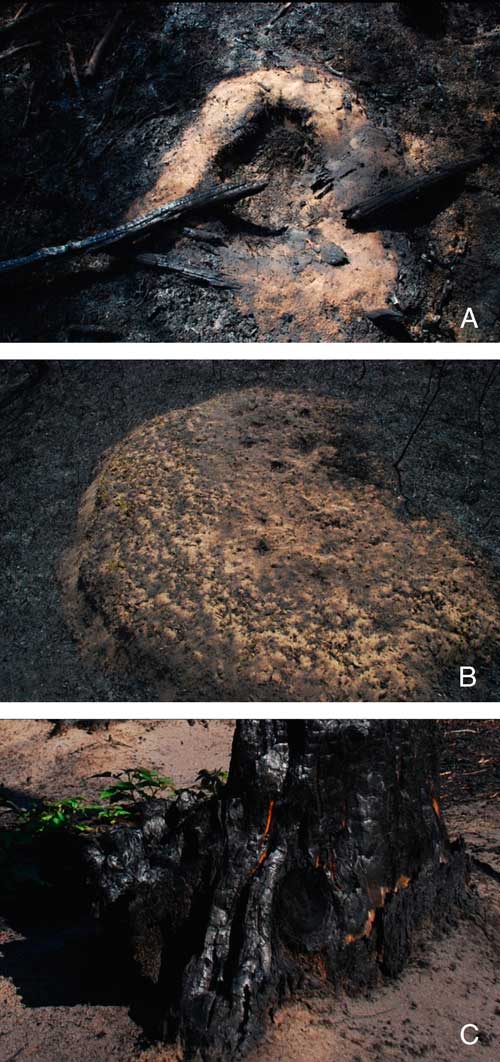
During the course of related studies, three out of four of our research sites burned in wildfires (accidentally ignited by all-terrain vehicle users) in May 2009 and 2010. We took advantage of these unplanned “experiments” to determine the effects of fire on the ant assemblages under study. We were curious whether the fires had any impact on overall ant forager catch and species richness, and whether particular life history or organismal traits were associated with species that were resilient or benefited from fire (here measured by forager catch). We predicted that (1) overall ant forager catch and species richness would change little, (2) ants that nest and store their brood in combustible materials (wood or thatched nests) would have higher rates of mortality compared with ants that nest in the soil, since such nests burned below the surface of the ground (Fig. 1), (3) smaller ants, and those with smaller colony sizes, would be better able to cope as resources may be limited after fire, and (4) ants with polygynous colonies (with multiple queens) would be capable of more readily replacing lost workers.
The effect of fire on selected ant nests; (A) thatched nest of Formica obscuriventris, burned into the ground following fire, and containing numerous dead workers; (B) nest mound of Formica podzolica, not burned and with new grass growth. Both photographs: 8 May 2009, two days after fire. (C) wood nest of Camponotus herculeanus in the base of a burnt tree (12 May 2009).
Materials and methods
Sampling design
Research was conducted at four areas of stabilised sand dunes in the Redwater Sand Hills of central Alberta, Canada. These included the North Bruderheim Provincial Recreation Area (53°52'8.54"N, 112°56'40.10"W), the Northwest of Bruderheim Natural Area (53°52'8.54"N, 112°56'40.10"W), the Opal Natural Area (53°59'13.59"N, 113°18'34.96"W), and the Redwater Provincial Recreation Area (53°56'27.66"N, 112°57'17.19"W). All four contain heterogeneous jack pine (Pinus banksiana Lambert (Pinaceae)) woodlands with intermixed aspen (Populus Linnaeus (Salicaceae))/jack pine forest as well as patches of black spruce (Picea mariana (Miller) Britton, Sterns, and Poggenburg (Pinaceae)) in the low-lying, inter-dune areas. Both North Bruderheim Provincial Recreation Area and Northwest of Bruderheim Natural Area burned during May of 2009, and the Opal Natural Area burned during May of 2010. Redwater Provincial Recreation Area has not burned in over 50 years, according to sources from Alberta Parks and Protected Areas.
Ten research plots were established randomly in each of the four study areas but restricted to upland jack pine woodlands, for a total of 40 sampled plots. Each plot was 0.1 ha in size (20×50 m), with 10 pitfall traps placed in pairs, 5 m from the centre line, at 10 m intervals (i.e., 5, 15, 25, 35, and 45 m). Plots were orientated so that traps were under homogeneous canopy cover. Each plot was categorised as FY/POST (“Fire Year” in 2009, Post fire in 2010), PRE/FY (Pre fire in 2009, Fire Year in 2010), or CON (control, unburned in either year).
Pitfall traps were used to sample ants, twice each summer, during both 2009 and 2010, and samples from each trap were combined to produce one sample per year. Each pitfall trap was a small polypropylene cup, 64 mm in diameter, and 76 mm deep, filled with 30 mL of propylene glycol, an effective preservative that is non-toxic to vertebrates (Weeks and McIntyre Reference Weeks and McIntyre1997; Bestelmeyer et al. Reference Bestelmeyer, Agosti, Alonso, Brandão, Brown and Delabie2000). Traps were set with their tops flush with the ground, and were retrieved after 24 hours. Sampling took place in late May to early June, and in late July to early August, on warm days without rainfall.
The use of pitfall traps to monitor ant forager catch is not ideal (Higgins and Lindgren Reference Higgins and Lindgren2012), although we do consider it the best available method, and our sampling effort may significantly underrepresent total ant abundance at these sites. Pitfall trap catches are biased towards more active, terrestrial ant species (Andersen Reference Andersen1983; Higgins and Lindgren 2012), and complexity of ground-level structure (e.g., leaf litter, rocks, high dead wood) can reduce ant capture rates in pitfall traps, which can confound comparisons of ant forager numbers among habitats (Adis Reference Adis1979; Bestelmeyer et al. Reference Bestelmeyer, Agosti, Alonso, Brandão, Brown and Delabie2000). Additionally, pitfall traps primarily sample more active surface ants, rather than arboreal, leaf litter dwelling, or subterranean ant species (Majer Reference Majer1996). However, many large and surface-active ants showed decreases in our study, despite a bias towards such ants in pitfall samples, giving us greater confidence in the value of pitfall trap sampling in our study sites.
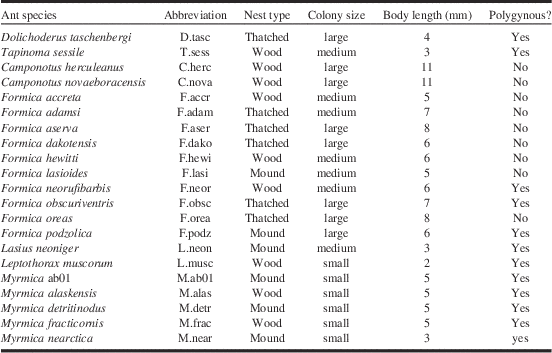
Specimens were transferred to 75% ethanol for storage and identification, with some individuals pinned, as voucher specimens and to facilitate examination under a Leica M80 stereo microscope (Leica Microsystems, Wetzlar, Hesse, Germany). Ants were identified using draft versions of the key in Glasier et al. (Reference Glasier, Acorn, Nielsen and Proctor2013), and additional keys Wheeler and Wheeler (Reference Wheeler and Wheeler1963), Francoeur (Reference Francoeur1973), Wheeler and Wheeler (Reference Wheeler and Wheeler1986), MacKay and MacKay (Reference MacKay and MacKay2002), Hansen and Klotz (Reference Hansen and Klotz2005), and Trager (Reference Trager2013). Vouchers of each species encountered are now deposited in the E. H. Strickland Entomological Museum at the University of Alberta, Edmonton, Alberta, Canada. Life history traits (nest type, colony size, average body size, and polygyny) were assigned (Table 1) on the basis of our field observations, specimens, and the publications of Creighton (Reference Creighton1950), Wheeler and Wheeler (Reference Wheeler and Wheeler1963), Francoeur (Reference Francoeur1973), Wheeler and Wheeler (Reference Wheeler and Wheeler1986), MacKay and MacKay (Reference MacKay and MacKay2002), Hansen and Klotz (Reference Hansen and Klotz2005), and Fisher and Cover (Reference Fisher and Cover2007). Colony size was estimated on the basis of field observations, as well as published information (Wheeler and Wheeler Reference Wheeler and Wheeler1963; MacKay and MacKay Reference MacKay and MacKay2002; Hansen and Klotz Reference Hansen and Klotz2005), and classified into three categories (small<1000, medium 1000–5000, large>5000).
Traits of ant species examined.

Abbreviations refer to Figs. 3–4. Nest types: mound – a mound of mineral soil; thatched – a mound of pine needles and/or grass fragments; wood – nest within living or dead wood. Colony: number of workers in an average colony (small<1000, medium 1000–5000, large>5000). Body size (mm): length excluding the mandibles. Polygynous: with multiple queens (yes) or not (no).
Statistical analysis
Mean, standard error, and response ratios (Hedges et al. Reference Hedges, Gurevitch and Curtis1999) were calculated for species richness, total forager catch of all ant species, and forager catch of individual ant species. Response ratios are the natural log of the ratio of mean effect in PRE/FY or FY/POST plots to mean effect in CON plots calculated via the following equation:
 $$RR=\ln \left( {{{\bar{X}_{e} } \over {\bar{X}_{c} }}} \right)$$
where RR is the response ratio; ln the natural log;
 $$\bar{X}_{e} $$
the ratio of mean forager catch (or species richness) in 2010 in PRE/FY or FY/POST plots, divided by the mean forager catch (or species richness) for 2009;
 $$\bar{X}_{c} $$
the ratio of mean forager catch (or species richness) in the control plots in 2010, divided by the mean forager catch (or species richness) for 2009.
Response ratios describe treatment effects over time (pre-fire versus post-fire) relative to natural variation in the control samples. For analyses of ant forager catch, a constant value of “1.0” was added to the forager catch for each species in each sample, to avoid division by zero (i.e., if a species was absent one year and present the other). A change was considered significant if the lnRR fell more than one standard error above or below zero.
We used linear regression models in Stata 11 (StataCorp 2009) to determine which life history and organismal traits influenced ant forager catch. Models were estimated for the PRE/FY and FY/POST treatments by assessing models with Akaikes’s information criterion (AIC). Model uncertainty was estimated using model-weighted averages for coefficients, standard errors, and confidence intervals based on Akaike weights (Burnham and Anderson Reference Burnham and Anderson2011).
Results
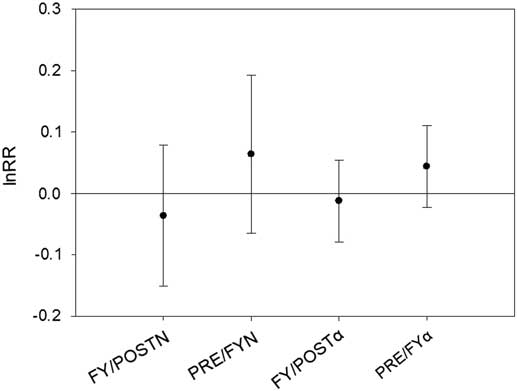
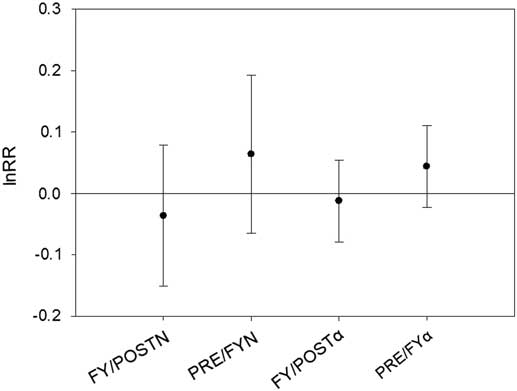
A total of 33 714 ants, representing 33 species, were collected from the 40 plots (15 CON; 10 FY/POST; 15 PRE/FY) during the summers of 2009 and 2010. One undescribed species of Myrmica Latreille (Hymenoptera: Formicidae) was sampled, and coded as Myrmica ab01 (Glasier et al. Reference Glasier, Acorn, Nielsen and Proctor2013). As predicted, total ant forager catch and species richness did not significantly change in either the FY/POST or PRE/FY plots (Fig. 2).
Response ratios for total ant catch (N) and species richness (α). lnRR is the natural of response ratio. FY/POST plots were sampled the summer after the fire in May 2009, and the following summer of 2010. PRE/YF plots were sampled pre-fire in the summer of 2009, and post-fire in May 2010, during the summer. Error bars represent standard error.
Of the 33 ant species sampled, 21 were abundant enough to assess individual response ratios (20 species were assessed in PRE/FY plots and 19 in FY/POST plots). Species with insufficient sample sizes, included Camponotus nearcticus Emery, Formica adamsi Wheeler, F. densiventris Viereck, F. impexa Wheeler, F. oreas Wheeler, F. subintegra Wheeler, F. ulkei Emery, Lasius alienus (Förster), L. niger (Linnaeus), L. pallitarsis (Provancher), L. subumbratus Viereck, Polyergus mexicanus Forel, Formicoxenus hirticornis (Emery), and Harpagoxenus canadensis Smith.
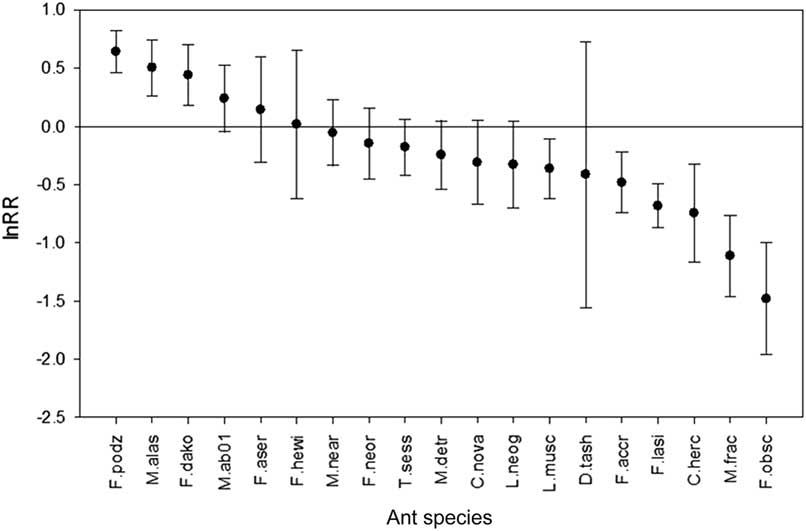
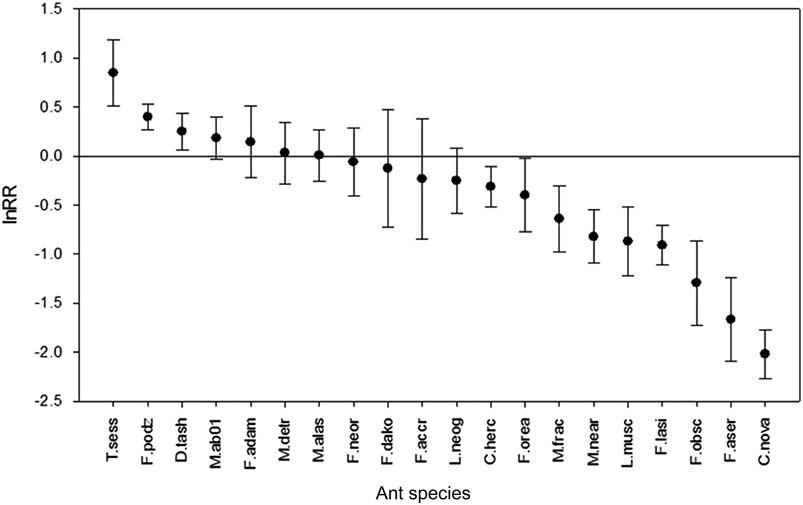
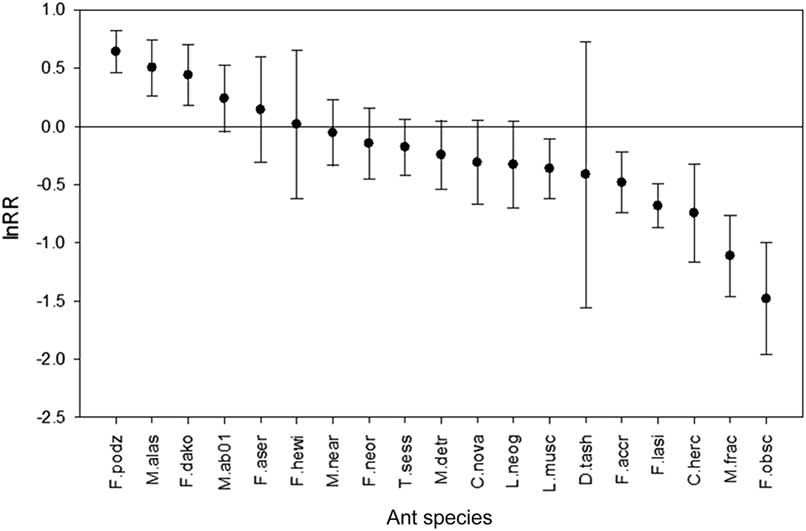
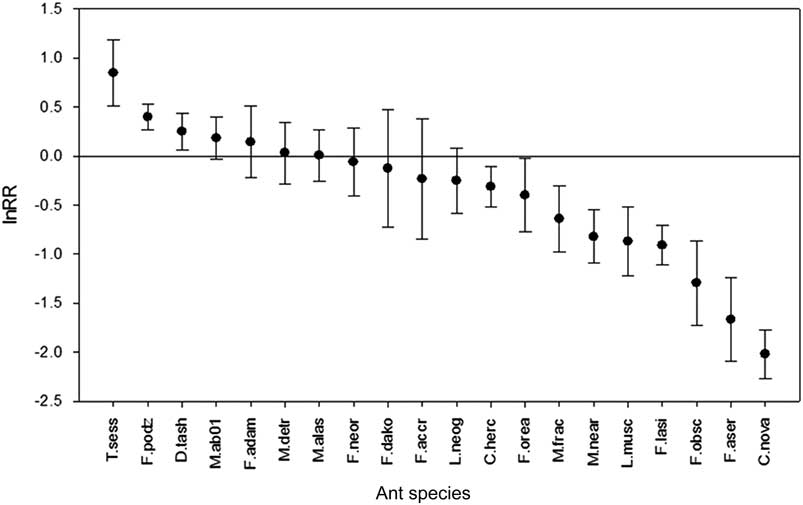
The effect of fire varied among species. In PRE/FY plots, three species increased in forager catch immediately after the fire, 10 species showed no significant change in forager catch, and six species decreased significantly in forager catch (Fig. 3). In the FY/POST plots, forager catch of three species increased significantly one year after fire, eight species showed no change, and nine species decreased significantly (Fig. 4). Only one species, Formica podzolica Francoeur, showed an increase in forager catch in both PRE/FY and FY/POST treatments, while five species (Camponotus herculeanus (Linnaeus), Formica lasioides Emery, Formica obscuriventris Mayr, Leptothorax muscorum (Nylander), and Myrmica fracticornis Forel) decreased in both treatments. Four species showed no significant change in forager catch in either PRE/FY or FY/POST plots (Formica neorufibarbis Emery, Lasius neoniger Emery, Myrmica ab01, and Myrmica detritinodus Emery).
Response ratios by ant species sampled in the summer of 2009, pre-fire, and then after the fire in May 2010, during the summer (PRE/FY). Error bars represent standard error. lnRR is the natural log of response ratio. Abbreviations for species can be found in Table 1.
Response ratios for ant species sampled during the summer of 2009, immediately following a May wildfire, and the summer of 2010, one year after (FY/POST). Error bars represent standard error. lnRR is the natural log of response ratio. Abbreviations for species can be found in Table 1.
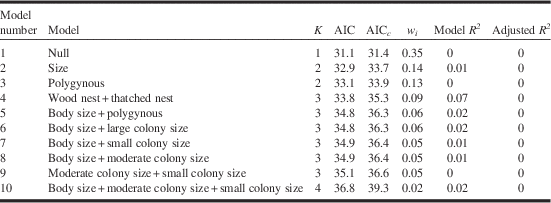
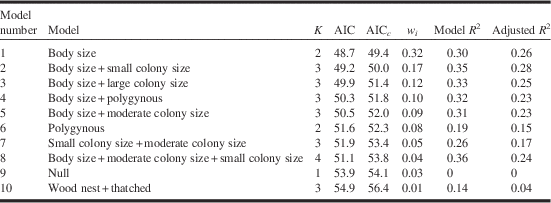
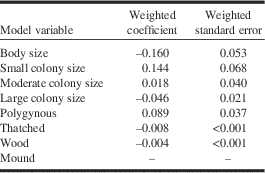
Significant effects of life history and organismal traits on post fire catch were observed. For the PRE/FY data, none of the candidate models tested were supported more than the null model (Table 2), suggesting that forager catch immediately after the fire was not affected by the traits examined. However, all models except nest type were supported more strongly than the null model one year post fire (FY/POST) (Table 3). The most strongly supported model explaining changes in species forager catch for FY/POST was body size ( w i =0.324), followed by body size and small colony size ( w i =0.169) and body size and large colony size ( w i =0.119). Remaining models all had Akaike weights of<0.1. Model averaged coefficients were estimated for all variables across all models (Table 4). Small body size was positively related to increases in forager catch in the summer one year after fire. Ants in small colonies also positively responded to fire, while ants in large colonies were negatively affected by fire.
Candidate models describing changes in ant catch immediately after a May fire (PRE/YF).
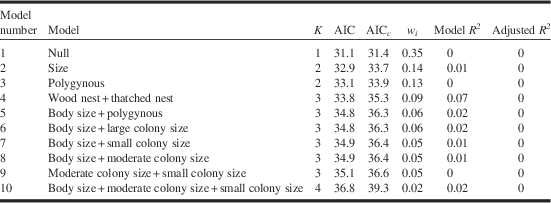
Models are ranked from most to least supported based in Akaike weights (w i ). K: number of parameters; AIC: Akaike’s information criterion; AIC c : small – sample-sized corrected AIC; w i : Akaike weights, and model fit (Model R 2 and adjusted R 2)
Candidate regression models describing changes in ant catch one year after a May fire (FY/POST).

Models are ranked from most supported to least supported based in Akaike weights (w i ). K: number of parameters; AIC: Akaikes’s information criterion.
Model-weighted coefficients and standard errors describing change in ant catch for the summer one year after fire (FY/POST) on sand hills of central Alberta, Canada

Discussion
Overall resilience of sand hill ants to fire
Previous studies of ants in a variety of ecosystems suggest that ant forager catch and species richness do not change significantly following fire (Andersen et al. Reference Andersen, Parr, Lowe and Müller2007; Parr and Andersen Reference Parr and Andersen2008; Matsuda et al. Reference Matsuda, Turchak, Brehme, Rochester, Mitroic and Fisher2011). Our observations, although based on a small number of fires, confirm this pattern, and a review of the literature suggests that three factors may be responsible. First, ants will redistribute worker roles depending on the needs of the colony (Hölldobler and Wilson Reference Hölldobler and Wilson1990; Tschinkel Reference Tschinkel1999). After a fire, and high worker mortality, more workers may take on a foraging role when food is scarce. Second, ants that typically forage in trees or vegetation are forced to forage on the ground after fires (Parr and Andersen Reference Parr and Andersen2008), thereby increasing their occurrence in pitfall trap samples. Third, most ants are able to survive fire underground (Parr and Andersen Reference Parr and Andersen2008; Houdeshell et al. Reference Houdeshell, Friedrich and Philpott2011), and most of the ants we studied are subterranean nesters.
The role of life history and organismal traits
In the summer following a May fire (PRE/FY), life history and organismal traits do not appear to influence total ant forager catch (Table 2), even though some species increased in number while others declined (Fig. 3). We were surprised that nest type had no effect, given our observations of deeply burned thatch nests, with large numbers of dead workers within them, in the days immediately following the fires, when some areas of the forest were still smoldering (Fig. 1). It seems likely that most ants in these colonies took refuge from the fire in the substrate below the thatch. Similarly, ants nesting in wood often have additional galleries underground (Hansen and Klotz Reference Hansen and Klotz2005). Additionally, ants that nest in dead wood often prefer moist wood, compared to dry, as it is easier to excavate (Lindgren and MacIsaac Reference Lindgren and MacIsaac2002), and perhaps is less likely to burn.
However, changes in forager catch one year after fire (FY/POST) were related to life history and organismal traits. In particular, larger bodied ants declined in forager catch relative to smaller-bodied species (Tables 3–4), suggesting that smaller ants have an advantage after fire. As larger ants, which are generally more abundant and ecologically dominant (Deslippe and Savolainen Reference Deslippe and Savolainen1995), are reduced in number, smaller ants may experience reduced competition, including interference competition. Additionally, smaller ants require less energy (Lafleur et al. Reference Lafleur, Parsons, Bradley and Francoeur2006), and as fire simplifies the environment (Bond and van Wilgen Reference Bond and van Wilgen1996) and reduces food availability, larger ants could be more sensitive to reductions in food resources. Similarly, colony size was an important factor affecting changes in ant forager catch. Smaller colony size was positively related to increases in ant forager catch one year after fire, while species with large colonies were more likely to decrease in ant forager catch (Tables 3–4). This could be related to reductions in food resource availability. We suspect, however, that actual colony sizes, rather than a categorical assessment by species, would have been a more useful measure had we been able to obtain it.
We also suspect that distribution of food sources, such as other insects (Cobb et al. Reference Cobb, Langor and Spence2007), including aphids for honeydew farming (Weber Reference Weber1935; MacKay and MacKay Reference MacKay and MacKay2002), and the trophic levels of each species in the ant fauna, may also be important in determining the responses of ants to disturbance by wildfire, but data for these variables were not available to us.
Responses of individual ant species to fire
Only one species of ant, Formica podzolica, increased in forager catch in both the summer immediately following a May fire (PRE/FY) and in the summer after that (FY/POST). This species is ubiquitous over most of western Canada in most terrestrial ecosystems (Francoeur Reference Francoeur1973; Lafleur et al. Reference Lafleur, Parsons, Bradley and Francoeur2006), and can be considered a generalist, preying on insects and farming aphids for honeydew (Deslippe and Savolainen 1994). The generalist lifestyle of F. podzolica may be advantageous following ecological disturbance. Alternatively, F. podzolica forager numbers may have increased due to reduced numbers of foraging competitors. Other studies have found that the more dominant ants of the Formica rufa (Formica obscuriventris and Formica oreas) and Formica sanguinea (Formica aserva) species groups are often in direct competition with Formica podzolica (Deslippe and Savolainen Reference Deslippe and Savolainen1995) and these three species did indeed decrease in forager catch in FY/POST sites (Fig. 4).
Other species that decreased in forager catch in both PRE/FY and FY/POST plots include three ants that nest almost exclusively in dead wood (Lindgren and MacIsaac Reference Lindgren and MacIsaac2002): Camponotus herculeanus (the largest ant in the fauna), Leptothorax muscorum (the smallest ant in the fauna), and Myrmica fracticornis (another small ant). Although the effect of nest type was not strongly supported, nesting in dead wood is the only trait we assessed that is shared among these species. It may be that nests of these three species possess few underground chambers, and that our categories for nest type were poorly defined with respect to this characteristic. However, it is not immediately apparent why the forager abundance of two other species, Formica lasioides and Formica obscuriventris, declined, since these species do not appear to share any obvious life history or organismal traits (Creighton Reference Creighton1950; Wheeler and Wheeler Reference Wheeler and Wheeler1963), although Formica obscuriventris construct large thatched nests that readily burn (Fig. 1).
Four ant species were found to be fire resilient, showing no change in forager catch in either PRE/FY or FY/POST plots, and three are sand specialists. Myrmica ab01, Myrmica detritinodus, and Lasius neoniger are common in the central Alberta sand hills while Formica neorufibarbis is less common, but widespread in North America, especially in conifer forests (MacKay and MacKay Reference MacKay and MacKay2002). Since sandy soils are often associated with fire prone vegetation such as pines, it may be that these ants are well adapted to frequent fires.
It should also be noted that both 2009 and 2010 were abnormally dry years (Alberta Agriculture and Rural Development, AgroClimatic Information Service 2013). This may well have contributed to the incidence of fire in the first place, and it is also conceivable that the effects of fire would differ in moist as opposed to dry years. Ultimately, long-term studies will be needed to fully elucidate the response of sand hill ants to occasional wildfires.
Acknowledgements
For help in the field, the authors would like to thank Caroline LeCourtois, Carl Conradi, Christie Kneteman, Darin Molinaro, Sonya Odsen, Jeff Proudfoot, and Mike Yang. At the E.H. Strickland Entomological Museum, they thank Danny Shpeley and Felix Sperling. They would also like to thank John Spence, Heather Proctor, and Ryan McKellar for their constructive comments. Additionally, the authors would like to thank the anonymous reviewers for their constructive and helpful comments. Funding for this work was provided by ACA Grants in Biodiversity, supported by the Alberta Conservation Association and the Development Initiatives Program via Alberta Sports, Recreation, Parks, and Wildlife Foundation.