Introduction
Increasing evidence from epidemiological and pathological studies has demonstrated that cerebrovascular disease (CeVD) is a common contributor to cognitive impairment (Patel et al., Reference Patel2013; Riba-Llena et al., Reference Riba-Llena2015; Hilal et al., Reference Hilal2015b), and it accelerates further decline in dementia patients (Mungas et al., Reference Mungas2002; Kalaria et al., Reference Kalaria, Akinyemi and Ihara2012). In addition, the accumulation of CeVD markers is reported to be associated with worse cognitive function (Staekenborg et al., Reference Staekenborg, Van Straaten, Van der Flier, Lane, Barkhof and Scheltens2008; Huijts et al., Reference Huijts, Duits, Van Oostenbrugge, Kroon, De Leeuw and Staals2013).
Previous studies have established the concept that CeVD scales may be an effective composite measure to assess CeVD burden so as to investigate associations between CeVD and important clinical outcomes, such as cognitive dysfunction, as well as prognosis (Prins et al., Reference Prins2005; Luchsinger et al., Reference Luchsinger2009; Huijts et al., Reference Huijts, Duits, Van Oostenbrugge, Kroon, De Leeuw and Staals2013; Staals et al., Reference Staals, Makin, Doubal, Dennis and Wardlaw2014).
A novel approach was recently established to assess global CeVD burden, which takes into account the independent contributions of both small and large vessel disease markers, including white matter hyperintensities (WMH), lacunes, cerebral microbleeds, cortical strokes, and intracranial stenosis. A simplified composite CeVD burden scale was constructed and validated in memory clinic and population-based settings (Xu et al., Reference Xu2015, Reference Xu2016b).
While previous longitudinal studies reported that individual CeVD markers, such as WMH or lacunes, were associated with cognitive decline (Carmichael et al., Reference Carmichael2010; Schmidt et al., Reference Schmidt2012; Kim et al., Reference Kim2016), the contribution of global CeVD burden to cognitive and functional decline has not been examined.
Hence, the present study sought to investigate the predictive ability of the global CeVD burden scale on longitudinal cognitive and functional decline over 2 years in elderly participants across the spectrum of cognitive impairment.
Methods
Study population. We employed a case-control design for the current study. Participants were recruited from two memory clinics in Singapore from August 2010 to January 2016 (Hilal et al., Reference Hilal2015a). Participants were consecutive eligible patients with impairment in at least one cognitive domain on a locally-validated standard neuropsychological battery (the vascular dementia battery, VDB) (Narasimhalu et al., Reference Narasimhalu2009, Reference Narasimhalu2011). Domain impairment on the VDB was defined as 1.5 or more standard deviations (SDs) below education-adjusted norms. Controls with no cognitive impairment on the VDB were recruited from the community. Participants were eligible if they were aged 50 years or older, had sufficient language skills for neuropsychological assessment, fulfilled diagnostic criteria specified below, and provided informed consent. Patients with a diagnosis of major psychiatric illness and/or substance abuse disorder, patients with cognitive impairment due to a history of traumatic brain injury, multiple sclerosis, tumor, epilepsy, vascular dementia, systemic disease, and patients with significant visual and auditory abnormalities were excluded.
Standard protocol approvals, registrations, and patient consents. Ethical approval was obtained from the National Healthcare Group Domain-Specific Review Board. Written informed consent was obtained in the preferred language of the participants.
Baseline vascular risk profile. A vascular risk profile was recorded for all study participants at baseline, which included the following: (1) hypertension: defined as a previous diagnosis of hypertension, or the use of antihypertensive medication, or a systolic blood pressure ≥140 mmHg and/or diastolic blood pressure ≥90 mmHg on clinical assessment; (2) hyperlipidemia: defined as a previous diagnosis of hyperlipidemia, the use of lipid-lowering medication, or total cholesterol levels ≥4.14 mmol/L; (3) diabetes mellitus: defined as a previous diagnosis of diabetes mellitus, or the use of glucose-lowering medication, or glycated haemoglobin ≥6.5%; (4) ischemic heart disease: defined as a previous diagnosis of any of the following – myocardial infarction, congestive heart failure, atrial fibrillation, coronary angioplasty, or angina pectoris; (5) self-reported history of smoking; (6) documented history of stroke.
Research diagnosis. Patient diagnoses were made at weekly consensus conference attended by neurologists, psychologists, and research personnel. Details from the clinical examination, detailed medical history, blood investigations, neuropsychological testing, and MRI scans were reviewed.
Participants were categorized into the following three clinical diagnostic groups:
(1) Alzheimer's disease (AD); according with NINCDS-ADRDA criteria (McKhann et al., Reference McKhann, Drachman, Folstein, Katzman, Price and Stadlan1984).
(2) Cognitive Impairment-No Dementia (CIND); with impairment of at least one cognitive domain on the VDB and functional independence, hence not meeting DSM-IV for dementia (Association and Association, Reference Association and Association1994).
(3) Controls had no objective cognitive impairment on the VDB.
Neuroimaging protocol. MRI scans were performed on a 3T Siemens Magnetom Trio Tim scanner, using a 32-channel head coil. A number of MRI brain sequences were performed to allow morphologic and microstructural assessments, including T1-weighted Magnetization Prepared Rapid Gradient Recalled Echo (MPRAGE), Fluid Attenuated Inversion Recovery (FLAIR), T2- weighted and Susceptibility Weighted Imaging (SWI).
MRI markers of CeVD were graded using the following criteria:
Large vessel disease markers
- Cortical infarcts were defined as focal lesions involving cortical grey matter, signal following CSF intensity, hyperintense rim on FLAIR images, and tissue loss of variable magnitude, with prominent adjacent sulci and ipsilateral ventricular enlargement (Wardlaw et al., Reference Wardlaw2013).
- Intracranial stenosis was defined as narrowing exceeding 50% of the luminal diameter in any of the intracranial vessels assessed on 3D time of flight magnetic resonance angiography (TOF MRA). The images were first visually assessed on the reconstruction images and the final decision on stenosis (>50%) was made on the source images (Hilal et al., Reference Hilal2015b). Assessed arteries were the vertebral, basilar, internal carotids, posterior cerebral, posterior communicating, middle cerebral, and anterior cerebral arteries. As MRA was only able to assess intracranial vessels, the extracranial arteries were not graded for stenosis.
Small vessel disease markers
- Lacunes were defined as lesions, 3–15 mm in diameter, with low signal on T1-weighted image and FLAIR; a high signal on T2-weighted image, and a hyperintense rim with a center following cerebrospinal fluid intensity on FLAIR (Hilal et al., Reference Hilal2015a).
- WMH were graded using the modified Fazekas scale (Fazekas et al., Reference Fazekas1993).
- Microbleeds were defined on SWI sequences using Brain Observer Micro Bleed Scale (BOMBS) (Greenberg et al., Reference Greenberg2009).
One grader (SH), who was blinded to clinical data, graded each participant's MRA. The previously established intra-rater reliability was excellent (intraclass correlation coefficient, ICC¼ 0.88).
CeVD burden scale. Baseline MRI markers of CeVD were transformed into binary variables and recorded as presence/absence of multiple lacunar infarcts, multiple microbleeds, cortical infarcts, intracranial stenosis, and moderate to severe severity of WMH on the Fazekas scale. A 4-category CeVD burden scale (Xu et al., Reference Xu2015) was applied
(1) None/very mild CeVD burden: none/mild WMH (using the modified Fazekas Scale) and <2 other CeVD indicators.
(2) Mild CeVD burden: none/mild WMH and ≥2 other CeVD indicators.
(3) Moderate CeVD burden: moderate/severe WMH and <2 other CeVD indicators.
(4) Severe CeVD burden: moderate/severe WMH and ≥2 other CeVD indicators.
Grading of MRI markers of cortical infarcts, intracranial stenosis, white matter hyperintensity (WMH), lacunar infarcts, cerebral microbleeds, and medial temporal atrophy (MTA) followed previously described procedures (Xu et al., Reference Xu2015, Reference Xu2016b). Details on the construction of the total CeVD scale and examples of CeVD markers (Figure I) can be found in supplemental material.
Neuropsychological assessment. A locally modified version of the National Institute of Neurological Disorders and Stroke and Canadian Stroke Network (NINDS-CSN) Vascular Cognitive Impairment (VCI) battery which has been validated in a Singaporean general memory clinic population was utilized (Xu et al., Reference Xu2016a).
In the present study, the NINDS-CSN protocol was administered by qualified psychologists to all participants at baseline and subsequently at annual follow-up visits for up to 2 years. The protocol covers the following domains:
(1) Working memory: Digit span forward (DSF) and backward (DSB) (Wechsler, Reference Wechsler2009);
(2) Executive function: Verbal fluency (McKhann et al., Reference McKhann, Drachman, Folstein, Katzman, Price and Stadlan1984), Color Trail Test (CTT) A&B (D'Elia et al., Reference D'Elia, Satz, Uchiyama and White1996);
(3) Language: 15-item modified Boston Naming Test (mBNT) (Mack et al., Reference Mack, Freed, Williams and Henderson1992);
(4) Visuomotor speed: Symbol Digit Modalities test (SDMT) (Smith, Reference Smith1973);
(5) Visuospatial function: Rey Complex Figure Test (RCFT) Copy (Meyers and Meyers, Reference Meyers and Meyers1994);
(6) Recall and recognition: RCFT immediate/delayed recall and recognition, Hopkins Verbal Learning Test (HVLT) (Brandt, Reference Brandt1991) immediate/delayed recall and recognition.
Several cross-cultural adaptations were made: Digit span tests were included as impairments of attention and working memory are present in VCI (Tham et al., Reference Tham2002). The CTT is a cultural analogue of the trial making test included in the original NINDS-CSN protocol and has been validated in Asia21. Participant's depressive and neuropsychiatric symptoms were evaluated using the geriatric depression scale (GDS) (Hachinski et al., Reference Hachinski2006) and neuropsychiatric inventory (NPI) (Cummings, Reference Cummings1997).
Outcome measures. Study participants were followed up annually for up to 2 years. Longitudinal cognitive change was defined as differences in global and domain-specific cognitive z-scores between baseline and follow-up visits. Deterioration in global function was defined as a global score increment of ≥0.5 on the Clinical Dementia Rating (CDR) questionnaire at follow-up compared to baseline. Conversion from CIND to AD, and mortality in a 2-year period was recorded.
Statistical analysis
All individual test raw scores on the NINDS-CSN battery were transformed to standardized z-scores using the means and SDs of the control group. The score for each domain was generated by averaging the z-scores of individual tests and standardized using the composite mean and SD of the control group. To obtain the global cognition domain z-score for each patient, the domain z-scores were averaged and standardized using the mean and SD of the control group. At follow-up, global and domain-based cognitive z-scores were obtained using baseline means and SDs of the control group.
Generalized estimating equation (GEE) models were conducted to determine whether baseline CeVD scores predicted rate of cognitive decline over a 2-year period (in months from baseline). CeVD score × time interactions were explored. A time-to-event survival analysis was performed to examine Hazard Ratio (HR) of CeVD scores in detecting adverse clinical outcomes such as deterioration of global function, conversion to AD, and mortality. Kaplan–Meier curves were conducted to illustrate the differences in progression patterns between predefined groups of participants based on CeVD, adjusting for age, education, gender, baseline cognitive performance as measured on the Mini Mental State Examination (MMSE), and baseline MTA severity. Log-rank tests were used to test for differences across groups.
In addition, as multiple testing was performed for domain specific z-scores, the Bonferroni correction was employed to obtain an adjusted significance level for each domain specific test: ~0.05/6 = 0.008. All analyses were performed using standard statistical software (Statistical Package for Social Science, SPSS V24, SPSS Inc., USA).
Results
Baseline characteristics
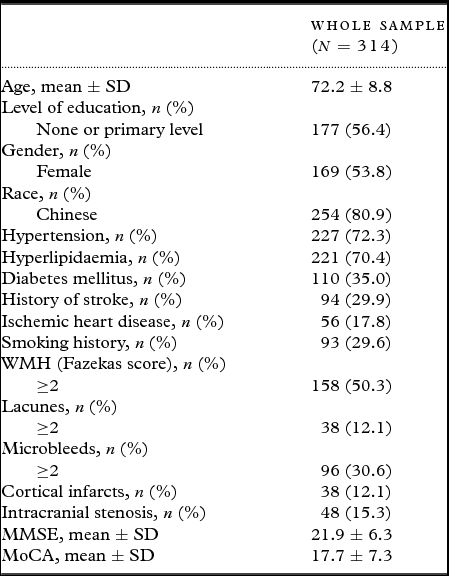
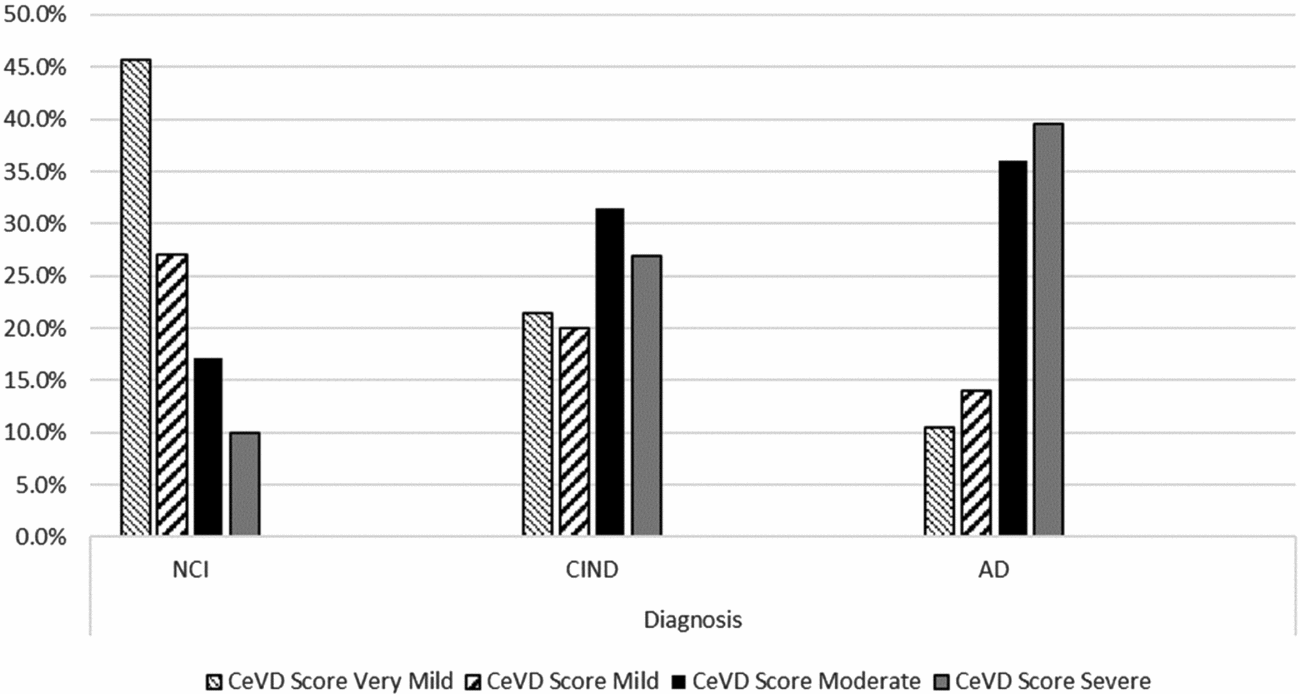
Of the 318 participants recruited at baseline, four did not completed MRI scans or had MRI scans that could not be graded, leaving a total of 314 participants included in this analysis. The baseline characteristic including demographic and clinical features, MRI findings and cognitive scores of the study participants are detailed in Table 1. Of these 314 participants, the CeVD score distribution was none/very mild – 102 (32.5%), mild – 31 (9.9%), moderate – 94 (29.9%), and severe – 87 (27.7%), respectively. Distribution of CeVD scores in different diagnostic groups are presented in Figure 1.
Study sample characteristics

MMSE, Mini-Mental State Examination.
MoCA, Montreal Cognitive Assessment.
WMH, White Matter Hyperintensities
Distribution of CeVD scores in different diagnostic groups.

Cognitive trajectory of CeVD groups during follow-up
During the course of the study, a total of 76 participants showed deterioration in global function, 20 participants from the none/very mild-mild CeVD group, and 56 from the moderate-severe CeVD group. This included nine CIND participants who converted to AD (one from none/very mild-mild CeVD group and eight from the moderate-severe CeVD group). In addition, 19 participants died, three from the none/very mild-mild CeVD group and 16 from the moderate-severe CeVD group.
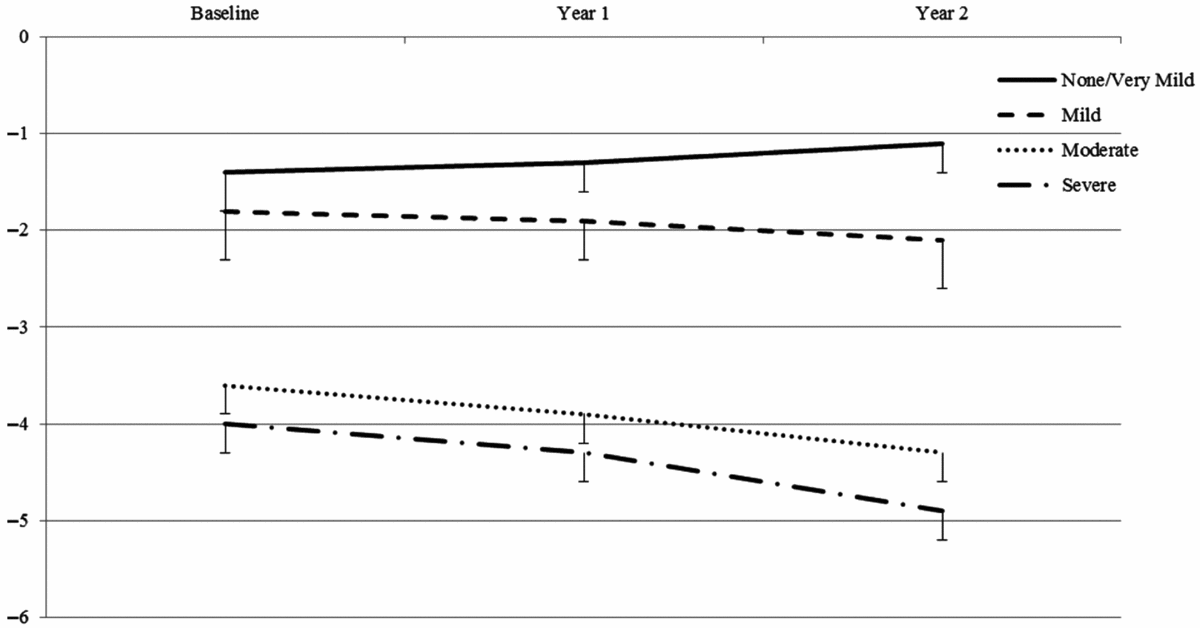
The trajectory of global cognitive performance from baseline to year 2 visits for different CeVD severity groups are presented in Figure 2. There were significant interactions between CDR global scores and CeVD severity (β (SE) = 0.25 (0.10), p = 0.01) as well as between time and CeVD severity (β (SE) = −0.12 (0.04), p = 0.02).
Trajectory of cognitive performance over time among different CeVD groups. CeVD, cerebrovascular disease.

There was 1.14 and 1.42 units decline per year on global cognitive z-scores in moderate and severe CeVD groups, respectively as compared to the none/very mild CeVD group, while participants with mild CeVD remained stable over time (β (SE) = −0.09 (0.43), p = 0.83). In terms of specific cognitive domains, a decline in working memory, executive function and visuomotor speed domains were observed in participants with CeVD (Table 2), controlling for all covariates.
Rate of decline in domain-specific cognitive scores over a 2-year period

CeVD, cerebrovascular disease. Values are β (95% CI). Reference group: none/very mild CeVD group.
* p < 0.01.
Ϯ p < 0.05.
Interaction (time × CeVD severity), β (SE) = −0.12 (0.04), p = 0.02.
Sensitivity analysis
The data loss ratio was 18.5% (73 out of 314 were lost to follow-up) at the year 2 visit. There was no significant difference between participants who completed all three visits and those who did not on CeVD severity (69.9% vs. 55.2% with moderate-to-severe level of CeVD, χ 2 = 2.56, p = 0.14), dementia diagnosis (45.3% vs. 33.6% with AD, χ 2 = 3.75, p = 0.15), and on baseline MMSE total score (22.43 ± 5.9 vs. 21.0 ± 7.0, p = 0.08).
Sensitivity analyses were subsequently performed using GEE models. In model 1, any individual who had a missing value for global cognitive z-score at visit 3 (year 2) was assigned the best score from the previous two visits; in model 2, any individual who had a missing value for global cognitive z-score at visit 3 was assigned the worst score from the previous two visits. GEE analyses showed that a severe level of CeVD burden at baseline significantly predicted rate of global cognitive decline over a 2-year period, regardless of data loss (p < 0.01 for both models).
Survival analysis
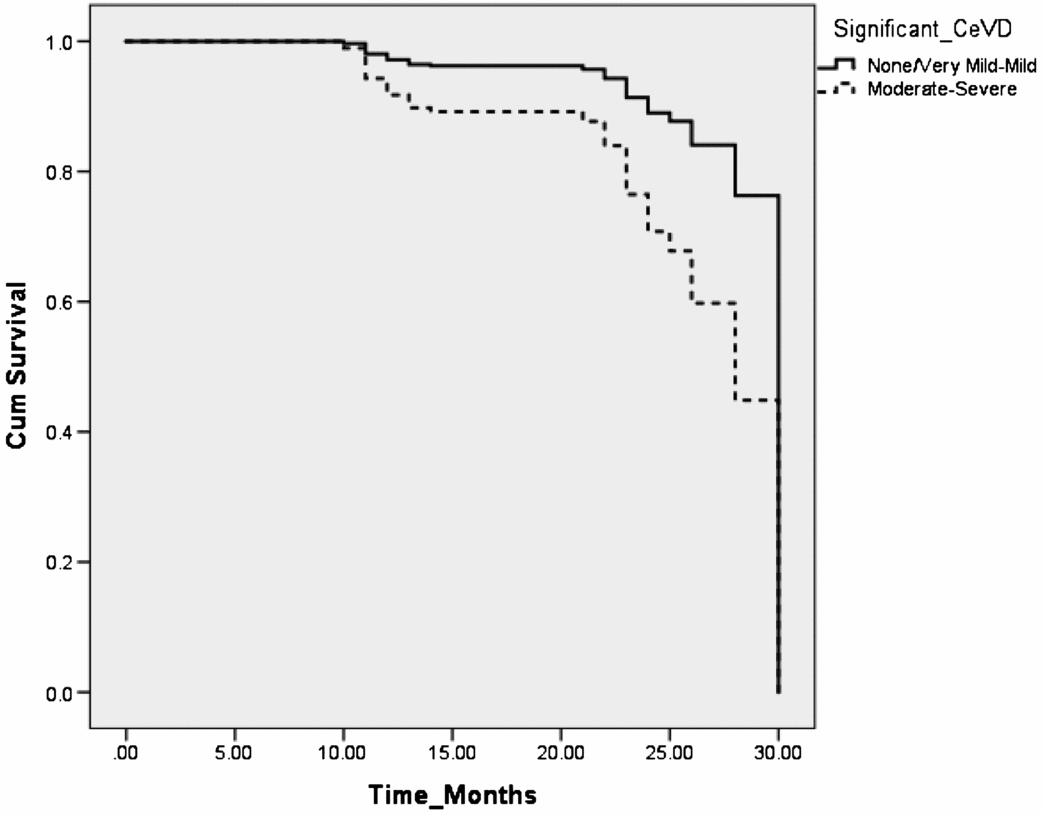
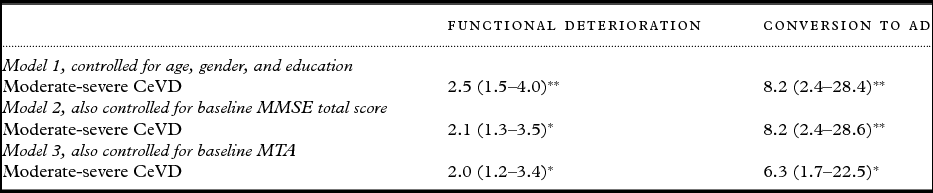
Kaplan–Meier curves demonstrated categorical effects that were of more clinical relevance (Figure 3). Log-rank test comparing the four groups showed a significant difference (χ 2 = 21.93, p < 0.001). In multivariate cox-regression analysis, moderate-severe CeVD was predictive of global decline at year 2 (HR = 2.0, 95% CI = 1.2–3.4, p < 0.01), and conversion to dementia (HR = 6.3, 95% CI = 1.7–22.5, p < 0.01) controlling for all covariates (Table 3).
Kaplan–Meier curves.

Hazard Ratio for deterioration in global function

MTA, medial temporal atrophy. Values are HR (95% CI).
**p < 0.001; *p < 0.01; Ϯp < 0.05.
In addition, moderate CeVD only predicted significant deterioration at year 2 (HR = 1.8, 95% CI = 1.2–3.4), severe CeVD predicted functional decline from year 1 onward (HR = 2.0, 95% CI = 1.1–3.6), and mortality in a 2-year period (HR = 18.3, 95% CI = 2.4–139.6).
Discussion
The main finding of the present study is that severity of global CeVD burden significantly predicted longitudinal cognitive and global functional decline over a 2-year period, while elderly participants with none-mild level of CeVD remained cognitively and functionally stable, participants with moderate-severe CeVD showed progressive deterioration in cognitive function, and higher rate of conversion to AD, in a 2-year period, independent of neurodegenerative disease as measured by MTA.
The association between impaired cerebrovascular and cognitive function in patients has been extensively investigated (Silvestrini et al., Reference Silvestrini2006; Kalaria, Reference Kalaria2012). Mechanisms of the strong link between CeVD and cognitive impairment has been elucidated using clinicopathological evidence. Although efforts have been made on CeVD phenotyping (Knopman, Reference Knopman2007), these studies focused on the grading of individual CeVD markers, rather than an integrated combination of small- and large-vessel disease markers. The present study adopted a validated measure of quantifying individual CeVD neuroimaging markers into a composite scale, hence enabling severity grading of global CeVD burden. This approach has been proven reliable in detecting cognitive impairment and dementia in cross-sectional studies (Xu et al., Reference Xu2015, Reference Xu2016b). In this study, we have extended the use of this CeVD scale to longitudinal data and reported its predictive validity for cognitive and global functional decline. In addition, we compared the predictive ability of the CeVD scale with another widely used scale for white matter disease (Fazeka's scale). Results showed that Fazekas score was not able to predict longitudinal cognitive decline (β (SE) = −0.49 (0.30), p = 0.11). Hence, our results further emphasizes the importance of using an integrated measure of all CeVD markers, rather than using individual markers.
A previous study has found that memory impairment, rather than CeVD, predicts progression of MCI to dementia (DeCarli et al., Reference DeCarli2004). However, the present study showed that severe level of CeVD burden predicts conversion to dementia, independent of baseline cognitive performance. The differences in results could be due to different study populations. The current study was a case-control design, with the majority of the study sample having either a clinical history of vascular disease or neuroimaging evidence of significant CeVD. This may have led to a population enriched with VCI. Furthermore, we found that on specific domain-specific cognitive performance, a greater severity of CeVD predicted a higher rate of decline in vascular-related domains such as working memory, executive function and visuomotor speed, but not in memory. This suggests that different baseline pathologies (neurodegenerative disease or CeVD) may independently result in conversion to dementia.
The present study has weaknesses and strengths. Although the current study reported a reasonable data retention rate (83% over a 2-year period), and that sensitivity analyses did not alter the results, the mild-moderate data loss rate limits further analysis in the predictive ability of CeVD severity in detecting other long-term adverse outcomes, such as comorbidity, institutionalization, and recurrent vascular events. A larger study with a longer follow-up may resolve these questions. Additionally, the present study did not take into consideration the interaction between β-amyloid and CeVD due to unavailability of data. Previously, the overlap between neurodegenerative and vascular disease in the pathogenesis of dementia (Iadecola, Reference Iadecola2010) was reviewed, suggesting the important role cerebral amyloid plays synergistically with CeVD in cognition. Therefore, future research should include β-amyloid in the analysis to explore the additive effect of neurodegenerative disease on cognitive and functional decline in elderly with varying severities of CeVD.
The main strength of the present study was the novel approach, which quantified CeVD burden into a practical numerical score. A case-control design that covers a wide spectrum of cognitive capability was another strength. A further strength was the use of a comprehensive and validated neuropsychological assessment at yearly follow-up visits which enabled analysis of domain-specific cognitive function.
Conclusion
We found that the global CeVD burden scale predicts longitudinal cognitive and functional deterioration. Our findings suggest that CeVD severity affects the rate of longitudinal decline and conversion to AD. Further studies are required to establish effective early interventions in patients at higher risk of poor long-term clinical outcomes as a preventive approach.
Conflict of interest
None.
Description of authors’ roles
Xin Xu: study concept and design, acquisition of data, analysis and interpretation of data, draft manuscript. Yiong Huak Chan: analysis of data, critical revision of manuscript for intellectual content. Saima Hilal: acquisition of data, critical revision of manuscript for intellectual content. Qun Lin Chan: acquisition of data, critical revision of manuscript for intellectual content. Boon Yeow Tan: acquisition of data, critical revision of manuscript for intellectual content. Mohammad Bibek Gyanwali: acquisition of data, critical revision of manuscript for intellectual content. Kamran Ikram: critical revision of manuscript for intellectual content. Narayanaswamy Venketasubramanian: critical revision of manuscript for intellectual content. Christopher Li-Hsian Chen: study concept and design, supervised analysis and interpretation of data, critical revision of manuscript for intellectual content.
Acknowledgments
The present study is supported by NMRC Centre Grant – Memory Aging and Cognition Centre (MACC) – Theme 4 (NMRC/CG/NUHS/2010 – R-184-005-184-511), NMRC Centre Grant – NUHS – Metabolic Medicine, Infectious Diseases, Neuroscience Enablers (MINE) (NMRC/CG/013/2013), and MACC Research Fund (R-184-000-209-720).
Supplementary material
To view supplementary material for this article, please visit https://doi.org/10.1017/S1041610217002952