I. INTRODUCTION
Recently, efficiency over 26% has been achieved by heterojunction back contact (HBC) crystalline silicon (c-Si) solar cells.Reference Yoshikawa, Kawasaki, Yoshida, Irie, Konishi, Nakano, Uto, Adachi, Kanematsu, Uzu and Yamamoto1 For reducing the cost of such c-Si solar cells, thinning of c-Si substrates down to 100 µm or less is a crucial issue. For such thin c-Si, small textures should be used for optical confinement. In addition, during texture formation, the smaller the size of the textures is, the smaller the c-Si loss is; hence solar cell fabrication cost can be reduced. The small textures are also required for precise patterning of the back contact electrodes of the HBC solar cells.
Nowadays, there are several well-known texturing technologies. Silver nanoparticle-assisted texturing is a way to obtain small textures with low reflectivity. However, it is not often suitable for obtaining high passivation quality and low optical reflectivity after film coating. Dry etching is also used for forming the textures.Reference Jansen, de Boer, Legtenberg and Elwenspoek2 The reflectivity of the textures before forming antireflection coating (ARC) can be as low as a few percent.Reference Kumaravelu, Alkaisi, Bittar, Macdonald and Zhao3 However, the process cost is high and the final reflectivity after film coating is sometimes almost equivalent to the one obtained in the conventional textures. Among many technologies, the random texturing by using chemical solutions still shows the lowest cost in fabrication processes, appropriate optical reflectivity, easy cleaning of texturing surface, and suitability for excellent passivation.Reference Nguyen, Koyama, Terashima, Okamoto, Sugiyama, Ohdaira and Matsumura4,Reference Nguyen, Koyama, Higashimine, Terashima, Okamoto, Sugiyama, Ohdaira and Matsumura5 Thus, we have concentrated to develop better chemical processes for forming desirable textures.
During the study on the texture formation using the conventional alkaline solution, we noticed that the bubbles generated by the etching process might fix the size of textures because the bubbles could be obstacles for further penetration of the chemical solution into the texturing area. To avoid the growth of such bubbles, we introduced glass microparticles to destroy them physically. Then, we attempted a new texture-forming process, in which SiO2-based glass microparticles were mixed with a conventional KOH-based alkaline solution, SUN-X600, provided by Wako Pure Chemical Corp (Fujifilm, Osaka, Japan). We discovered that the size of the textures could be drastically reduced from 10 µm to a few µm or less. The loss of Si during formation of the textures and the process times itself were both reduced.
We named this unique texture-forming process “microparticle-assisted texturing (MPAT) process”. We applied the MPAT process on c-Si substrates with various thicknesses down to 50 µm with optical reflectivity as low as 7%. The etching time and c-Si loss for the formation of the textures are also reduced from 25 to 2 min and from 20 to 2 µm, respectively.
In this paper, we study the feasibility of the textures by the MPAT process in solar cell fabrication. We have successfully developed a low-cost chemical cleaning process suitable to this new texture. We found that the excellent passivation with the maximum of surface recombination velocity (SRVmax) less than 1.8 cm/s could be obtained on such textures by using a proper chemical cleaning prior to catalytic chemical vapor deposition (Cat-CVD) film coating. Note that without the proper chemical cleaning, SRVmax is larger than 140 cm/s.
II. FUNDAMENTALS FOR EXPERIMENTS
A. Preparation of textured c-Si
In this study, mirror polished n-type floating-zone (100) c-Si substrates with the resistivities of 1–5 Ω cm and effective minority carrier lifetimes (τeff) in bulk around 12 ms were used for all experiments. The c-Si substrates with various thicknesses ranging from 50 to 283 µm were cut into 2 × 2 cm2 for most of the experiments.
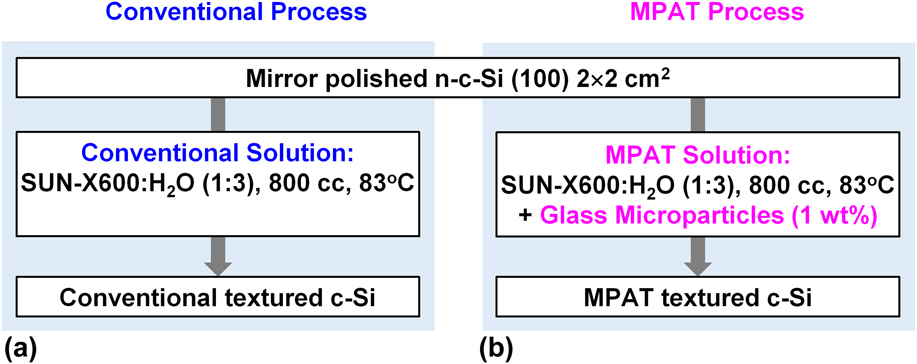
In the present study, we used the commercially available KOH-based texturing chemical solution, SUN-X600 (Wako Pure Chemicals Industry Corp., Osaka, Japan). The main component of the solution is KOH and water with a little additive. Figure 1 shows two procedures for the formation of randomly textured c-Si by using the (a) conventional SUN-X600 and (b) MPAT processes. In the conventional process [Fig. 1(a)], the c-Si substrates with a size of 2 × 2 cm2 were kept vertically in SUN-X600 solution by using a perfluoroalkoxy alkane (PFA) sample holder. Here, we used about 800 cc solution including SUN-X600 diluted by H2O with a ratio of 1:3, and heated up the solution to the temperature of 83 °C. We used a 1000 cc Pyrex glass beaker (HARIO Co., Ltd, Tokyo, Japan) on a hotplate. In the present paper, when the chemicals A and B are mixed together with a ratio of a:b, it is simply expressed by A:B (a:b). All temperatures were measured directly by immersing a Teflon-coated thermometer into used chemical solutions. A Teflon-coated magnetic stirrer with a spin speed of 250 rpm was used for stirring solutions during the texturing processes.
Procedures for formation of randomly textured c-Si using the (a) conventional and (b) MPAT processes.

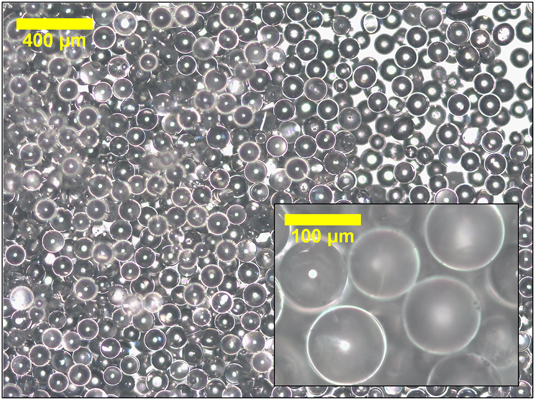
In the MPAT process [Fig. 1(b)], to control the size of the randomly textured c-Si, we added a small amount of the glass microparticles (about 1 wt%) into the same solution without changing the setting conditions. This new solution with the microparticles is described as “MPAT solution”. The microparticles with various diameters ranging from 11 to 303 µm were used for the MPAT solution. An optical microscope image of the microparticles with an average diameter of 98 µm is demonstrated in Fig. 2.
Optical image of SiO2-glass microparticles with an average diameter of 98 µm as an example.

B. Preparation of passivation layers
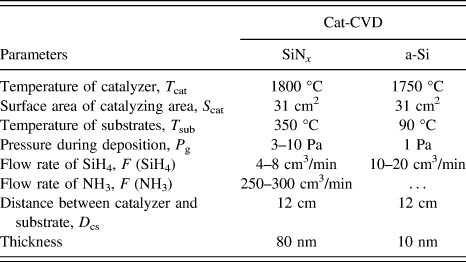
To improve the efficiency of c-Si solar cells, it is important to reduce electrical loss which is mainly caused by the recombination of photogenerated carriers at the surfaces of the c-Si substrates. Therefore, surface passivation with low surface recombination velocity (SRV) is required. Surface passivation was carried out by coating silicon-nitride (SiNx)/amorphous-silicon (a-Si) stacked layers since the excellent passivation quality was widely recognized in this system.Reference Nguyen, Koyama, Higashimine, Terashima, Okamoto, Sugiyama, Ohdaira and Matsumura5,Reference Koyama, Ohdaira and Matsumura6 In this study, an 80-nm-thick SiNx layer was successively deposited on a 10-nm-thick a-Si layer, and both of them were prepared by Cat-CVD on both sides of c-Si substrates. Detail conditions for Cat-CVD are shown in Table I.
Deposition parameters for Cat-CVD SiNx and a-Si.

C. Cleaning of textured c-Si
The importance of proper cleaning prior to the surface passivation of c-Si by coating Cat-CVD SiNx/a-Si stacked layers is already revealed by Nguyen et al.Reference Nguyen, Koyama, Higashimine, Terashima, Okamoto, Sugiyama, Ohdaira and Matsumura5 To improve the passivation quality, we investigated many cleaning procedures for the MPAT textures. Finally, we found a suitable cleaning procedure to obtain an excellent passivation quality on the MPAT textures. This cleaning procedure does not damage the textures and thus does not change any optical properties. In addition, the cost of cleaning is inexpensive. The effect of the cleaning is demonstrated later by electrical properties.
D. Measurements
1. Measurement of texture size
After forming the textures, we simply estimated the size of the textures using top-view images taken by using a scanning electron microscope (SEM), HITACHI S-4500 (HITACHI, Tokyo, Japan), having capability of capturing images with a resolution of 5 nm.
2. Measurement of c-Si thickness and loss
The loss of c-Si owing to the texturing process is determined by the difference between the initial thickness and processed thickness of c-Si substrates. Measurements of the c-Si thicknesses were carried out by using a digital outside micrometer MCD130-25 made by Niigata Seiki Co., Ltd. (Niigata, Japan).
3. Measurement of optical properties
The reflectivities of all the samples were measured by using a UV-Vis-NIR (ultraviolet-visible near-infrared) spectrometer UV-3150 made by Shimadzu Corp. having low-noise optics with a superb 0.1 nm resolution of wave length. We measured the reflectivities in a range from 300 to 1200 nm with an increment step of 2 nm.
4. Measurement of electrical properties
For the evaluation of surface passivation quality, we measured τeff by using a microwave photoconductivity decay (µ-PCD)-based KOBELCO LTA-1510EP analyzer (Kobelco Research Institute, Kobe, Japan) with a pulsed laser light of 904 nm wave length and a photon density of 5 × 1013 cm−2. Since the light with 904 nm wave length deeply penetrates into the c-Si substrates, the excess carrier density generated by the light irradiation is simply approximated to be 1.7–3.0 × 1015 cm−3 by dividing the photon density by the c-Si thickness. Note that in real c-Si solar cells, the density of the photocarriers reaches a maximum value of 1–2 × 1016 cm−3 at an open-circuit condition but reduces to an order of 1015 cm−3 at a maximum power condition which decides the performance of the solar cells. Therefore, τeff at the maximum power condition is used for evaluation of the passivation quality.
III. EXPERIMENTS AND RESULTS
A. Discovery of texture size control by mixing glass microparticles
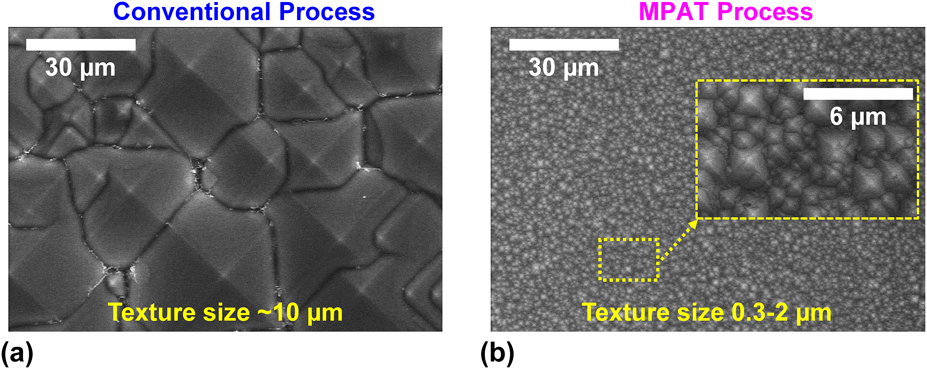
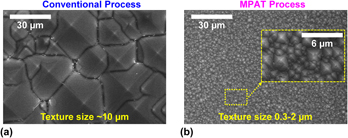
Figure 3 shows SEM top-view images of textured c-Si formed by the conventional process [in Fig. 1(a)] and the MPAT process [in Fig. 1(b)]. In the conventional process, the size of the texture was estimated about 10 µm or more. In the MPAT process, the size of the texture was reduced enormously to 0.2–2 µm. A possible explanation for the mechanism of the texture size control in the MPAT process is discussed later.
SEM top-view images of textured c-Si formed by the (a) conventional and (b) MPAT processes.

B. Optical properties of textured c-Si
1. Dependence of reflectivity on etching times
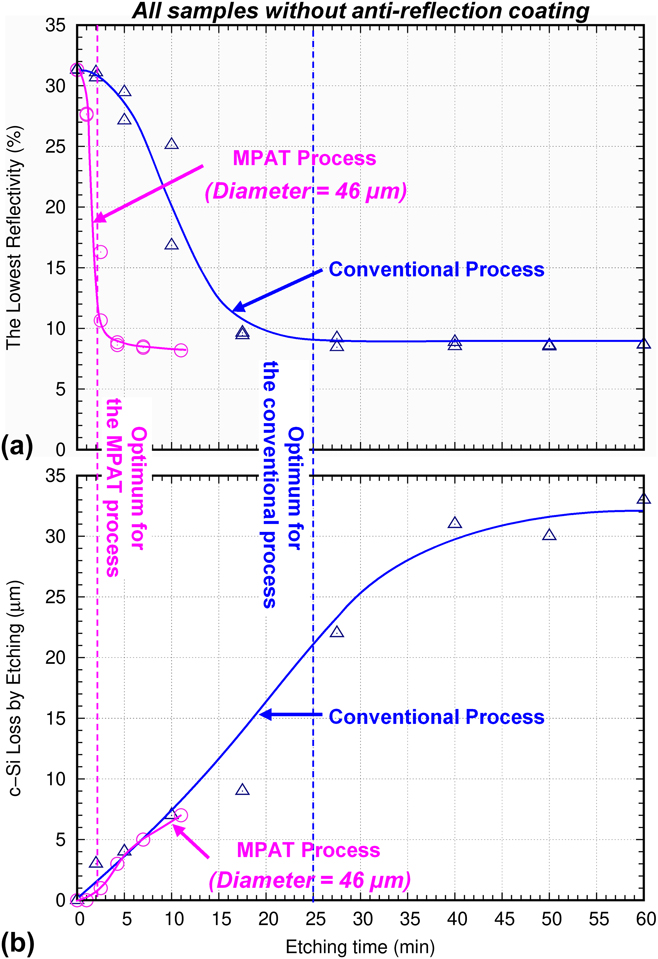
Figure 4 shows (a) the minimal reflectivities and (b) c-Si loss plotted as a function of etching times when using the conventional (blue triangle) or MPAT (pink circle) solution at a setting temperature of 83 °C. The MPAT solution has about 10 wt% (percentage by weight) of the microparticles with a diameter of 46 µm. Minimal reflectivity means the smallest reflectivity taken from the spectra of reflectivity versus wave length. Optimal etching time for texturing is determined by the time used for reaching the smallest reflectivity of the samples; in other words, it is the necessary time to finish texturing of c-Si. The MPAT enormously reduces the optimal etching time from 25 to 2 min and the minimal c-Si loss from 20 to 2 µm, as shown in Figs. 4(a) and 4(b), respectively. Clearly, the time consumption and the material waste are both considerably reduced, leading to significant reduction of texturing cost.
(a) The lowest reflectivity and (b) c-Si loss are plotted as a function of etching time when using the conventional (blue triangle) or MPAT (pink circle) solution at the setting temperature of 83 °C.

2. Dependence of reflectivity on c-Si thickness
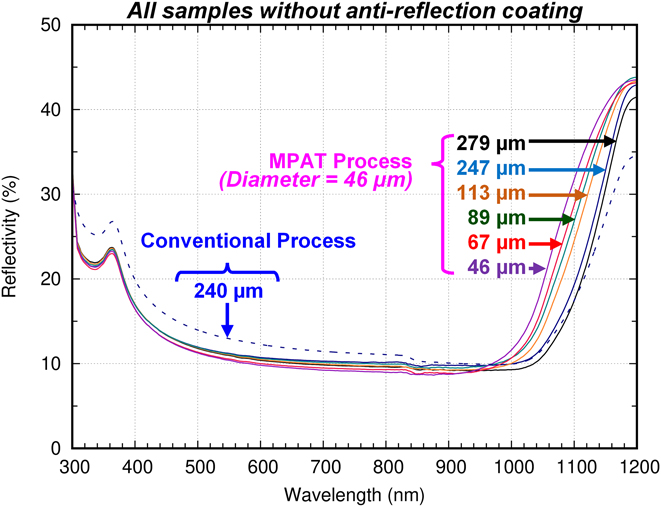
To know whether the new MPAT process can be used for thin c-Si with thicknesses less than 100 µm, we applied the MPAT process to the formation of the texture on flat c-Si with various thicknesses ranging from 50 to 283 µm. Reflectivities of textured c-Si by the conventional (dashed line) and the MPAT processes (solid line) are demonstrated in Fig. 5. In this case, process times for the conventional and MPAT process are 50 and 4 min, respectively. For the texture by the MPAT process, at the wavelengths less than about 950 nm, the reflectivities of the samples are similar because mainly the short wavelengths are scattered and absorbed at the front surface of c-Si. At the wavelengths longer than about 950 nm, the reflectivities increase with the decrease of c-Si thicknesses, which is a natural tendency. As we know, the long wave length light deeply penetrates into and partially reflects on the back surface, then a portion of the light escapes from the front surface of the c-Si. Inevitably, the decrease in the thicknesses results in the decrease in the optical paths of the light in bulk c-Si or increase of the reflectivities. We also compared the reflectivities of the textured c-Si with the similar thicknesses by the conventional (240 µm, dark blue dash line) and MPAT (247 µm, dark blue solid line) processes. Obviously, in almost the measurement range, the texture made by the MPAT process is showing the reflectivity considerably lower than that of the texture made by the conventional process. From this result, it is found that the MPAT textures still can keep the low reflectivity even for 46-µm-thick c-Si and that they show the reflectivity considerably lower than that of the conventional textures. Therefore, we can say that the MPAT textures are promising for future thin c-Si solar cells.
Reflectivity of textured c-Si with various thicknesses ranging from 279 down to 46 µm. Etching time for all the samples is 4 min, and ARC layers are not deposited. The microparticles with a diameter of 46 µm are used for the MPAT process.

3. Dependence of reflectivity on microparticle mixing ratio
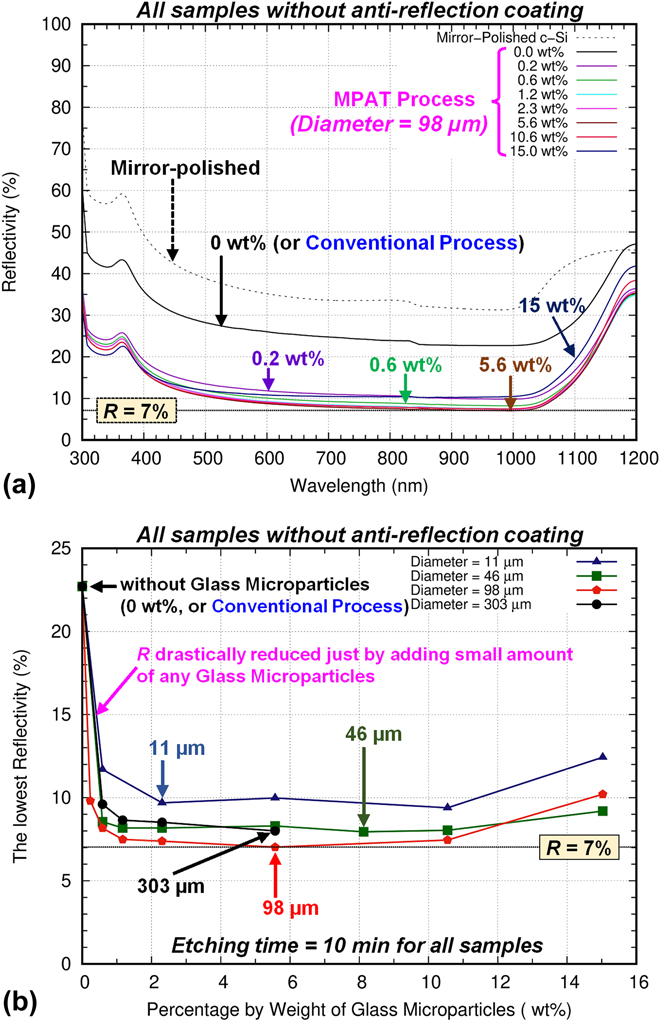
Both the effect of the size and the mixing ratio of microparticles in the MPAT process were investigated. Figure 6(a) shows the dependence of the reflectivity on the wt% of the microparticles. wt% of the microparticles with several diameters of 11, 46, 98, and 303 µm were varied from 0 to 15 wt%. For simplicity, we show only the data of microparticles with 98 µm diameter. Etching time for all samples was 10 min. The textures showing near-record low reflectivity (about 7% at the minimum) can be made by the low-cost MPAT process, without using expensive dry etching.
(a) Reflectivity of textured c-Si made by the MPAT process with various wt% of the microparticles having a diameter of 98 µm and (b) the lowest reflectivity of the textured c-Si made by the MPAT process using various microparticles with the diameters of 11 (blue triangle), 46 (green square), 98 (red pentagon), and 303 µm (black circle) and wt% from 0 to 15. Etching time is 10 min for all the samples.

We summarized the results for the dependence on the wt% and the size of microparticles in Fig. 6(b), in which the lowest reflectivity is plotted as a function of wt% of the microparticles. For 0 wt%, in the conventional process, the reflectivity of c-Si after 10 min texturing is more than 22%. Using the same etching time, the reflectivity R is drastically reduced to less than 10% just by adding a small amount (about 1 wt%) of any microparticles. In the present experiments, with 98 µm diameter microparticles, one exhibits the best texture with reflectivity down to 7%. Microparticles that are too small and too large degrade the reflectivity. These results are discussed later.
C. ARC
In solar cell fabrication, ARC is one of the keys to the improvement of the efficiency. Quality of the ARC is dependent on the surface morphology of the textured c-Si and a coating technology. Poor ARC was usually found in very small textured fine structures. The size of the MPAT textures is at the order less than 2 µm; hence the investigation of the ARC on these structures is needed.
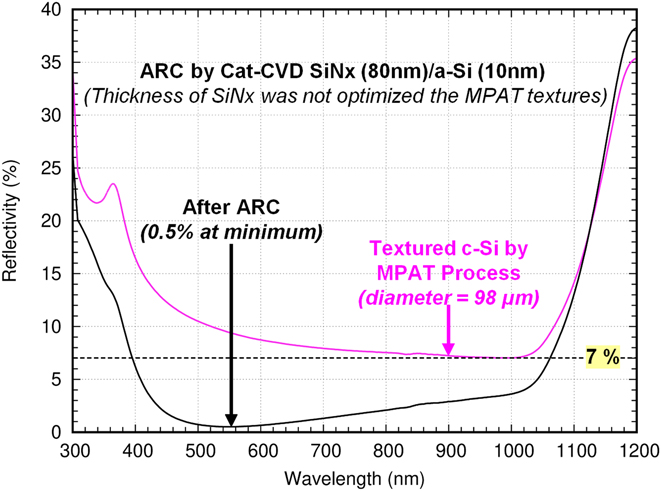
Figure 7 shows the reflectivity of the bare MPAT texture (red solid line) and after formation of the ARC (black solid line) by Cat-CVD SiNx/a-Si stacked layers. Note that the thickness of the SiNx was not optimized for the MPAT texture. The reflectivity could reach 0.5% after the ARC. Therefore, we conclude that the effective ARC with low reflectivity can be made on the textured c-Si by the MPAT process.
Reflectivity of the bare MPAT texture (red solid line) and after ARC (black solid line).

D. Electrical properties of textured c-Si
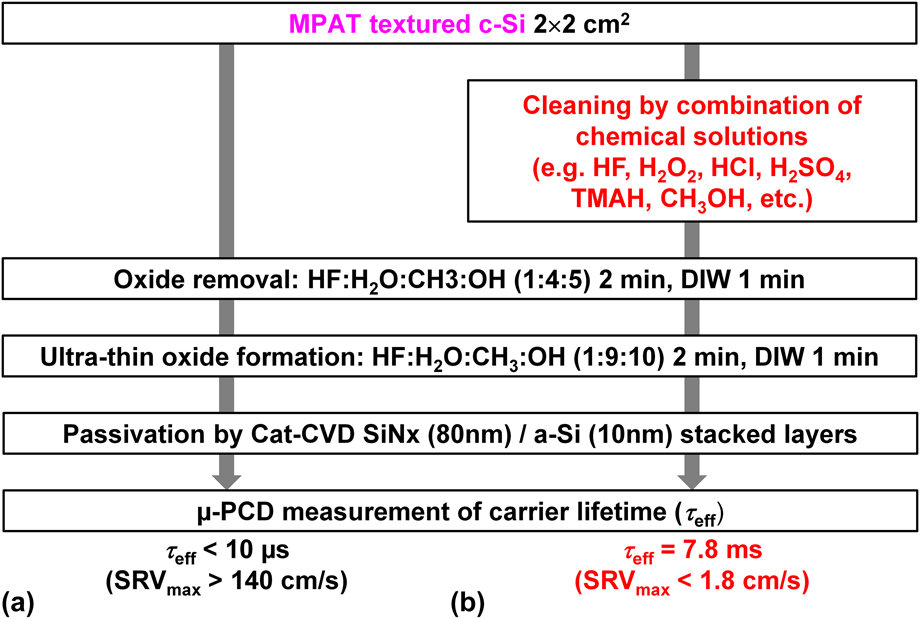
Figure 8 shows two procedures for cleaning and passivation of the MPAT textured c-Si with corresponding electrical properties. First, as shown in Fig. 8(a), we carried out a simple cleaning procedure, in which the oxide layer formed during the MPAT process is removed by HF:H2O:CH3OH (1:4:5), and then an ultra-thin oxide layer is formed by H2O2:H2O:CH3OH (1:9:10). In both solutions, methyl alcohol (methanol) (CH3OH) is used for controlling surface tension of the solutions for penetrating into textured fine structures.Reference Koyama, Ohdaira and Matsumura6 Hydrofluoric acid (HF) and hydrogen peroxide (H2O2) have a concentration of 50% and 30%, respectively. Immediately after cleaning, the samples are passivated by coating the Cat-CVD SiNx/a-Si stacked layers. As mentioned in the previous sections, the Cat-CVD SiNx/a-Si stacked layers were used for not only ARC but also for surface passivation of the MPAT textures. In this case, the passivation quality of the MPAT textured c-Si with a thickness of 279 µm is very poor, showing τeff < 10 μs, which corresponds to SRVmax > 140 cm/s. The SRVmax was evaluated by using the formula τeff = W/2S, where S and W refer to SRV and c-Si thickness, respectively. Under an assumption of zero recombination in bulk c-Si or an infinite bulk lifetime, the formula was derived from the following well-known original equation:
 $${1 \over {{\tau _{{\rm{eff}}}}}} = {1 \over {{\tau _{{\rm{bulk}}}}}} + 2S{1 \over W}\quad ,$$
where τbulk refers to effective minority carrier lifetimes in c-Si bulk.
Two procedures (a) without and (b) with cleaning before Cat-CVD passivation film coating of the MPAT textured c-Si with corresponding electrical properties.

A developed cleaning was applied to the same MPAT textures prior to deposition of the stacked layers, as shown in Fig. 8(b). Combination of several chemicals, such as HF, H2O2, HCl, H2SO4 (sulfuric acid), TMAH (tetramethylammonium hydroxide), CH3OH, etc., are used for cleaning of the textures. Details of this cleaning procedure will be published elsewhere. In this case, an excellent passivation quality could be obtained with τeff = 7.8 ms, equivalent to SRVmax = 1.8 cm/s. Therefore, the MPAT textured c-Si is promising for the fabrication of high-efficiency solar cells.
IV. DISCUSSION
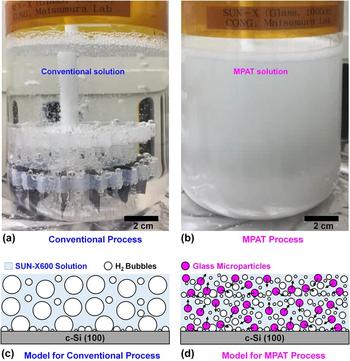
Probably, the biggest question in this work is “why is the size of the texture controlled by the glass microparticles?” First, we talk about the reason why we used the glass microparticles. During etching of c-Si to form the random textures, we found many gas bubbles on the surface of the c-Si, as shown in Fig. 9(a). We believed that these bubbles may work as obstacles or masks in the etching process, which prevents the solution from attacking the surface. Therefore, it took a longer time to finish the texturing process. In addition, the bubbles have the sizes ranging from unobservable to a few millimeters. We attempted to destroy these large bubbles as soon as possible by adding the glass microparticles into the conventional solutions. As a result, shown in Fig. 9(b), the solution became milky owing to the distributed microparticles, and the big bubbles disappeared. This may be the key to the texture control of c-Si.
Optical images showing the (a) conventional SUN-X600 and (b) MPAT (SUN-X600 + glass microparticles) solutions with the c-Si substrates. Schematic demonstrations are proposed for possible mechanisms of the (c) conventional and (d) MPAT processes.

We propose possible models of the mechanism for the conventional and MPAT processes as shown in Figs. 9(c) and 9(d). In these models, hydrogen (H2) bubbles were generated by the reaction between Si and the solution. SUN-X600 solution contains KOH with 7 wt%, thus a possible reactionReference Seidel, Csepregi, Heuberger and Baumgärtel7 is
 $${\rm{Si}} + 2{\rm{KOH}} + {{\rm{H}}_2}{\rm{O}}\buildrel {{\rm{Heat}}} \over \longrightarrow {{\rm{K}}_2}{\rm{Si}}{{\rm{O}}_3} + 2{{\rm{H}}_2}\left( {{\rm{gas}}} \right)\quad .$$
The reaction-generated H2 will be accumulated and become the H2 bubbles on the c-Si surface. The H2 bubbles grow due to the reaction-generated H2 gas and collect the neighboring H2 bubbles. For the conventional process, as shown in Fig. 9(c), largely growing H2 bubbles may work as obstacles or masks and the texture size cannot be reduced. Consequently, the masked area will not be etched unless the H2 bubbles are removed. As a result, long texturing time is needed, and automatically results in large c-Si loss. For the MPAT process, as shown in Fig. 9(b), the H2 bubbles are physically destroyed by collision with the microparticles, or chemically pulled out by the glass surface.
Owing to convection flow during heating up and stirring the solutions, the microparticles receive enough momentum to break or sweep out the H2 bubbles from the c-Si surface. As a result, the very small microparticles (with the diameter of 11 µm, as shown in Fig. 6) do not have enough momentum to break the H2 bubbles even though the number of collisions is appropriate. If the particles are too large (with the diameter of 300 µm, as shown in Fig. 6), it is too difficult for the particles to move around in the solution, thus the probability of the collision is reduced or the MPAT becomes less effective. Similarly, if wt% of the microparticles is too large, they cannot receive enough momentum because of too many collisions among the particles. Probably this may be the reason why the proper wt%, or proper mixing ratio, exists in the MPAT process.
V. SUMMARY
We successfully developed a novel low-cost MPAT process for preparation of random textures on the solar cell c-Si, in which:
(1) Submicron textures with a size of 0.3–2 µm can be made by using the conventional low-cost KOH-based alkaline texturing solution when SiO2-based glass microparticles are mixed with the solution.
(2) The size of the textures can be controlled by changing the size and mixing ratio of the glass microparticles.
(3) The textures by the MPAT process are showing near-record low reflectivity with minimum at 7%.
(4) We confirmed that the MPAT process is applicable even for 50-µm-thick c-Si substrates.
(5) Extremely high passivation quality (SRVmax = 1.8 cm/s) and possibly effective ARC (R = 0.5% at minimum) could be obtained on such textures.
The MPAT process is promising in future thin c-Si solar cells.
ACKNOWLEDGMENT
This work is financially supported by NEDO (New Energy and Industrial Technology Development Organization), Japan.