

Gray's reinforcement sensitivity theory (RST) of personality postulated that the reactivity in at least two major brain systems underlies motivated behaviour and affect: the Behavioural Inhibition System (BIS), responding to signals of punishment and non-reward, and the Behavioural Approach System (BAS), responding to signals of reward and non-punishment (J.A. Gray, Reference Gray1987). When BIS is activated, inhibition of movement toward goals or avoidance of negative or painful outcomes will be triggered. Activation of BAS causes behavioural activation and a tendency to approach goals. The septohippocampal system and the dopaminergic system were identified as the underlying neurobiological circuits of BIS and BAS respectively (Carver & White, Reference Carver and White1994; Davey, Yucel, & Allen, Reference Davey, Yucel and Allen2008). Stable individual differences in the reactivity of the BIS and BAS are referred to as punishment and reward sensitivity respectively.
For the purpose of assessing individual differences in reactivity of BIS and BAS, three kinds of measurement methods are used: neuroimaging, behavioural tasks, and questionnaires. Questionnaires are the most practical for use in clinical and large-scale epidemiological settings. A widely used questionnaire is the BIS/BAS scale of Carver and White (Reference Carver and White1994), containing only 20 items. The BIS scale contains seven items; the BAS scale (BAS) contains thirteen items and is the aggregate of three BAS subscales, namely BAS Drive (BASD), BAS Reward Responsiveness (BASRR), and BAS Fun Seeking (BASFS). The BIS/BAS scale has been used in research as a two-factor (BIS, BAS) and four-factor (BIS, BASD, BASRR, BASFS) scale.
The original BIS/BAS scale was developed as a self-report measure for adults (Carver & White, Reference Carver and White1994). However, examining individual differences in the reactivity in BIS and BAS is also important in childhood developmental and public health research, since they can explain the variation in the occurrence of multiple mental and physical health outcomes (Bijttebier, Beck, Claes, & Vandereycken, Reference Bijttebier, Beck, Claes and Vandereycken2009; De Decker et al., Reference De Decker, Sioen, Verbeken, Braet, Michels and De Henauw2016; Kingsbury, Coplan, Weeks, & Rose-Krasnor, Reference Kingsbury, Coplan, Weeks and Rose-Krasnor2013; Verbeken, Braet, Lammertyn, Goossens, & Moens, Reference Verbeken, Braet, Lammertyn, Goossens and Moens2012). To measure BIS and BAS reactivity in children, parent report (PR; Blair, Reference Blair2003; Vervoort et al., Reference Vervoort, Vandeweghe, Vandewalle, Van Durme, Vandevivere, Wante and Braet2015) and child report (CR; Muris, Meesters, de Kanter, & Timmerman, Reference Muris, Meesters, de Kanter and Timmerman2005) versions of the BIS/BAS scale have been developed. The aim of the present study was to evaluate two methodological concerns when using the PR and/or CR BIS/BAS scale to study individual differences between children in developmental and public health research: (1) whether parents and children agree in their reporting on the BIS/BAS scale, and (2) whether BIS/BAS scores are stable during child development. The rationale and specific research questions to these two main study aims are explained in more detail below.
Main Study Aim 1 — Parent-Child Agreement on BIS/BAS Scores
Because various informants may be complementary in providing crucial data concerning a child's psychosocial functioning, the use of multiple informants in clinical psychosocial assessment is broadly accepted and recommended in literature (Offord et al., Reference Offord, Boyle, Racine, Szatmari, Fleming, Sanford and Lipman1996). Nevertheless, it is a consistent finding that multiple informants provide discrepant information about a child (Achenbach, McConaughy, & Howell, Reference Achenbach, McConaughy and Howell1987; De Los Reyes et al., Reference De Los Reyes, Augenstein, Wang, Thomas, Drabick, Burgers and Rabinowitz2015), with Pearson correlation coefficients around 0.25 (weak relationship) between parent and child ratings. Discrepant information can bias research and clinical practice. Hence, it is important to know whether or not parents and children agree on the BIS/BAS scale. Since no research has addressed this issue yet, the first main study aim is to investigate whether parents and children agree or provide discrepant information. Additionally, this study also includes an examination on how possible discrepancies can be explained by examining factor structural differences as well as influencing factors like child or parent characteristics.
Although testing the agreement is the first main aim, tests of factor structural differences between the CR and PR have to be conducted before testing agreement between CR and PR: when both versions do not have the same factor structure, that is, are not measurement invariant, they may not have a similar meaning to parents and children, and therefore parents’ and children's ratings cannot be compared (Cole, Hoffman, Tram, & Maxwell, Reference Cole, Hoffman, Tram and Maxwell2000). Thus, it is a prerequisite that the factor structure is similar before testing agreement of the ratings on the CR and PR.
Next, in case the factor structures are similar but ratings do not agree, it is relevant to look at influencing factors of the parent-child discrepancy. Research that used questionnaires on children's psychosocial functioning in general elucidated that child-age is associated with parent-child discrepancies. Results for child-gender were inconsistent, and in their review, De Los Reyes and Kazdin (Reference De Los Reyes and Kazdin2005) concluded that child-gender is probably not associated with parent-child discrepancies. Further, it is known that mothers and fathers provide discrepant information about their child's psychosocial functioning (Achenbach, Reference Achenbach2006; Duhig, Renk, Epstein, & Phares, Reference Duhig, Renk, Epstein and Phares2000). Therefore, mother-child discrepancies might differ from father-child discrepancies, and hence, parent-gender might also be an influencing factor of parent-child discrepancies.
In summary, this study examined the following research questions within main study aim 1: (1.1) Are the factor structures of the PR (Vervoort et al., Reference Vervoort, Vandeweghe, Vandewalle, Van Durme, Vandevivere, Wante and Braet2015) and CR (Muris et al., Reference Muris, Meesters, de Kanter and Timmerman2005) versions of the BIS/BAS scale measurement invariant? (1.2) Do the PR and the CR agree? and (1.3) In case parent-child discrepancies are present, are they influenced by primary parent and child characteristics, that is, child-age, child-gender, and parent-gender? Thereby, it was hypothesised that (1.1) the factor structures in both PR and CR were equivalent, (1.2) parent-child ratings exhibit weak agreement on all scales, (1.3) and child-age and parent-gender but not child-gender are significant predictors of parent-child discrepancies; since mothers are still the primary caregivers, it was hypothesised that the mean difference between PR and CR was closer to zero in mothers compared to fathers.
Main Study Aim 2 — Two-Year Stability of PR BIS/BAS Scores
Longitudinal personality research has argued that the reflection of the neurobiological systems BIS and BAS on behaviour and affect in individuals should be relatively stable over time. Therefore, two aspects of stability over time can be considered: absolute stability, that is, the extent to which absolute scores on a scale remain similar over time; and rank order stability, that is, the extent to which the rank ordering of individuals on a scale are related over time. In support of this statement, Caspi and Silva (Reference Caspi and Silva1995) found that the rank ordering of individuals on behavioural style continua remains similar between early childhood (age 3) and young adulthood (age 18). Gest (Reference Gest1997) also reported moderate absolute stability of a construct similar to BIS reactivity between childhood (age 8 to 12) and early adulthood (age 17 to 24). Regarding constructs with similarity to BAS reactivity, one study based on parental reports found that the dimension of approach exhibited substantial absolute and rank order stability from infancy to 8 years (Pedlow, Sanson, Prior, & Oberklaid, Reference Pedlow, Sanson, Prior and Oberklaid1993).
In contrast with the above-mentioned personality research, recent research suggested less absolute stability in BIS and BAS reactivity during development, specifically during adolescence. Using a cross-sectional design, some researchers reported a linear increase from age 10 to 30 in BIS reactivity (Cauffman et al., Reference Cauffman, Shulman, Steinberg, Claus, Banich, Graham and Woolard2010), while others reported a peak in middle and late adolescence compared to early adolescence and young adulthood (J.D. Gray, Hanna, Gillen, & Rushe, Reference Gray, Hanna, Gillen and Rushe2016). Further, BAS reactivity was reported to display a U-shaped inverted relation with age, peaking in adolescence (Cauffman et al., Reference Cauffman, Shulman, Steinberg, Claus, Banich, Graham and Woolard2010; Figner, Mackinlay, Wilkening, & Weber, Reference Figner, Mackinlay, Wilkening and Weber2009; J.D. Gray et al., Reference Gray, Hanna, Gillen and Rushe2016; Urosevic, Collins, Muetzel, Lim, & Luciana, Reference Urosevic, Collins, Muetzel, Lim and Luciana2012). However, longitudinal designs are a necessity to investigate stability over time. When using a longitudinal design and the BIS/BAS scale, results on absolute stability are inconsistent: Urosevic et al. (Reference Urosevic, Collins, Muetzel, Lim and Luciana2012) found an increase of the BASRR scores of individuals aged 9–23 years at baseline and 11–25 years at follow-up over 2 years, while Braams, van Duijvenvoorde, Peper, and Crone (Reference Braams, van Duijvenvoorde, Peper and Crone2015) did not find any change on the scores on the subscales from 8 to 27 years. This inconsistency is possibly due to a lack of measurement invariance of the BIS/BAS scale over time that has not been investigated yet. Comparable to what is mentioned for the PR and CR version in the previous section, it is a prerequisite to test measurement invariance, that is, that the factor structure of the BIS/BAS scale does not differ between two time points, before investigating absolute and rank order stability on the BIS/BAS scale.
Also, besides measurement invariance, absolute and rank order stability on the PR BIS/BAS scale have, to our knowledge, not yet been investigated in children. Using other questionnaires to measure BIS and BAS reactivity, literature reporting on stability over time of the reactivity in the BIS and BAS during childhood is sparse. To elucidate whether reactivity in BIS and BAS actually predicts health outcomes in children, longitudinal research is recommended, and therefore information on absolute and rank order stability over time of scores on the BIS/BAS scale during childhood is needed.
To address these issues, this study examined the following research questions within main study aim 2: whether the PR BIS/BAS scale (2.1) is measurement invariant over time, (2.2) displays absolute stability over time, and (2.3) displays rank order stability over time? Therefore, factor structural (2.1), absolute (2.2), and rank order stability (2.3) were hypothesised.
Methods
Study Design
Participants were Flemish Dutch-speaking children and their parents initially recruited for the European Identification and prevention of Dietary- and lifestyle-induced health EFfects In Children and infantS study (IDEFICS) carried out between 2007 and 2010 (Ahrens et al., Reference Ahrens, Bammann, Siani, Buchecker, De Henauw, Iacoviello and Consortium2011). Part of the children of the Belgian IDEFICS cohort of the Aalter region also participated in the follow-up study called ChiBS, which took place between 2010–2012 (Michels et al., Reference Michels, Vanaelst, Vyncke, Sioen, Huybrechts, De Vriendt and De Henauw2012). In spring 2013, these children (7.5–14 years old) were invited to participate in a new follow-up study called Forces. The Forces study, which is part of the REWARD-project (Rewarding Healthy Food Choices; www.rewardstudy.be), aims to investigate the role of sensitivity to reward in the development of eating habits and in changes in body composition in children and adolescents. As well as children of the ongoing IDEFICS-ChiBS cohort, new children of the same age range were also able to join the Forces study in 2013.
The projects were conducted according to the guidelines laid down in the Declaration of Helsinki and were approved by the Ethics Committee of the Ghent University Hospital. All parents and children older than 12 years signed an informed consent. Younger children gave verbal assent.
Participant Characteristics of Subsamples Used in the Analyses
In the surveys of 2011 and 2013, the BIS/BAS PR version was completed. In the survey of 2013, the BIS/BAS CR version was also completed. Hence, data from these surveys were used to investigate the research questions.
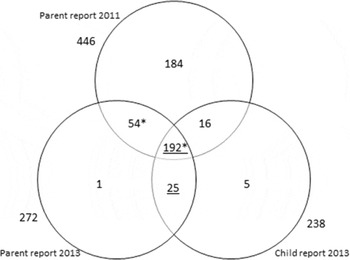
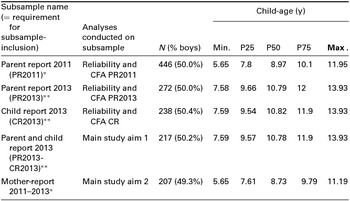
The Venn diagram shown in Figure 1 displays (1) the number of parents that completed the PR in 2011 (n = 446; subsample PR2011), (2) the number of parents that completed the PR in 2013 (n = 272, 14.3% fathers; subsample PR2013), (3) the number of children that completed the CR in 2013 (n = 238; subsample CR2013), (4) the number of new participants in 2013 (n = 5 + 25 + 1 = 31), (5) the number of participants (n = 446 – 184 = 262) and non-participants (n = 184) at follow-up, (6) the number of parent-child dyads that completed both the PR (13.8% fathers) and CR in 2013 (underlined numbers; n = 192 + 25 = 217; subsample PR2013-CR2013), and (6) the number of parents that completed the PR in 2011 as well as in 2013 (numbers with *; n = 192 + 54 = 246). Of the latter 246 parents, 207 were biological mothers in the survey in 2013. The identity of the parent who completed the PR2011 was not registered, but fieldworkers reported that it was mostly done by mothers accompanying their children to the study centre. Therefore, we assumed that if the biological mother had filled out the PR2013, she also had filled out the PR2011. These 207 PR2011–PR2013 data formed the subsample Mother-Report 2011–2013. Children's characteristics of the five subsamples mentioned above are displayed in Table 1.
Venn diagram displaying numbers of participating children for which the PR BIS/BAS scale was completed in the survey of 2011 and/or 2013, and for which the CR BIS/BAS scale was completed in the survey of 2013.

Participant Characteristics of Five Study Subsamples Used in Five Groups of Analyses

Note: N = number, Y = year, Min = minimum. P25 = percentile 25, P50 = median, P75 = percentile 75, Max. = maximum, CFA = confirmatory factor analysis, PR = parent report, CR = child report.
*Child-age in 2011 is reported. **Child-age in 2013 is reported.
Drop-out analyses compared the 262 participants and 184 non-participants at follow-up. Using unpaired t tests, (1) the mean PR2011 BIS/BAS scores did not significantly differ between both groups (BIS: t = 0.974, p = .331, r effect size = 0.05; BAS: t = 0.556, p = .578, r effect size = .03; BASD: t = 0.950, p = .343, r effect size = .07; BASRR: t = 0.772, p = .441, r effect size = .06; BASFS: t = −0.531, p = .595, r effect size = .05), and (2) the mean child-age of participants at follow-up was significantly lower (mean age = 8.66, SE = 0.09) than the child-age of non-participants at follow-up (mean age = 9.12, SE = 0.11; t = 3.276, p = .001, r effect size = .15). Although child-age differences were significant, the age was equally distributed across the age range of 5.5 to 11.5 years in the participants at follow-up (median age = 8.82). Therefore, it was concluded that the higher drop-out of older children had no implications for the analyses of 2-year stability and parent-child agreement. Finally, a Pearson's chi-squared test revealed no gender differences between both groups; χ2 = 0.148, p = .773, r effect size = .027.
Measures: PR and CR BIS/BAS Scale
Children's BIS/BAS reactivity was measured by the BIS/BAS scale of Carver and White (Reference Carver and White1994), using a PR and CR. In both PR and CR, 20 items need to be scored on a 4-point Likert scale (1 = not true; 2 = somewhat true; 3 = true; 4 = very true). The BIS scale contains seven items and includes statements of sensitivity to punishments (e.g., ‘I am very fearful compared to my friends’). The BAS scale is an aggregate scale of three subscales: BASD, BASRR and BASFS. BASD contains four items tapping strong pursuit of appetitive goals (e.g., ‘I go out of my way to get things I want’). BASRR is measured by five items of positive affect/excitability (e.g., ‘When good things happen to me, it affects me strongly’). BASFS inquires four items that represents the inclination to seek out new rewarding situations (e.g., ‘I'm always willing to try something new if I think it will be fun’).
The CR was completed by the children in 2013 under supervision of the field workers. This CR-version was developed and externally validated for Dutch children by Muris et al. (Reference Muris, Meesters, de Kanter and Timmerman2005). It has a satisfactory internal reliability, with Cronbach's αs ranging between 0.70 and 0.80 for BIS, and 0.79–0.85 for BAS (Muris et al., Reference Muris, Meesters, de Kanter and Timmerman2005; Vervoort et al., Reference Vervoort, Wolters, Hogendoorn, de Haan, Boer and Prins2010); Cronbach's αs of 0.67 for BASD, 0.71 for BASRR, and 0.69 for BASFS were reported for an English version of the Dutch CR (Kingsbury et al., Reference Kingsbury, Coplan, Weeks and Rose-Krasnor2013). A principal component factor analysis demonstrated the existence of four factors, but because the BASFS items did not load together on one of the four factors, the authors concluded that a two-factor structure was more appropriate (Muris et al., Reference Muris, Meesters, de Kanter and Timmerman2005). However, a confirmatory factor analysis (CFA) conducted by Kingsbury et al. (Reference Kingsbury, Coplan, Weeks and Rose-Krasnor2013) was more in support for the four-factor structure.
The PR was completed by parents during the survey in 2011 and 2013. This Dutch PR-version was developed by Braet and Verbeken and was externally validated by Vervoort et al. (Vervoort et al., Reference Vervoort, Vandeweghe, Vandewalle, Van Durme, Vandevivere, Wante and Braet2015). A satisfactory external validity and Cronbach's αs of 0.76 for BIS, 0.86 for BAS, 0.85 for BASD, 0.74 for BASRR, and 0.57 for BASFS were reported. A principal component analysis supported the original four-factor structure (Vervoort et al., Reference Vervoort, De Caluwé, Vandeweghe, De Decker, Wante, Van Beveren and Braet2017).
Data Analyses
Analyses were performed using PASW Statistical Program version 20.0 (SPSS, IBM, IL, USA), unless otherwise specified. All analyses in SPSS were conducted on sum scores of the subscales.
Outliers and missing data
When a Likert category on an item was chosen in ≤1% of cases in the three largest subsamples (PR2011, PR2013, and CR2013), the choice for that answer was seen as outlier. This was the case for category one (not true) for two PR and CR BASRR items; the scores of 1 were recoded to a missing value. The 18 other items exhibited no outliers. Further, when the value on one item of a (sub-)scale was missing, the participant's data were excluded from the analyses concerning that specific (sub-)scale. In total, two CR2013s missed an item on the BIS scale; six CR2013s missed an item on the BASD-subscale; six CR2013s, four PR2011s and two PR2013s missed an item on the BASRR-subscale; and one CR2013 missed an item on the BASFS-subscale. The distribution of missing values across the subsamples PR2013-CR2013 and mother-report 2011–2013 can be inferred from the participant numbers in Table 3.
Reliability and CFA of the PR and CR
These psychometric properties were tested before proceeding to the main research aims to support comparison with previous research and to define which factor model should be used. To check reliability, Cronbach αs were computed for all subscales on data of the subsamples PR2011, PR2013, and CR2013. Further, CFAs were conducted to test the two-factor (BIS, BAS) as well as the four-factor structure (BIS, BASD, BASRR, BASFS) of the CR, and to confirm the four-factor structure of the PR using Mplus version 7.2. As data were categorical, the robust estimator Weighted Least Squares Means and Variances adjusted (WLSMV) was used. As recommended, model fit was assessed by a combination of three goodness-of-fit indices of three different categories, namely chi-square, comparative fit index (CFI), and root mean squared error of approximation (RMSEA). However, the chi-square statistic is sensitive to the sample size and may reject a model even when the model is acceptable. Therefore, a model was also seen as adequate when the CFI was above 0.90 and the RMSEA below 0.08, and a model was seen as good when the CFI was above 0.95 and the RMSEA below 0.06 (Bentler, Reference Bentler1990; Bentler & Bonett, Reference Bentler and Bonett1980; Browne & Cudeck, Reference Browne and Cudeck1992; Chen, Curran, Bollen, Kirby, & Paxton, Reference Chen, Curran, Bollen, Kirby and Paxton2008).
Main study aim 1 — Parent-child agreement on BIS/BAS scores
The research questions of main study aim 1, namely 1.1, 1.2, and 1.3 (see introduction), were investigated on subsample PR2013-CR2013.
For research question 1.1, full measurement invariance analysis between PR and CR were conducted in Mplus version 7.2. Therefore, each (sub-)scale was considered separately with a single-group approach (Brown, Reference Brown2006), a method taking into account the paired data structure. As data were categorical, estimator WLSMV and the default delta parameterisation were used. The fit indices of a configural model and of a model constraining both thresholds and factor loadings in tandem were examined (Muthén & Muthén, Reference Muthén and Muthén1998–Reference Muthén and Muthén2012). In both models, correlated errors were specified between similar items of the PR and CR (e.g., item 1 of the PR with item 1 of the CR; Brown, Reference Brown2006). The more constrained model is nested in the configural model, and thus both models can be compared using the nested chi-square difference test option of Mplus (Muthén & Muthén, Reference Muthén and Muthén1998–Reference Muthén and Muthén2012). When this nested chi-square difference test was not significant, full measurement invariance between PR and CR on the tested subscale was concluded. Only the subscales with full measurement invariance were included in the analyses described below. Partial measurement invariance was not tested because this allows only to compare factor scores and not sum scores, whereas in clinical and public health research, only the sum scores of BIS, BAS, BASD, BASRR, and BASFS are used.
To answer research question 1.2, a technique described by Bland-Altman and frequently conducted in biomedical sciences was used, and Pearson correlations between PR and CR (sub-)scales were calculated to assess correspondence, that is, extent to which the PR and CR scores are related. The Bland-Altman technique constitutes the descriptive statistics (1) mean of raw differences, that is, mean of absolute PR minus absolute CR scores, and (2) the 95% range of raw differences, that is {mean of raw differences + 1.96 standard deviations, mean of raw differences -1.96 standard deviations}. Therfore, the 95% range of raw differences on each (sub-)scale were evaluated on clinical acceptability against the total range of that subscale; for example, the BIS scale containing seven items has a total range of (7*4)-(7*1) = 28–7 = 21. Further, on plots with the mean of PR and CR scores on the X-axis and the raw differences between PR and CR scores on the Y-axis, the distribution of data has to be visually evaluated: if a heteroscedasticity or dispersion trend across the range of mean scores of the two measurements is present, agreement between two measurement methods is different according to the size of the measured values (technique of Bland & Altman, Reference Bland and Altman1986).
For research question 1.3, multiple linear regressions with child-age, child-gender, and parent-gender as independent variables, and the standardised difference scores (STANDIF) on the BIS and BAS (sub-)scales as dependent variable were conducted. The STANDIF of the (sub-)scales are calculated by subtracting the child standardised rating from parent standardised rating (De Los Reyes & Kazdin, Reference De Los Reyes and Kazdin2004). When interpreting the results of the regression analyses, it is important to keep in mind that the sign of STANDIF can be positive (i.e., children rate lower than parents) as well as negative (i.e., children rate higher than parents).
Main study aim 2 — Two-year stability of PR BIS/BAS scores
The research questions of main study aim 2, namely 2.1, 2.2, and 2.3 (see introduction), were investigated on the subsample mother-report 2011–2013 (Table 1).
For research question 2.1, full measurement invariance over time was tested, using the same analysis technique as described above for main study aim 1, research question 1.1. Only the (sub-)scales with full measurement invariance were included in the analyses described below.
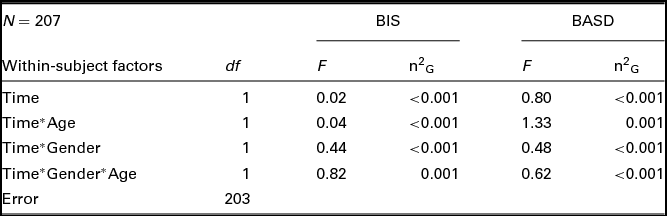
To answer research question 2.2, the descriptive statistics mean of raw differences, that is, PR2013 minus PR2011 mother-reported scores on each (sub-)scale, and 95% range of raw differences were reported (cf. research question 1.2). Further, full-factorial repeated measures ANCOVAs were conducted. Therefore, the PR2011 and PR2013 BIS/BAS scores were included in different repeated measures ANCOVAs as within-subjects factors (time). Child-gender was included as between-subjects factor and child-age as covariate in each repeated measures ANCOVA, and the default interaction terms of time with child-age and child-gender were allowed. In this way, possible average change over time of scores in boys and/or girls (time*gender), possible average change over time with the age-continuum (more change in older or younger children; time*age), and possible average change over time of scores in boys and/or girls with the age-continuum (time*gender*age) was evaluated. The sphericity assumption was not violated as the within-subject factor time contained only two levels. Generalised eta-squared values were computed, which are recommended effect sizes for repeated measures ANCOVAs (Bakeman, Reference Bakeman2005).
To answer research question 2.3, Spearman correlations between PR2011 and PR2013 BIS/BAS scores were calculated.
Results
Reliability and CFA of the PR and CR
Cronbach's αs, reported first for BIS, followed by BAS, BASD, BASRR and BASFS, were equal to 0.78, 0.85, 0.85, 0.71 and 0.55 respectively for the PR2011, to 0.76, 0.88, 0.89, 0.70, and 0.61 respectively for the PR2013, and to 0.70, 0.80, 0.78, 0.70, and 0.45 respectively for the CR2013.
CFA on the PR2013 displayed an adequate fit for the four-factor model (BIS, BASD, BASRR, BASFS). On the PR2011, the four-factor structure did not fit adequately. On the CR, the fit of the four-factor structure was adequate, the fit of the two-factor structure was not. Goodness-of-fit indices are shown in Table 2.
Confirmatory Factor Analyses Goodness-of-Fit Indices for Two- and Four-Factor Models

Note: df = degrees of freedom, CFI = Comparative Fit Index, RMSEA = root mean square error of approximation, PR = parent report, CR = child report.
*p < .001.
Main Study Aim 1 - Parent-Child Agreement on BIS/BAS Scores
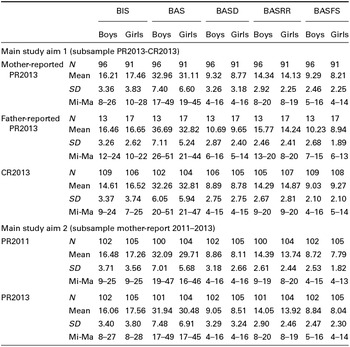
Table 3 shows the descriptive statistics on the BIS/BAS scores for subsample PR2013-CR2013.
Descriptive Statistics of the BIS/BAS Scores

Note: N = number, SD = standard deviation, Mi-Ma = Minimum–Maximum, BIS = Behavioral Inhibition System, BAS = Behavioral Activation System, BASD = drive subscale of the BAS scale, BASRR = reward responsiveness subscale of the BAS scale, BASFS = fun seeking subscale of the BAS scale, PR = parent report, CR = child report.
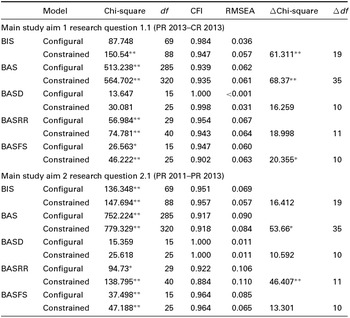
Table 4 shows goodness-of-fit indices of the measurement invariance analysis (research question 1.1). The configural model was adequate for BAS, BASFS, and BASRR, and good for BIS and BASD. The constrained model was adequate for BIS, BAS, BASFS, and BASRR, and good for BASD. However, the chi-squared difference test was significant for BIS, BAS, and BASFS, which means that the null-hypothesis of measurement invariance between these PR and CR (sub-)scales had to be rejected. The chi-square difference test was non-significant for BASD and BASRR. Hence, only for BASD and BASRR was full measurement invariance concluded and further analyses conducted.
Measurement Invariance Analyses: Goodness-of-Fit Indices for the Configural and the Constrained Model and Nested Chi-Square Difference Test Between the Configural and Constrained Model

Note: df = degrees of freedom, CFI = Comparative Fit Index, RMSEA = root mean square error of approximation, ∆ = change, PR = parent report, CR = child report, BIS = Behavioral Inhibition System, BAS = Behavioral Activation System, BASD = drive subscale of the BAS scale, BASRR = reward responsiveness subscale of the BAS scale, BASFS = fun seeking subscale of the BAS scale, Configural = model with factor loadings and thresholds free to vary across rater (research question 1.1) or across time (research question 2.1), Constrained = model with factor loadings and thresholds constrained to be invariant across rater (research question 1.1) or across time (research question 2.1).
*p < .05, **p < .01.
For research question 1.2, the means, standard deviations and 95% range of raw differences were 0.29, 3.44, and {-6.45, 7.03} respectively on BASD, and -0.26, 3.41, and {-6.94, 6.42} respectively on BASRR. The total range on BASD and on BASRR was 12 and 15 respectively. Although the means of raw differences between PR and CR on BASD and BASRR were close to zero, good agreement could not be confirmed: the 95% ranges of raw differences were not clinically acceptable when compared to the total ranges (e.g., BASD: parent rating could be 6.45 points lower or 7.03 points higher than child rating in 95% of cases, while a maximum 12 points of difference are possible on this scale). The Bland-Altman plots for BASD and BASRR (available on request by contacting the first author), revealed no trends across the range of scores, that is, no increasing or decreasing trend of the difference in scores between PR and CR when the values of the BASD or BASRR scores increased. Further, the Pearson correlation coefficients between PR and CR on BASD and BASRR were weak, that is, 0.33 (p < .001) and 0.19 (p = .005) respectively.
The results of the multiple linear regressions conducted for research question 1.3 are shown in Table 5. Child-age significantly and positively influenced BASD STANDIF, indicating a tendency of higher rating by younger children and lower rating by older children compared to their parents. There was a positive but not significant effect of child-age on BASRR STANDIF. Regarding child-gender, the regression coefficients were not significant, although a non-significant trend of a child-gender effect (higher rating of boys compared to PR than girls) on BASRR STANDIF was present. Parent-gender significantly influenced BASD STANDIF scores, indicating that fathers have more tendency to rate higher on BASD compared to the self-rating of children than mothers (estimated means and 95% confidence intervals on BASD STANDIF were 0.50 {0.07, 0.92} for fathers and -0.03 {-0.20, 0.14} for mothers).
Research Question 1.3 — Multiple Linear Regression To Identify Influencing Factors of Parent-Child Discrepancies

Note: β = standardised regression coefficient; t = value of t-test statistic, between brackets; STANDIF = the standardised parent score minus standardised child score; BASD = drive subscale of the BAS scale, BASRR = reward responsiveness subscale of the BAS scale.
a Male = 0; female = 1.
*p < .05.
Main Study Aim 2: Two-Year Stability of PR BIS/BAS Scores
Table 3 shows the descriptive statistics on the BIS/BAS scores for subsample PR2011 and PR2013. Table 4 displays goodness-of-fit indices of the measurement invariance analysis (research question 2.1). The configural model was adequate for BIS and good for BASD, but not for BAS, BASFS, and BASRR. The constrained model was good for both BIS and BASD, and the chi-squared difference test was also not significant for BIS and BASD. Hence, full measurement invariance was concluded for the BIS and BASD (sub-)scale.
Considering research question 2.2, the means, standard deviations, and 95% range of raw differences — that is, mother-report 2013 minus mother-report 2011 — were −0.05, 3.72, and {−7.34, 7.24} on BIS, and 0.29, 2.78, and {−5.16, 5.74} on BASD respectively. The total range on BIS and on BASD was 21 and 12 respectively. Both means of raw differences were close to zero (|<0.3|). Concerning BIS, 95% of the raw difference scores were up to one third of the total range higher or lower at 2013 compared to 2011. Concerning BASD, raw difference scores varied between one third and half of the total range. Further, the repeated measures ANCOVAs, shown in Table 6, revealed no significant within-subject effects (factor time, time*age, time*gender, time*age*gender). This absence of significant time-effects indicated that on average, the mother-reported BIS and BASD scores did not change over a time period of 2 years in children aged 5.5–11 years at baseline and 7.5–13 at follow-up.
Research Question 2.2 — Tests of Within-Subjects Effects of Repeated Measures ANCOVAs on BIS and BASD

Note: N = number, BIS = Behavioral Inhibition System Scale, BASD = drive subscale of the Behavioral Activation Scale, df = degrees of freedom (df are the same for both ANCOVAs), F = F test of repeated measures ANCOVA, n2 G = effect size generalised eta squared as a measure (abP-design, see Bakeman, Reference Bakeman2005).
*p < .05, **p < .01.
Spearman correlation coefficients between mother-reported PR2011 and PR2013 BIS and BASD scores were moderate, that is, 0.47 (p < .001) and 0.59 (p < .001) respectively (research question 2.3).
Discussion
The present study evaluated two methodological concerns about the use of a PR and CR version of the BIS/BAS scale for children. First, agreement of parent and child ratings was investigated. Second, stability of the PR scores over time was examined. These main aims are discussed below.
Before investigating the main research aims, the internal validity of the scales was checked. The Cronbach αs of the PR and CR version were comparable or better than in previous studies (Kingsbury et al., Reference Kingsbury, Coplan, Weeks and Rose-Krasnor2013; Muris et al., Reference Muris, Meesters, de Kanter and Timmerman2005; Vervoort et al., Reference Vervoort, Vandeweghe, Vandewalle, Van Durme, Vandevivere, Wante and Braet2015; Vervoort et al., Reference Vervoort, Wolters, Hogendoorn, de Haan, Boer and Prins2010). Similar to previous studies, the BASFS subscale was less reliable in the current study. Further, the four-factor structure of the PR reported by Vervoort et al. (Reference Vervoort, De Caluwé, Vandeweghe, De Decker, Wante, Van Beveren and Braet2017) was confirmed for the PR2013. Remarkably, the fit was not adequate in 2011. This might be due to the measurement process: in 2011, parents may have filled out the PR after filling out other questionnaires, while in 2013, parents first filled out the PR. Since every subscale was tested separately for measurement invariance over time, and since the Cronbach αs of the PR2011 (sub-)scales were similar to the αs of the PR2013 (sub-)scales, the PR2011 could be used for the aims of the present study. Considering the CR, the finding in favour of the four-factor model is in line with results of a CFA conducted by Kingsbury et al. (Reference Kingsbury, Coplan, Weeks and Rose-Krasnor2013).
In sum, the BIS, BASD and BASRR subscales of the PR and CR may be validly applied in children. Caution is indicated regarding the internal reliability of the BASFS subscale. Adaptations of the BASFS subscale were beyond the scope of this study, but future research might explore how to improve the BASFS reliability.
Main Study Aim 1 — Parent-Child Agreement on BIS/BAS Scores
Before testing parent-child agreement, measurement invariance between parents’ and children's rating on the scale scores was tested. The criteria for full measurement invariance between PR and CR were not reached for the BIS and BAS scales and for the BASFS subscale, and therefore, their sum scores could not be compared between PR and CR. The items might not have a similar meaning to parents than for children (Brown, Reference Brown2006).
On the measurement invariant BASD and BASRR subscales, correspondence and agreement between parent and child, as well as influencing factors of parent-child discrepancies, were evaluated. The current results depicted that parent-child correspondence on BASD and BASRR approach typical levels of parent-child agreement, that is, weak correlation, such as is often observed for most symptom measures of psychopathology and child/adolescent behavioural and emotional questionnaires (Achenbach et al., Reference Achenbach, McConaughy and Howell1987). Based on these weak correlation results and the wide 95% ranges of raw differences on BASD and BASRR, discrepancy between PR and CR BASD and BASRR ratings may be concluded.
The conclusion of measurement non-invariance on BIS, BAS and BASFS, and discrepancy on BASD and BASRR, is important for future research. It is often recommended to use multiple informants to assess a child's psychosocial functioning (Offord et al., Reference Offord, Boyle, Racine, Szatmari, Fleming, Sanford and Lipman1996), and to combine the multiple informants’ ratings into a single variable (De Los Reyes, Thomas, Goodman, & Kundey, Reference De Los Reyes, Thomas, Goodman and Kundey2013). However, it might be better to collect both reports but treat them independently, since the current study found that parent and child ratings may not have a similar meaning.
Previous studies have reported an influence of child-age on parent-child discrepancies, but the direction of this influence was uncertain (De Los Reyes & Kazdin, Reference De Los Reyes and Kazdin2005). The present results suggested that, compared to the parent rating, the child rating on BASD tends to be higher in younger and lower in older children. On BASRR, similar but non-significant tendencies were found. This tendency of higher CR in younger children compared to PR, and lower CR in older children compared to PR, was also found in a study of Weems, Taylor, Marks, and Varela (Reference Weems, Taylor, Marks and Varela2010). This effect might be explained by improvement of cognitive skills and/or rising of social desirability in children with age, or by parental response bias (e.g., cultural ideas on how approach behaviour has to appear in different age groups), but these explanations remain speculative. Future research has to explore the above-mentioned hypotheses.
Besides child-age, the influence of child-gender on parent-child discrepancies was evaluated, but was found to be non-significant for BASD and BASRR. This finding is in line with a literature review that concluded absence of child-gender effects (De Los Reyes & Kazdin, Reference De Los Reyes and Kazdin2005).
Further, a significant parent-gender effect was found on BASD parent-child discrepancies, but not on BASRR. As hypothesised, the average STANDIF on BASD was closer to zero in mothers compared to fathers. This finding might be explained by mothers still being the primary caregivers. Possibly, mothers are somewhat more accurate reporters of their child's behaviour than fathers. Future research has to confirm this hypothesis. However, this finding suggests the importance of considering parent-gender when investigating the influencing factors on parent-child discrepancies. Until now, mainly, but not exclusively, mothers are included in studies of parent-child discrepancies, probably because mothers are often more consistently available (De Los Reyes & Kazdin, Reference De Los Reyes and Kazdin2005; Duhig et al., Reference Duhig, Renk, Epstein and Phares2000). Nevertheless, not considering parent-gender may lead to biased conclusions and to inconsistencies in literature.
Although not investigated in this study, the remaining unexplained parent-child discrepancy may be due to other influencing factors; for example, different attributions and perspectives of parent and child, different perceptions on the strength of avoidance or approach behaviour, differences in memory recall, and response bias (De Los Reyes & Kazdin, Reference De Los Reyes and Kazdin2005).
Two-Year Stability of PR BIS/BAS Scores
Before testing the stability of the PR BIS/BAS scores over 2 years, measurement invariance was considered. The criteria for full measurement invariance between the mother-report 2011 and 2013 were not met for the BAS scale, and the BASRR and BASFS subscales. Consequently, sum scores of these (sub-)scales could not be compared over time. Future research is needed to repeat these findings.
For the measurement-invariant BIS scale and the BASD subscale, the current study was the first to demonstrate that on average, absolute mother-reported BIS and BASD scores in children aged 5.5–11 years at baseline may not change over a 2-year period. However, the scores of an individual child could increase or decrease up to one third of the total range of the BIS scale, and up to half of the total range of the BASD subscale, reflecting changes in BIS and BASD scores when looking at an individual level instead of an average level of change. Besides this, the rank order of children remained moderately stable over 2 years on BIS and BASD.
In sum, these results suggest that on average, mother-reported punishment sensitivity and motivated behaviour to pursue rewarding goals did not change substantially over 2 years in this study sample with participants between 5.5 and 13 years using the PR BIS/BAS scale. The findings are in line with results of previously mentioned personality research (Caspi & Silva, Reference Caspi and Silva1995) and of findings by Braams et al. (Reference Braams, van Duijvenvoorde, Peper and Crone2015), but in contrast with the recently emerging hypothesis of age-related absolute changes in BIS and BAS reactivity during development (e.g., Cauffman et al., Reference Cauffman, Shulman, Steinberg, Claus, Banich, Graham and Woolard2010; Urosevic et al., Reference Urosevic, Collins, Muetzel, Lim and Luciana2012). One explanation for the contrasting finding might be the use of different measures to assess BIS and BAS reactivity, that is, PR BIS/BAS scale in the present study versus original adult self-report BIS/BAS scale in the study of Urosevic et al. (Reference Urosevic, Collins, Muetzel, Lim and Luciana2012) versus behavioural measures in the study of Cauffman et al. (Reference Cauffman, Shulman, Steinberg, Claus, Banich, Graham and Woolard2010). The BAS subscales might be individual difference measures that are not related to age because the respondent answers the questionnaire age adequately, that is, compared to the level of general reward motivation to other children of the same age. If so, an explanation for the results of Urosevic et al. (Reference Urosevic, Collins, Muetzel, Lim and Luciana2012) might be that the BASRR subscale was not measurement invariant over time, which was not tested. An alternative explanation might be the different age ranges of the study samples. For example, Urosevic et al. (Reference Urosevic, Collins, Muetzel, Lim and Luciana2012) found a significant time effect on the BASRR subscale of the adult Carver and White BIS/BAS scale over a 2-year period in a study sample with ages 9–18 years at baseline. These results suggested a rise in BASRR from 9 years on. However, when only analysing the early adolescent group (age 9–12 at baseline), no significant time effect was found by Urosevic et al. (Reference Urosevic, Collins, Muetzel, Lim and Luciana2012). Possibly, the increase in reactivity in the underlying neurobiological systems does not emerge before onset of puberty.
Strengths, Limitations, and Directions for Future Research
The present study was conducted on a large study sample that was followed over a period of 2 years. The sample consisted of primary school children, an understudied age group. Further, the internal validity of the used measures was checked.
The present findings also have some limitations. First, in the survey in 2011, the identity of the parent who completed the PR was not registered, but we assumed PR2011 completion by the mother in all cases in which the PR2013 was completed by the mother. Anyhow, no significant average PR change over time in BIS and BASD scores was found. Second, some authors question the BIS scale, which is based on the original RST, and have proposed a revised version of the RST (J.A. Gray & McNaughton, Reference Gray and McNaughton2000). However, for the current study, it was decided to use the BIS scale as developed, based on the original RST (Carver & White, Reference Carver and White1994), since in the literature the original BIS scale and BAS subscales have been found to be suitable for clinical practice and epidemiological research to determine risk factors of divers health outcomes (e.g., Bijttebier et al., Reference Bijttebier, Beck, Claes and Vandereycken2009; Verbeken et al., Reference Verbeken, Braet, Lammertyn, Goossens and Moens2012). Further limitations are the limited number of influencing factors of parent-child discrepancies and the preponderance of mothers compared to fathers in our study.
For future research, it is recommended to include other influencing factors of parent-child discrepancies in BIS/BAS scores such as psychosocial problems in the child or parent, and problems in parent-child communication (De Los Reyes & Kazdin, Reference De Los Reyes and Kazdin2006; Guion, Mrug, & Windle, Reference Guion, Mrug and Windle2009). Next, we recommend that in the future, both mother- and father-reports, or —if impossible — only mother- or only father-reports are included in studies. The present study was designed to investigate the main study aims during childhood. However, adolescence is suggested to be an important developmental phase of reward-related processes, and therefore, future longitudinal research is recommended to examine measurement invariance and absolute and relative stability on the PR and CR BIS/BAS scores between the transition from pre-puberty to puberty. Because onset of puberty can be a better cut-off than age when analysing the relation between developmental phases and BIS or BAS reactivity, the inclusion of methods to measure the onset of puberty is strongly recommended.
Clinical Implications
The height of the BIS and BAS reactivity score tend to predict multiple health outcomes; high BIS reactivity has been related to internalising problems such as anxiety (Vervoort et al., Reference Vervoort, Wolters, Hogendoorn, de Haan, Boer and Prins2010) and depression (Muris et al., Reference Muris, Meesters, de Kanter and Timmerman2005), whereas high BAS reactivity has been related to externalising problems such as substance abuse (Genovese & Wallace, Reference Genovese and Wallace2007), attention deficit hyperactivity disorder and oppositional defiant disorder (Becker et al., Reference Becker, Fite, Garner, Greening, Stoppelbein and Luebbe2013; Luman, Van Meel, Oosterlaan, & Geurts, Reference Luman, van Meel, Oosterlaan and Geurts2012), and overweight (Verbeken et al., Reference Verbeken, Braet, Lammertyn, Goossens and Moens2012). Hence, estimating BIS and BAS reactivity in children may be helpful in clinical practice to gain insight into the mechanisms underlying these various problems and to offer an intervention approach tailored to the child's characteristics (Belsky & van Ijzendoorn, Reference Belsky and Van Ijzendoorn2015). This study provides information on the reliability, validity, and comparability of the PR and CR BIS/BAS scales, which is sensible when assessing children in clinical practice. The results support the validity of the use of the BIS, BASD, and BASRR subscales of the PR and CR in children. Moreover, mother-reported BIS and BASD scores may reflect moderately stable childhood characteristics. Furthermore, it may be advisable to assess both PR and CR but treat the scores as independent information.
Conclusion
The PR and CR version of the BIS/BAS scale were found to be measurement invariant but discrepant on BASD and BASRR. As hypothesised, child-age and parent-gender were significant influencing factors of the discrepancies on BASD, and child-gender was not. However, no significant influence of child-age and parent-gender was found on parent-child discrepancies on BASRR. In younger children, child ratings on BASD tended to be higher than parent ratings, whereas in older children, child ratings tended to be lower than parent ratings. Further, fathers’ rating on BAS Drive tended to be higher compared to the self-rating of children than mothers’ rating. Finally, the current study found that the mother-reported BAS scale and the BASRR and BASFS subscale were not measurement invariant over time, and therefore, PR-data on BAS, BASRR, and BASFS of 2011 and 2013 were not comparable. However, mother-reported BIS and BASD scores could be compared. The results suggested that mother-reported BIS and BASD scores may be used as stable parameters in longitudinal analyses to predict health outcomes in primary school children over a period of 2 years.
Acknowledgments
The authors want to thank the participating children and their parents for their voluntary participation. This work was supported by Flanders Innovation and Entrepreneurship (A.D.D., S.V., L.V, C.B., S.D.H., Grant SBO-120054); Research Foundation — Flanders (I.S., Grant 1.2.683.14.N.00); and Ghent University (N.M).
Declaration of Interest
None.