Cardiovascular autonomic dysfunction, as a form of autonomic neuropathy, is far from rare in children and adolescents with diabetes.Reference Barkai and Madacsy1 Although various noninvasive tests of autonomic function are performed to assess the presence of cardiac autonomic neuropathy in adults, such studies are limited in children.Reference Barkai and Madacsy1–Reference Risk, Bril, Broadbridge and Cohen8 The altered sympathovagal balance in diabetic patients may contribute to cardiac electrophysiological heterogeneity.Reference Robillon, Sadoul and Benmerabet9 It is known that changes in autonomic tone may also affect the duration of the electrocardiographic p wave, possibly through effects on the velocity of intraatrial conduction.Reference Cheema, Ahmed, Kadish and Goldberger10 To our knowledge, thus far there has been no study on the duration and dispersion of the p wave in diabetic children. This prompted us, therefore, to investigate these features in children with type 1 diabetes, comparing them to other tests of autonomic function.
Subjects and methods
Population studied
Our patients comprised 49 consecutive children seen with type 1 diabetes, 22 being females and 27 males, with a mean age of 14.2 ± 4.8 years. They were recruited from the population of diabetics regularly attending the outpatient clinic at our hospital. They had been diagnosed with diabetes from 1 year to 22 years previously, with a mean duration of diabetes of 6.2 ± 4.6 years, and a mean level of haemoglobin A1c of 8.1 ± 1.5%. None of the patients had any disease apart from diabetes, and none had clinical symptoms and signs suggestive of diabetic autonomic neuropathy. Their controls consisted of 32 age- and sex-matched healthy children, 20 females and 12 males, with a mean age of 12.7 ± 4.5 years. Neither the diabetic nor the healthy subjects had been treated with any drugs, except for insulin, during the period of study or during the preceding two weeks. We performed our research during 2007, having obtained approval from our Ethics Committee, and informed consent from all participants and their parents.
Methods
After 10 minute resting in supine position in a quite room, we obtained a 12-lead electrocardiogram and measurements of blood pressure in all patients and their controls. To perform the Valsalva maneuver, all the subjects were fitted with a noseclip, and instructed to forcefully blow into a mouthpiece connected via a short plastic tube to an aneroid manometer at a pressure of 30 mmHg for 15 seconds. A small bore needle, inserted into tubing, prevented undetected closure of the glottis by obliging the subjects to maintain a small flow of air to keep the manometer pressure at a constant level. Thus, the pressure in the mouthpiece was representative of intrapleural pressure during the period of straining.Reference Elisberg, Goldberg and Snider11 To obtain a better result, subjects were asked to repeat the Valsalva maneuver several times. After training, each subject performed the Valsalva maneuver concomitant with simultaneous recording of the 12-lead electrocardiogram. We also recorded the response in terms of blood pressure to a period of standing for 10 minutes.
Tests of autonomic function
We studied
• The Valsalva ratio, this being the reflex response to the Valsalva maneuver, including the extent of tachycardia and peripheral vasoconstriction during strain, followed, after release, by an overshoot rise in blood pressure and bradycardia. The ratio is calculated by relating the longest RR interval after the maneuver, this reflecting the overshoot bradycardia, to the shortest RR interval during the maneuver, reflecting the tachycardia during strain.Reference Ewing, Campbell and Clarke4 The RR intervals were measured with a ruler on the electrocardiogram trace. Values for the ratio of less than 1.40 were considered abnormal.Reference Mitchell, Wealthall and Elliott5
• Resting heart rates were determined with a routine electrocardiography device by measuring RR intervals after 10 minutes of rest in the supine position.
• To evaluate orthostatic hypotension, we measured the blood pressure with the subjects in supine position after a period of resting for 10 minutes, and then after each subject had stood still for 10 minutes. A fall in systolic blood pressure of greater than 20 mmHg was considered abnormal.
Measurements of the p wave in the 12-lead electrocardiogram
All 12 electrocardiogram leads were simultaneously recorded at a paper speed of 25 mm/s and a voltage of 10 mm/mV. Electrocardiograms were scanned in 24-bit colour bitmap image files through an optical flatbed scanner (Hewlett Packard PSC 1510). All computer work was performed on a desktop personal computer equipped with a 1.60 GHz intel Pentium microprocessor. The images were stored in a Windows bitmap file format. All electrocardiograms were then magnified, and the duration of the p wave was measured in miliseconds. The measurement was performed by a single experienced investigator blinded to the identity of the subjects. The onset of the p wave was defined as the junction between the isoelectric line and the start of p wave deflection, and the offset of the p wave as the junction between the end of the p wave deflection and the isoelectric line.Reference Waggoner, Adyanthaya, Quinones and Alexander12 If the beginning or the end of the deflection could not be identified satisfactorily, that lead was not used.Reference Dogan, Acar and Gedikli13 If the p wave was measurable in at least 9 leads, the patient was kept for further analysis.Reference Kose, Kilic, Iyisoy, Kursaklioglu and Lenk14 In each lead, we calculated the mean values for 3 complexes. The maximal and minimal duration of the p waves were selected from the 12 leads of the surface electrocardiogram. The difference between maximal and minimal durations was defined as the dispersion of the p wave.Reference Dilaveris, Gialafos and Sideris15
Analysis of the 20th p wave after the release of Valsalva maneuver, this generally representing the maximal effect on the RR interval, was used to assess the effect of the Valsalva maneuver on dispersion.Reference Tukek, Akkaya and Demirel16
Intraobserver coefficients of variation, calculated by taking standard deviations of differences between two observations divided by the mean value and expressed as percentages, were found in 20 subjects to be 2.1%, 3%, 4.7% before the Valsalva maneuver, and 1.8%, 2.6%, and 4.3% after the maneuver for the maximal and minimal durations, and the extent of dispersion, respectively.
Glycaemic control
Long term metabolic control of diabetes was estimated by the level of mean glycated haemoglobin over one year measured at 3-monthly intervals. Glycated haemoglobin was measured by high performance liquid chromatography with a range of 4.1–6.2%.
Statistical analysis
All data were expressed as mean ± standard deviations. The SPSS 15.0 for Windows was used for statistical analysis. Comparisons between diabetics and controls were assessed using Student’s t-tests for continuous variables, and chi-square tests for discrete variables. Data was analysed using the Mann-Whitney test where appropriate. P-values less than 0.05 were considered statistically significant.
Results
We enrolled 49 diabetic children, comparing them with 32 healthy controls. The diabetic subjects had been diagnosed from 1 to 22 years previously, with a mean of 6.2 ± 4.6 years. There were no significant differences between the diabetic and control subjects concerning age and gender.
The mean resting heart rate for the diabetic children was 87 ± 14 beats per minute, and for controls was 92 ± 13 beats per minute. The means for the groups were not significantly different (p equals to 0.12).
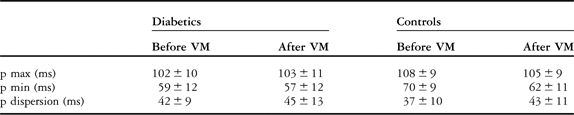
The Valsalva ratio in diabetics was 1.93 ± 0.42, and for controls was 2.05 ± 0.46. The means of the Valsalva ratios were not significantly different between the patients and their controls. Using the value of 1.40 to indicate normality, we found that 4 diabetic children and 1 control patient had abnormal results. Orthostatic hypotension was found in 5 diabetic subjects, but in only 1 control subject, with no significant difference between the groups. The baseline values for the maximal and minimal durations of the p wave, and the dispersion of the p wave, were similarly not significantly different between males and females for either the patients or their controls. The maximal and minimal durations, however, were significantly decreased in diabetic children compared to their controls, with the dispersion also significantly increased in the diabetic subjects (Tables 1 and 2). The values for dispersion in the diabetic subjects were similar before and after the Valsalva maneuver, whereas the dispersion in the controls was significantly increased after this maneuver. The minimal duration of the p waves in the control subjects was also significantly decreased after the Valsalva maneuver (Tables 1 and 2).
Comparison of electrocardiographic characteristics of our diabetic subjects with their controls.
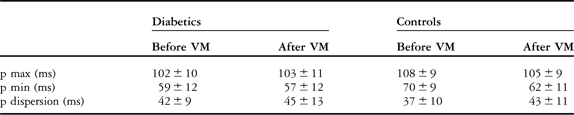
VM: Valsalva maneuver.
Statistical p-values before and after Valsalva maneuver in diabetics and controls.

VM: Valsalva maneuver.
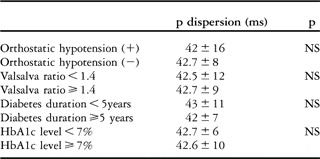
No significant correlation was found between the dispersion of the p wave and the levels of haemoglobin A1c. The extent of dispersion in diabetic patients with a duration of disease greater than 5 years was also not significantly different from that in subjects with a duration of less than 5 years (p equals to 0.7). Dispersion was not different in diabetic children with a normal or abnormal Valsalva ratio, nor were the values for dispersion affected by the presence of orthostatic hypotension (Table 3).
Comparison of the studied parameters with p dispersion.

NS: nonsignificant (p > 0.05).
Discussion
Diabetic autonomic neuropathy is well recognized in patients with insulin-dependent diabetes mellitus, with some developing florid features of the complication.Reference Clarke, Ewing and Campbell17, Reference Hosking, Bennett and Hampton18 The symptoms of diabetic neuropathy have long been known, and several methods are recommended for elucidation of subclinical signs. Objective, simple, and easily reproducible methods are particularly needed in children with diabetes to demonstrate the dysfunction of the autonomic nervous system.Reference Barkai, Madacsy and Kassay3 For this purpose, studies have concentrated on resting heart rate, the response of the heart rate to standing, the Valsalva ratio, and orthostatic hypotension.Reference Barkai and Madacsy1, Reference Barkai, Madacsy and Kassay3, Reference Mitchell, Wealthall and Elliott5, Reference Mitchell, Wealthall and Elliott6
In diabetic patients, rapid heart rates due to parasympathetic damage may herald the early stage of cardiac autonomic involvement,Reference Ewing, Campbell and Clarke4 with Barkai and colleaguesReference Barkai and Madacsy1 reporting significantly higher resting heart rates compared to controls. In our study, however, the mean resting heart rate of our diabetic patients was not significantly different compared to their healthy controls. This test, moreover, is known to be influenced by factors such as excitement and stress, producing false positive results.Reference Mitchell, Wealthall and Elliott5
The heart rate response to the Valsalva maneuver has been used extensively in the study of autonomic neural function.Reference Baldwa and Ewing19–Reference Lewin21 Some difficulty was encountered using the maneuver in children, and it certainly requires considerable effort and co-operation.Reference Mitchell, Wealthall and Elliott5 We found the Valsalva ratio to be lower in the diabetic subjects than in the controls, albeit that the difference did not reach significance, confirming the findings of others.Reference Mitchell, Wealthall and Elliott5 As with our findings, this other group showed that the Valsalva ratio was insignificantly correlated with the other tests of autonomic nerve function, and suggested it not to be a valid test for autonomic neuropathy in children.Reference Mitchell, Wealthall and Elliott5 We agree, and suggest that the Valsalva ratio is a less than optimal method for evaluating cardiovascular autonomic integrity in children. Orthostatic hypotension reflects sympathetic damage, and occurs later in the course of diabetes. We detected such orthostatic hypotension in one-tenth of our cohort of diabetic patients, and also in 1 of our control subjects. These differences were not statistically significant, findings consistent with the observations of Barkai et al.Reference Barkai and Madacsy1 The variability in heart rate is also used to analyze autonomic function.Reference Risk, Bril, Broadbridge and Cohen8 We were unable to use this test due to unavailability of Holter apparatus, making this a limitation of our study.
Dispersion of the p wave is a simple and useful electrocardiographic marker that reflects inhomogeneous and discontinuous propagation of the sinus impulses.Reference Dilaveris, Gialafos and Sideris15, Reference Spach and Dolber22 Increased dispersion indicates electrophysiological heterogeneity within the atrial myocardium. Altered sympathovagal balance in diabetic patients may contribute to this electrophysiological heterogeneity.Reference Robillon, Sadoul and Benmerabet9 It is known that changes in autonomic tone may affect the duration of the p wave, mainly through effects on atrial conduction velocity.Reference Cheema, Ahmed, Kadish and Goldberger10 The signal averaged duration of the p wave is not a fixed variable, being shown to change significantly under different autonomic conditions.Reference Cheema, Ahmed, Kadish and Goldberger10 Parasympathetic stimulation lengthens, and sympathetic stimulation shortens, the duration.Reference Cheema, Ahmed, Kadish and Goldberger10 As far as we are aware, there has been no previous use of dispersion of the p wave as a test of cardiac autonomic function in diabetic children. We found, nonetheless, that the maximal and minimal durations of the p wave in diabetic children were significantly decreased compared to the control subjects. An increased dispersion in diabetics can be explained on the basis of significantly decreased minimal values. This may be the initial and earliest indicator of parasympathetic dysfunction in diabetic children.
We found that dispersion was increased after the Valsalva maneuver in healthy children. This can be explained by the disturbance of atrial electrophysiological homogeneity after the maneuver, which has both sympathetic and parasympathetic components. While we showed that the maximal duration did not change significantly, we found a considerable decrease in the minimal duration, which might be due to the dominance of sympathetic activation after the maneuver in healthy children. In the diabetic children, in contrast, we speculate that the maneuver has no effect due to the presence of already impaired atrial electrophysiological homogeneity.
Well-known difficulties with manual measurement of p waves using calipers and magnifying glass has led to the introduction of more advanced methods assisted by technology, believed to be more reliable.Reference Dilaveris, Andrikopoulos and Metaxas23 Scanning and digitizing electrocardiogram signals from paper records using an optical scanner in this respect has been shown to be a suitably accurate alternative method,Reference Andrikopoulos, Dilaveris and Richter24 and so we employed this technique.
In conclusion, we have shown that increased dispersion of the p wave in diabetic children provides evidence of the genesis of cardiac electrophysiological heterogeneity before parasympathetic and sympathetic dysfunction are detected using other tests of autonomic function. Measurement of the dispersion of the p wave is an objective and relatively simple method, which can therefore be used as a test of cardiac autonomic function.
Acknowledgments
We thank Dr. O. Seymen for his contributions, and Dr. A. Dirican for his help with the statistical analyses.