Introduction
Stereotactic body radiotherapy (SBRT) is increasingly being used as a treatment option for non-small cell lung cancer (NSCLC) patients due to better local control results.[Reference Fakiris, McGarry and Yiannoutsos1,Reference Onishi, Shirato and Nagata2] In SBRT, large doses are delivered in a few fractions to the tumour volume. This results in a greater biological effect than conventional radiotherapy fractionation schemes. VMAT (volumetric modulated arc therapy) is becoming increasingly popular as a treatment method for SBRT. To reduce the risk of tissue toxicity caused by high doses per fraction, it is only applied to small tumours.
Dose calculation algorithms are broadly divided into three categories[Reference Khan3]: Correction-based, Model-based and direct Monte Carlo (MC). Compared with conventional correction-based methods, model-based convolution methods have significantly improved the accuracy of dose calculations for heterogeneous materials. Pencil beam convolution, collapsed cone convolution and anisotropic analytical algorithm (AAA) are examples of the model-based algorithm. Model-based algorithms are categorised as type ‘b’ algorithms.[Reference Ojala and Kapanen4,Reference Knöös, Wieslander and Cozzi5] Acuros XB (AXB), a grid-based linear Boltzmann transport equation solver, considers each material’s composition and accounts directly for the effect of heterogeneities in the volume during dose calculations. AXB algorithm is implemented in Eclipse® TPS that promises MC accuracy with reasonable computation time.[Reference Failla, Wareing, Archambault and Thompson6] AXB reports dose to medium (AXB-Dm) or dose to water (AXB-Dw). MC and AXB are categorised as type ‘c’ algorithms.[Reference Ojala and Kapanen4,Reference Zhou, Bennion and Ma7]
The main challenges associated with the dose calculation of lung SBRT plans are targets surrounded by low-density heterogeneity, plans with many highly modulated small-field segments and steep dose gradients. Traditional treatment planning algorithms could not account for decreased lateral charged particle equilibrium in low-density medium and small field segments. The limitation of the convolution method is its inability to model the backscattered photons and secondary electrons at interfaces with density differences.[Reference Han, Mikell, Salehpour and Mourtada8] Studies have reported a dosimetric discrepancy of about 10% in the presence of low-density heterogeneities for type ‘b’ algorithms than measurements or MC simulations.[Reference Rana, Rogers, Lee, Reed and Biggs9,Reference Hasenbalg, Neuenschwander, Mini and Born10] The new generation type ‘c’ dose calculation algorithms and fast MC algorithms implemented in commercial treatment planning systems (TPS) provide improved dose calculation accuracy over type ‘b’ algorithms in heterogeneity and complex calculation geometries.[Reference Han, Mikell, Salehpour and Mourtada11] Several investigators reported a better dose prediction accuracy of the AXB over AAA compared to the measurements and MC simulations.[Reference Vassiliev, Wareing, McGhee, Failla, Salehpour and Mourtada12–Reference Ojala, Kapanen, Hyödynmaa, Wigren and Pitkänen15] Several studies concluded that AXB is a fast and accurate alternative to MC for patient dose calculations.[Reference Fogliata, Nicolini, Clivio, Vanetti, Mancosu and Cozzi13–Reference Ojala, Kapanen, Hyödynmaa, Wigren and Pitkänen15] Majority of MC validation studies of AXB were conducted with heterogeneous phantoms,[Reference Han, Mikell, Salehpour and Mourtada11,Reference Fogliata, Nicolini, Clivio, Vanetti and Cozzi16,Reference Seniwal, Bhatt and Fonseca17] and some of the studies recommend further validation of AXB with clinical plans.[Reference Ojala18–Reference Muñoz-Montplet, Marruecos and Buxó20] The majority of MC validations of lung SBRT clinical plans were performed using BEAMnrc codes.[Reference Bush, Gagne, Zavgorodni, Ansbacher and Beckham14,Reference Ojala, Kapanen, Hyödynmaa, Wigren and Pitkänen15,Reference Moiseenko, Liu and Bergman21] Comparison studies were also performed with XVMC (X-Ray Voxel Monte Carlo)[Reference Tsuruta, Nakata and Nakamura22,Reference Zhuang, Djemil and Qi23] and Geant4.[Reference Boiset, Batista and Coutinho24]
MC simulation techniques are considered the gold standard for radiation absorbed dose calculation.[Reference Andreo25,Reference Verhaegen and Seuntjens26] PRIMO[Reference Rodriguez, Sempau and Brualla27] is an MC simulation package used for the full MC simulation of linac and for calculating the dose distribution in water phantoms and computed tomography (CT). PRIMO is based on the general-purpose MC code PENELOPE.[Reference Baro, Sempau, Fernández-Varea and Salvat28] The desirable features of PRIMO compared to general-purpose MC code are explained below. The coding efforts and the long computation time are two main challenges in the MC simulation of clinical plans with the general-purpose MC codes. Due to the incorporation of different linac models and multi-leaf collimator (MLC) components, PRIMO does not require coding efforts for linac modelling. The simulation of clinical plans is much faster due to the availability of a fast MC algorithm for electron and photon transport inside the patient geometry named dose planning method (DPM)[Reference Sempau, Wilderman and Bielajew29] and different variance-reduction techniques.[Reference Brualla30] PRIMO allows importing CT images, structures and dose files from an external system in DICOM format. The graphical user interface simplifies configuring and running the linac simulation. The built-in analysis tools include analysing DVH and dose profiles and comparing experimental dose measurements with the MC-estimated dose distributions using the gamma index. The parallel processing capability of PRIMO helps to reduce the simulation time.
In the present study, we used PRIMO MC code to evaluate the performance of AXB and AAA algorithms in the case of Lung SBRT. In this study, custom made lung-equivalent inserts and GafchromicTM (Ashland Advanced Materials, USA) films were used for the phantom-based validation of algorithms. Only a few studies have been published on validating clinical treatment plans using the PRIMO MC code.[Reference Fogliata, De Rose, Stravato, Reggiori, Tomatis, Scorsetti and Cozzi31,Reference Rodriguez and Brualla32] To the best of our knowledge, this was the first time lung SBRT treatment plans were validated using the DPM algorithm of the PRIMO MC code.
Materials and Methods
Simulation setup
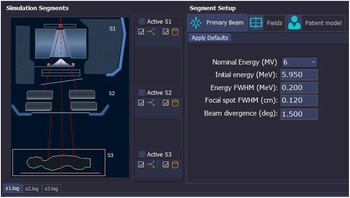
PRIMO[Reference Brualla30] software Version 0·3·64 (https://www.primoproject.net) was used for the MC simulations performed in this study. The full MC simulation of Clinac®iX (Varian Medical Systems, Palo Alto, USA) linac was performed using PRIMO.[Reference Sarin, Bindhu, Saju and Nair33] PRIMO allows tallying the Phase-Space File (PSF) at three positions. The first PSF was tallied at the lower end of the upper part of the linac above the jaws, identified in PRIMO as segment-1 (s1). The second PSF was tallied at the downstream end of the linac, consisting of sets of jaws and a MLC (identified as segment-2 (s2)). The s2 stage uses the phase-space file created at segment-1 (s1) as the radiation source. The geometric region corresponding to the patient or phantom, in which the absorbed dose is estimated, is called segment-3 (s3). The simulation interface of PRIMO is shown in Figure 1. In PRIMO, the simulation efficiency ϵ is calculated using equation 1.
 $$\varepsilon = {1 \over {{\Delta ^2}t}}$$
The simulation configuration interface of PRIMO.

where Δ is the average statistical uncertainty achieved in a simulation time of t seconds. PRIMO reports the average statistical uncertainty (at 2SD) of all voxels accumulating more than 50% of the maximum absorbed dose.
The Clinac 2300 head geometry available in PRIMO was used to generate the Clinac® iX PSF since both models share the same head geometry. Since the linac geometries are included in the PRIMO package, the user does not have to specify the geometry or material of the linac head. In PRIMO, the energy distribution of primary electrons striking the target is defined as a Gaussian distribution. Before the simulation can begin, values must be defined for the primary electron beam energy, the energy full-width at half maximum (FWHM), the focal spot FWHM and beam divergence. The user has to fine-tune the default values of above parameters provided in PRIMO, until the best match between simulated and physical measurements is achieved. The tuning of initial simulation parameters for the 6 MV photon beam model of Clinac®iX and its validation against measurements in a homogeneous phantom has been described in detail previously.[Reference Sarin, Bindhu, Saju and Nair33] The above validated PSF of 6 MV photon beam was used for all simulations performed in this study.
This study uses the following default values of transport parameters[Reference Brualla30] (fine-tuned by PRIMO’s authors): C1 = C2 = 0·1, where C1 and C2 control the cut-off for elastic collisions; WCC = 200 KeV and WCR = 200 KeV, where WCC and WCR are the cut-off values for inelastic collisions and bremsstrahlung interactions, respectively. The cut-off energies for electrons, positrons and photons are set to Eabs (e−) = Eabs (e+) = 200 KeV and Eabs (ph) = 50 KeV.
The PSF above moveable jaws was linked to each plan simulation. The simulation of the patient-dependent parts (movable jaws, MLC and patient CT) was subsequently carried out using the above PSF as the radiation source. The fast MC algorithm DPM was used for the simulation inside the patient geometry. An optimum value of the splitting factor between 100 and 300 must be found in an iterative process to apply simple splitting in the water phantom or the CT images. The user has no control over some of the variance reduction techniques applied automatically in the simulation process. The simulations were performed on a Dell Precision T5600 CPU with 32 GB of RAM and 24 CPU cores with 2·0 GHz speed.
Prior to simulation in patients or phantoms, a voxelised simulation geometry was generated in PRIMO. The geometry consists of a set of material and mass density value pairs. The CT number-to-mass density conversion curve and material assignment library available in PRIMO are used to define the material type and mass density for each voxel. To create a voxelised geometry, a set of six materials, air, lung International Commission on Radiological Protection (ICRP), adipose tissue, muscle-skeletal, cartilage and compact bone are assigned to the voxels based on their density and the CT number.
The MC simulated dose values from eV/g were converted to Gray (Gy). The dose (D) in Gy, for a single fraction of a treatment plan is calculated using Equation 2.[Reference Brualla30] The dose must be measured in reference conditions using an appropriate detector to perform the dose calibration.[Reference Popescu, Shaw, Zavgorodni and Beckham34] The dose for a 10 × 10 cm2 field at a reference depth of 10 cm in a 30 cm × 30 cm × 30 cm water phantom was measured with FC-65® 0·6 cc ion chamber (IBA Dosimetry GmbH, Germany). The source to surface distance (SSD) was 100 cm. The MC simulation of the same setup was performed in PRIMO in a virtual water phantom, and the dose in the central bin at the reference depth was determined.
 $$D = {{D_{meas}^{ref}} \over {D_{MC}^{ref}}}{{MU} \over {M{U^{ref}}}}{D_{MC}}$$
where D is the absolute dose in Gray.
 $D_{meas}^{ref}$
is the dose in Gy measured in reference conditions (100 cm SSD, 10 × 10 cm2 field size, 10 cm depth) in a water phantom.
 $M{U^{ref}}is$
the reference monitor units used to obtain the measured reference dose.
 $D_{MC}^{ref}$
is the dose estimated by MC simulation (in eV/g per history) in reference conditions.
 ${D_{MC}}$
is the simulated dose (in eV/g per history) for the single fraction of a treatment plan, and MU is the total monitor unit for the single fraction.
Phantom-based validation of TPS algorithms
Slab phantom
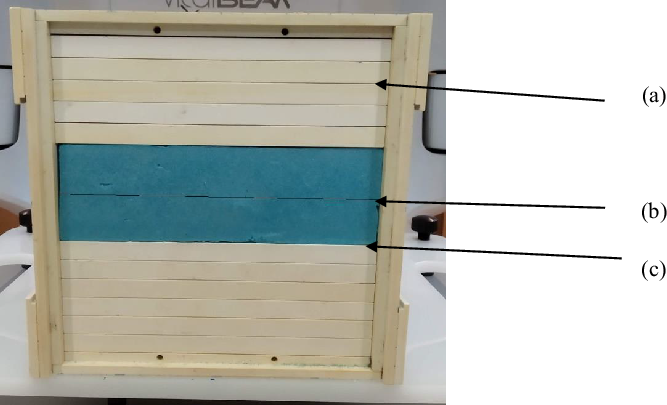
As shown in Figure 2, a multi-slab phantom was constructed by sandwiching a lung-equivalent polystyrene block (densities 0·021–0·028 g/cc) between tissue-equivalent RW3 slabs (IBA Dosimetry GmbH, Germany) of density 1·045 g/cc. The dose calculations were performed in TPS for 500 Monitor Units (MU) using 6 MV photon beams with field sizes of 1·5 × 1·5 cm2, 3 × 3 cm2, 5 × 5 cm2 and 8 × 8 cm2 incident on the phantom surface. AAA and AXB algorithms (Version 15·6) were used for dose calculations. PRIMO simulation was performed using the beam settings and MU of the TPS plan. TPS calculated central axis depth dose curves and MC simulated depth dose curves were compared. A Gafchromic® EBT3 (Ashland Advanced Materials, USA) film was used to measure the lateral dose profile at three positions:
-
(1) Inside the tissue equivalent slab.
-
(2) Inside the lung block.
-
(3) Below the lung block at the lung–tissue interface, as shown in Figure 2.
Multi-slab phantom. (a), (b) and (c) are the locations of the Gafchromic film.

Film scanning was performed on an Epson 12000XL flatbed colour scanner. The film dosimetry was carried out per Lewis et al.’s[Reference Lewis, Micke, Yu and Chan35] ‘one-scan’ protocol. TPS and MC simulated dose profiles were compared with the lateral dose profile obtained from the film.
Lung-equivalent phantom
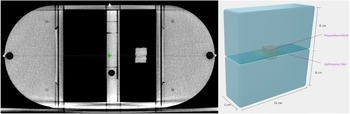
A lung phantom was built by modifying an I’mRT® phantom (IBA Dosimetry GmbH, Germany) with custom made lung equivalent inserts. Figure 3 illustrates that the lung insert was made using two styrofoam blocks (density 0·021–0·028 g/cc) measuring 16 cm × 8 cm × 5 cm each. A 2 cm× 2 cm × 2·5 cm hole was cut from the centre of the blocks and filled with polyurethane material, which simulates a cuboid-shaped tumour volume inside the lung insert. The Gafchromic film can be placed between the two blocks and through the centre of the solid tumour volume for dose measurement in this plane. Figure 3 shows the axial CT image of the phantom along with the details of the lung insert used for film dosimetry. Using Eclipse, two 3D-conformal plans and a VMAT plan were created with the beam isocentre in the film plane to deliver 2 Gy to the central target volume. One plan had the anterior and posterior beam (AP-PA) of field size 3 × 3cm2, and the other had the anterior, posterior and lateral beam (3-FLD) with field size 3 × 3 cm2. The VMAT plan consists of two 180°-arcs in clockwise and counterclockwise directions. MC simulation of the above plans was carried out with PRIMO. The film was used to measure the planar dose distribution in the coronal plane at the isocentre. The analysis of film dose against TPS and MC dose distributions was carried out using FilmQA Pro software (Ashland Advanced Materials, USA). Dose distributions were compared using the local gamma analysis[Reference Low, Harms, Mutic and Purdy36] method with 3%, 3 mm acceptance criteria.
Axial CT view of the lung-equivalent phantom with film dosimetry insert (left).

MC evaluation of clinical plans
Patients with medically inoperable early-stage small-sized lung tumours were treated with SBRT. For this study, the VMAT plans of ten SBRT cases treated at our centre were evaluated, out of which four tumours were centrally located and six were peripherally located. The Planning Target Volume (PTV) volume ranged from 45 cm3 to 65 cm3. Each plan consists of two coplanar and two non-coplanar beams of 6 MV photons. The dose prescription was 48 Gy in four fractions. The prescription and dose constraints for PTV and Organ At Risk (OARs) were based on RTOG 0813[Reference Bezjak, Papiez and Bradley37] and RTOG 0915[Reference Videtic, Hu and Singh38] criteria. MC calculations were performed using the VMAT plan, CT images and structures imported into PRIMO. The particle splitting variance-reduction technique was applied in the simulation of patient geometry. Simulation was repeated without splitting factor for an SBRT case for comparison.
A DVH-based comparison was made between TPS algorithms and MC simulated plans for PTV and OARs. The 3D-dose distributions were compared using the gamma analysis method with an acceptance criterion of 2%, 2 mm. The percentage of the difference was calculated according to equation 3.
 $$\% {\rm{Difference}} = \;{{\left( {TPS\;dose - PRIMO\;dose} \right)\; \times \;100\% } \over {TPS\;dose}}.$$
DVH-based plan comparison
The DVH based plan comparison was made for the following dosimetric parameters:
-
(1) Mean dose to the PTV (PTVmean), Heart (HEARTmean) and lungs (LUNGSmean).
-
(2) Maximum dose (dose to 0·03 cm3) to the PTV (PTVmax) and spinal cord (SPINEmax).
-
(3) The dose received by 95% of the PTV (PTV D95%).
-
(4) Total lung volume receiving doses of 20 Gy (LUNGS V20).
The Radiation Therapy Oncology Group (RTOG) conformity index (CI RTOG)[Reference Feuvret, Noël, Mazeron and Bey39] and Paddick’s gradient index (GI Paddick)[Reference Paddick and Lippitz40] were also used for comparison.
The CIRTOG was calculated using Equation 4.
 $$C{I_{RTOG}} = {{Total\;volume\;of\;tissue\;receiving\;the\;prescribed\;dose} \over {Volume\;of\;PTV\;receiving\;the\;prescribed\;dose}}$$
The GI Paddick was calculated using Equation 5.
 $$G{I_{Paddick}} = {{Volume\;of\;tissue\;receiving\;50\% \;\;isodose} \over {Volume\;of\;PTV}}$$
A CIRTOG value near to 1 indicates good target conformity. A small value of GIPaddick indicates a steeper dose fall-off outside the PTV.
The results were presented as mean ± standard deviation (SD). A normality test was conducted on the data to verify the appropriateness of the statistical tests for the analysis. A two-tailed Wilcoxon signed-rank test was conducted using SPSS 20·0 (IBM, Armonk, NY, USA) to determine the difference between the two plans. The difference was considered statistically significant with a p-value <0·05.
Results
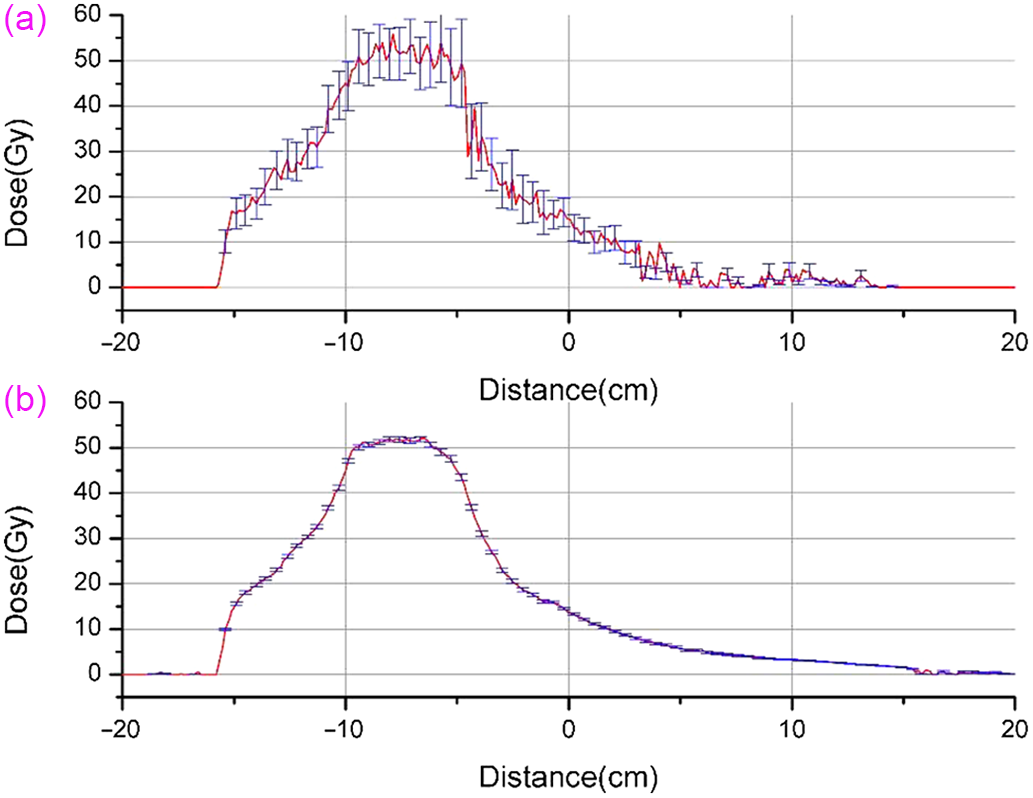
Simulations were run for 5 × 10⁸ histories. For the validated PSF, the average statistical uncertainty reported by PRIMO at two standard deviations (±2σ) was 0·98%. In phantom and patient geometries, a splitting factor of 300 was sufficient to obtain a statistical uncertainty of around 1%. In all SBRT cases, the standard statistical uncertainty (±2σ) of the obtained dose distributions was less than 1·50% (0·9% −1·44%). The simulation time depends on the beam size, the number of beams and the number of control points for each case. The simulation time for obtaining the above uncertainty varies between 3·5 and 4·5 h. Figure 4 compares the lateral dose profile through the centre of the target volume for an SBRT simulation with and without applying the splitting factor. In this case, the average uncertainty obtained with and without the splitting factor was 1·2% and 10·1%, respectively.
Lateral dose profile through the centre of the target. (a) Without splitting factor and (b) with splitting factor. Error bars show the uncertainty in MC simulation (±2σ).

Multi-slab phantom analysis
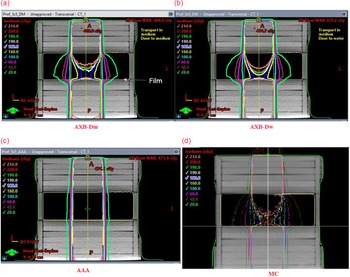
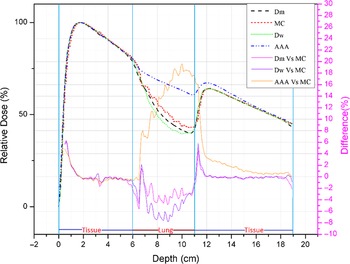
Figure 5 illustrates the isodose lines for the dose distribution obtained using three TPS algorithms, AAA, AXB-Dm and AXB-Dw, and the dose distribution obtained with MC simulation for a 5 × 5 cm2 6 MV photon beam incident on the phantom surface. The figure shows that the dose falls more rapidly inside the lung insert for AXB-Dm, AXB-Dw and MC compared to AAA. Higher lateral scatter contributions have been observed within the lung equivalent slab for AXB and MC, and they were absent in AAA calculations. When AAA was compared to MC in the lung equivalent slab, PDD was overestimated by up to 38%, 28%, 19% and 10% for 1·5 × ×1·5 cm2, 3 × 3 cm2, 5 × 5 cm2 and 8 × 8 cm2 fields, respectively. For the above field sizes, AXB-Dm underestimated the PDD by up to 5%, and AXB-Dw underestimated the PDD by up to 8% in the lung insert. Figure 6 shows the percentage depth dose (PDD) for TPS and MC distributions for the 5 × 5 cm2 field along the central axis.
A plane along the central axis of the slab-phantom showing isodose lines obtained with (a) AXB-Dm, (b) AXB-Dw, (c) AAA, (d) MC for 5 × 5 cm2 6 MV photon beam incident on the phantom surface. The position of the Gafchromic film is also shown.

A comparison of percentage depth dose along the central axis of the slab-phantom for TPS algorithms and MC. The difference curve is also shown for comparison.

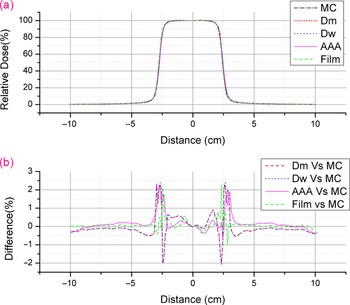
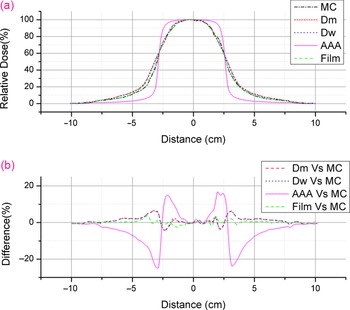
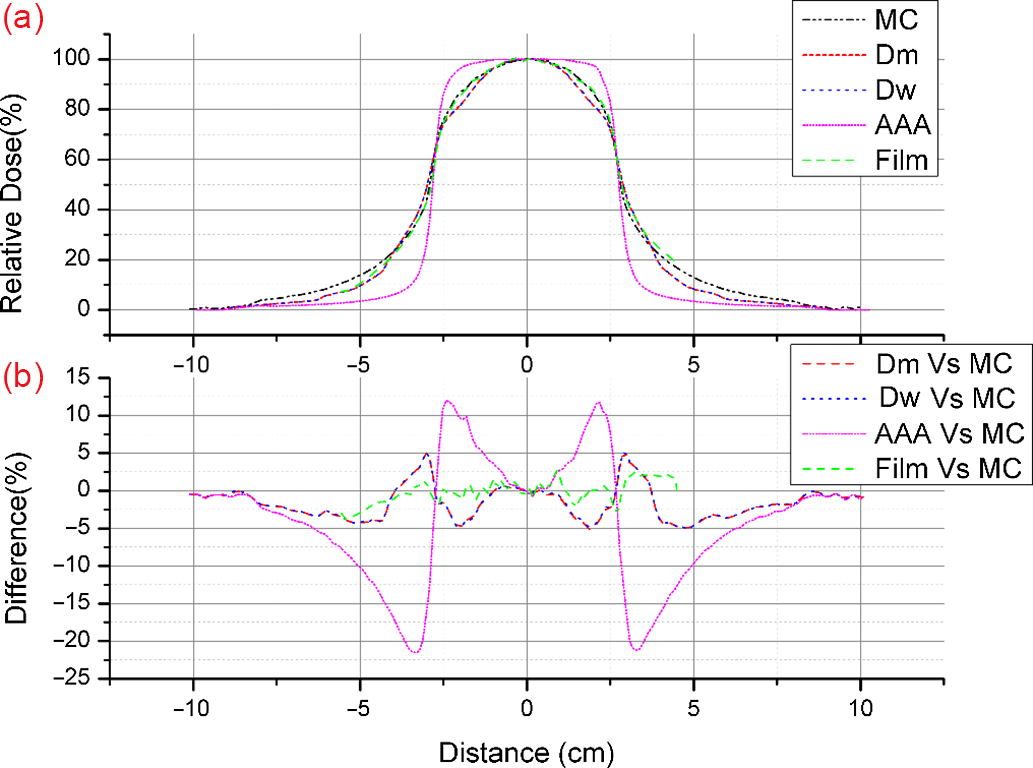
In Figures 7–9, the lateral dose profiles are compared in the tissue equivalent slab, in the middle of the lung block and below the lung block, respectively. Figure 7 shows that in the tissue-equivalents slab, MC/Film and TPS calculations agree within 2·5%. When the field edge approaches from central axis, Figures 8 and 9 show that AAA overestimates the dose inside the field edges and underestimates the dose outside the field edges compared to MC, film measurements and AXB. Comparing AAA calculations to MC for the 5 × 5 cm2 field, the figures show a dose overestimation of up to 15% inside the field edges and a dose underestimation of up to 25% outside the field edges. The dose profile measured with the film agrees within 3% with MC. With respect to MC, the calculated dose profiles for AXB-Dm and AXB-Dw show an underestimation of up to 6% inside the field edges and an overestimation of up to 6% outside the field edges.
(a) Comparison of lateral dose profiles in the tissue-equivalent slab. (b) Percentage difference curve with respect to MC.

(a) Comparison of lateral dose profiles in the middle of the lung block. (b) Percentage difference curve with respect to MC.

(a) Comparison of lateral dose profiles at the lung–tissue interface in the slab-phantom. (b) Percentage difference curve with respect to MC.

Film analysis
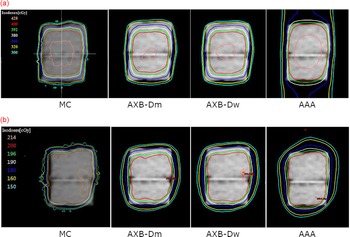
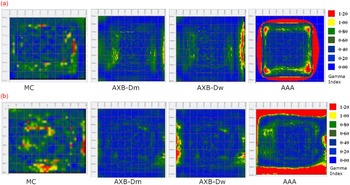
Figure 10 compares the dose distributions obtained from TPS algorithms and MC for the AP-PA and arc plan in the isocentre plane. As shown in the figure, AAA overestimates the dose in the peripheral areas of the target volume compared to AXB and MC. Table 1 shows the average 2D gamma pass rate obtained with TPS algorithms and MC simulation against film measurements. AXB-Dm, AXB-Dw and MC show a gamma pass rate greater than 95% for all the three plans. AAA shows a lower pass rate, and the maximum pass rate obtained with AAA was 76·6% for the arc plan. Gamma maps from the FilmQA Pro analysis of AP-PA and arc plans are shown in Figure 11. The colour scale in the figure indicates the variation in the gamma index, which ranges from 0 to 1·2. In gamma analysis, a value γ ≤ 1 indicates a pass. In the figure, the red pixels indicate the failed area.
A comparison of the axial dose distributions between MC and TPS for the (a) AP-PA plans and (b) Arc plans at the isocentre plane of the lung phantom.

Gamma pass rate for TPS algorithms and MC simulations against film measurements

Gamma analysis map for the film dosimetry in the lung phantom. The top row (a) shows the analysis results for the AP-PA plan, and the bottom row (b) shows the analysis results for the Arc plan.

Validation of lung SBRT plans
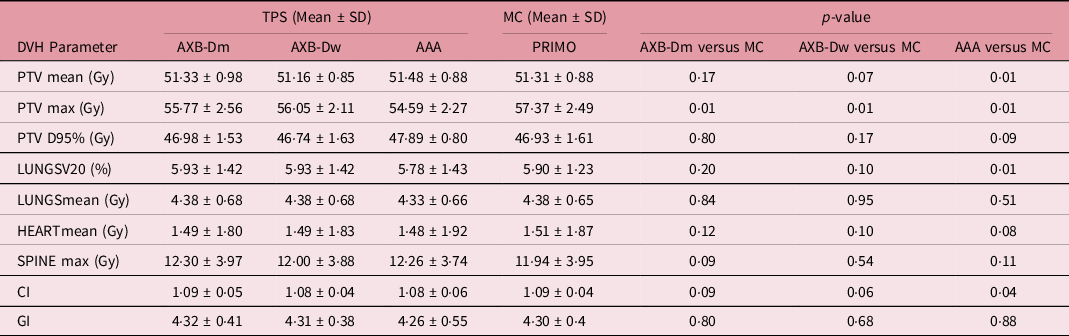
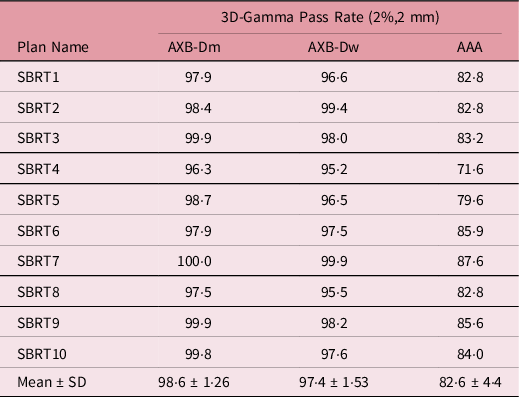
Table 2 shows the results of the DVH comparison between the MC and TPS algorithms for clinical plan validation. For AXB-Dm and AXB-Dw, no statistically significant difference was observed in the PTV DVH parameters PTVmean, PTV D95, CI and GI and OAR DVH parameters LUNGS V20, LUNGS mean dose and SPINE max dose. For AXB-Dm and AXB-Dw, a significant difference was observed in PTVmax dose. A significant difference between AAA and MC was observed for DVH parameters, PTVmean, PTVmax, CI and LUNGS V20. No significant difference was observed for PTV D95, GI, LUNGS mean and SPINE max doses. Figure 12 shows DVH curve comparing PRIMO and TPS for a lung SBRT plan. The curve shows AAA’s deviation from MC and AXB for the PTV. The gamma analysis for the comparison of TPS algorithms against MC for the PTV structure is given in Table 3.
Comparison of the DVH parameters between PRIMO MC simulation and TPS algorithms

DVH comparison between TPS algorithms and MC for a lung SBRT plan.

The gamma pass percentage for TPS algorithms compared with MC

Discussion
As a numerical solution to the linear Boltzmann transport equation (LBTE), AXB claims to be equally accurate in heterogeneous media as MC methods. In contrast to the stochastic method used in MC, AXB calculations are free of statistical noise. AXB and MC calculations may differ due to differences in the material assignment and the generation of the voxelised calculation geometry. Several factors could contribute to the difference, including the approximations used for the deterministic solution of the Boltzmann equation and the differences between the Eclipse beam model and the MC simulated model.
In comparing depth dose curves inside the multi-slab phantom, AXB and MC showed a sharper fall inside the low-density medium compared to AAA. This result matches the findings of Bush et al.,[Reference Bush, Gagne, Zavgorodni, Ansbacher and Beckham14] where AXB and MC showed a much sharper fall in low-density lung media. Since the lung-equivalent material used in this study differs from that used in previously published studies,[Reference Han, Mikell, Salehpour and Mourtada11,Reference Bush, Gagne, Zavgorodni, Ansbacher and Beckham14,Reference Tsuruta, Nakata and Nakamura19,Reference Alhakeem, AlShaikh, Rosenfeld and Zavgorodni41] the percentage difference in PDD and profile values cannot be compared directly. They have reported differences of up to 2% in low-density lungs and 5%–10% in the air between AXB and MC, up to 12% in low-density lungs and 5%–45% in the air between AAA and MC. Failla et al.[Reference Failla, Wareing, Archambault and Thompson6] and Han et al.[Reference Han, Mikell, Salehpour and Mourtada8] also reported similar results of better agreement between AXB and MC and the significant dose deviation with AAA in the low-density lung region. The wider lateral scatter contribution observed with AXB calculations inside the lung slab (Figure 5) agrees with MC distributions. The broadening (Figure 5) was not observed in AAA calculations because the increased lateral motion of electrons in the low-density medium and the lateral loss of transient charged particle equilibrium at the field edges are not accounted by AAA.
Figures 8 and 9 show a sharper fall of the AXB and MC estimated dose when approaching the field edge. AAA shows dose overestimation when the field edge is approached and a sharper fall of the dose outside the field edge compared to film measurements, AXB and MC. Similar results were published by Fogliata et al.,[Reference Fogliata, Nicolini, Clivio, Vanetti and Cozzi16] comparing AXB and AAA calculations in the low-density lung zone with MC simulations. In comparing isodose distributions obtained with TPS algorithms and MC in the lung phantom (Figure 10), as the tumour edge is approached, a sharper fall of the Acuros and MC estimated dose is seen inside the tumour area compared to AAA. This is similar to the result obtained with the film analysis in slab phantom (Figures 8 and 9). A similar result of overestimated PTV coverage of AAA compared to MC and AXB has been reported by Tsuruta et al.[Reference Tsuruta, Nakata and Nakamura19] Based on 2D gamma pass rates obtained with the Gafchromic film (Table 1), AXB and MC agree well with film measurements. The AAA shows a lower pass rate against film measurements. The gamma map (Figure 11) shows that the primary source of disagreement between film measurements and AAA calculations was the failed pixels near the field edges.
For clinical lung SBRT plans, the AXB-Dm algorithm and AXB-Dw algorithm showed good agreement for the PTV and OARs DVH parameters against MC, except for the PTVmax dose. Gamma pass rate above 95% was obtained between AXB and MC for all the SBRT plans. The AXB-Dm showed slightly better agreement with MC than the AXB-Dw. A similar result showing good agreement between AXB and PRIMO MC simulation has been reported by Reggiori et al.[Reference Reggiori, Stravato and Paganini42] and by Rodriguez et al.[Reference Rodriguez and Brualla32] The observed difference in maximum doses to PTV might be due to the differences in material assignments and the statistical noise associated with MC simulations.[Reference Bush, Gagne, Zavgorodni, Ansbacher and Beckham14] Because of the statistical noise associated with MC simulations, Ojala et al.[Reference Ojala and Kapanen4] suggest avoiding point doses in the dose distribution analysis.
The AAA calculation shows significant deviations with MC for the DVH parameters PTVmax, PTVmean and CI. The LUNGS V20 dose showed significant variation with MC in OARs. 3D gamma analysis against MC showed a lower pass rate for the AAA algorithm than AXB. Previous studies comparing AAA and AXB calculations for lung SBRT plans showed similar results. Mampuya et al.[Reference Mampuya, Matsuo and Nakamura43] and Tsuruta et al.[Reference Tsuruta, Nakata and Nakamura19] reported a better match between AXB and MC than AAA and MC in lung SBRT patients.
Conclusion
According to the study, the dosimetric accuracy of AXB was closer to MC/film measurements than AAA in the low-density lung medium. There is a significant difference between AAA calculations and MC/film measurements in the low-density lung region and at the tissue–lung interfaces. Most of the differences are found around the edges of the target, where AAA overestimates the dose compared to Acuros and MC. This may be due to the incapability of the AAA algorithm to model the increased lateral scatter phenomena in low-density materials. So, type ‘c’ algorithms such as Acuros or MC should be considered when calculating lung treatment plans. This study supports previously published dosimetric comparisons and clinical validations of AAA and Acuros in stereotactic radiotherapy of lung tumours.[Reference Bush, Gagne, Zavgorodni, Ansbacher and Beckham14,Reference Fogliata, Nicolini, Clivio, Vanetti and Cozzi16,Reference Tsuruta, Nakata and Nakamura19]
Financial Support
This research did not receive any specific grant from funding agencies.
Conflicts of Interest
We wish to confirm that there are no known conflicts of interest associated with this publication.