There is little doubt that mass media play a central role in representative democracy. Mass media are essential to a well-functioning representative democracy in large part because they facilitate accountability. Without a public that is at least partly informed about what government is doing, it is not clear how large-scale representative democracy can work.
It is of some significance, then, that the United States is witnessing increasing public and professional consternation about limitations to journalists’ access to information and to their protection through libel laws. This concern has been driven in large part by the belief that the current administration is seeking to change the relationship between the White House and the press corps. Footnote 1 Similar concerns are readily evident elsewhere too, most recently in Poland, Turkey, and Hungary. A cross-national analysis of these effects on press freedoms seems especially timely.
Our perspective on the issue is motivated by the existing literature on thermostatic public responsiveness to policy. Past work (reviewed later) has found evidence of such responsiveness in some policy domains and countries, and it also highlights real variation across policy domains and institutional arrangements. Our aim is to add media freedoms to the list of institutional factors that enhance or constrain public responsiveness to policy. Representative democracy requires not merely a mass media, but one that is sufficiently free to act as an effective fourth estate. Independent media should enhance public responsiveness to policy; government-constrained media should impede it.
We examine this possibility below. To begin, we review the literatures on public responsiveness to government actions, particularly work on the thermostatic relationship between policy and preferences. We also look at the role of media in representative democracy. We then turn to an analysis of a new dataset capturing relative preferences for spending across 35 countries, merged with data on government spending and press freedoms for 24 of those countries. We find some evidence of the expected relationship between media freedom and public responsiveness. In countries where press freedom is high, there is evidence of thermostatic public responsiveness; in countries where press freedom is low, citizens appear less able to notice and respond to government policy. These results suggest a consequential role for mass media in representative democracy, one that has been often discussed but rarely subjected to empirical testing. We regard this as a notable and timely result, with potentially important implications for the current state of affairs both in the United States and other nations.
On Public Responsiveness
Representative democracy depends on an informed public; it is necessary to hold governments accountable, the primary mechanism for incentivizing effective representation. There is accordingly a large body of work that focuses on, and often has found evidence of, public response to government actions. Stimson’s (Reference Stimson1999) characterization of the public’s “policy mood” actually implies negative feedback when policy moves outside a “zone of acquiescence” (also see Erikson, MacKuen, and Stimson Reference Erikson, MacKuen and Stimson2002). Subsequent analysis by Durr (Reference Durr1993) reveals this change in public mood in response to policy alongside a systematic pro-cyclical impact of macroeconomic evaluations. Page and Shapiro’s (Reference Page and Shapiro1992) classic research on aggregate opinion trends across domains demonstrates “rational” patterns, including connections to economic and policy change.
This work has much in common with the literature on thermostatic public responsiveness (see, for example, Eichenberg and Stoll Reference Eichenberg and Stoll.2003; Erikson, MacKuen, and Stimson Reference Erikson, MacKuen and Stimson2002; Jennings Reference Jennings2009; Jennings and John Reference Jennings and John2009; Pacheco Reference Pacheco2013; Page and Shapiro Reference Page and Shapiro1992; Soroka and Wlezien Reference Soroka and Wlezien.2010; Stimson, MacKuen, and Erikson Reference Stimson, Mackuen and Erikson1995; Wlezien Reference Wlezien1995, Reference Wlezien2004). The basic thermostatic model is straightforward, wherein the public’s preference for “more” policy—its relative preference—represents the difference between the public’s preferred level of policy and the level it actually gets. If the public is informed about policy, the public will adjust its preferences accordingly, signaling support for more (less) policy when the policy “temperature” is too low (high).
The typical conception of the thermostatic model views the relationship as unfolding through time; the public’s relative preferences change when either its preferred level of policy or policy itself changes, unless of course those changes cancel out. Although there is a great deal of research using the thermostatic model in longitudinal analyses, the model also applies across space, as has been shown in past work comparing states and countries (Goggin and Wlezien Reference Goggin, Wlezien and Goggin1993; Wlezien and Soroka Reference Wlezien and Soroka2012). Similar to the over-time model, preferences for more or less policy in each place depend on whether and the extent to which the public’s preferred level is greater than policy itself in the different contexts. This cross-unit variation is critical to the analysis that follows. Footnote 2
As noted earlier, effective representative democracy depends on a public that is at least minimally informed and at least partly responsive to policy produced by governments. In the absence of thermostatic responsiveness, it is not clear that governments would seek to represent public opinion: not only would expressed opinion be ill informed and so of limited use to policy makers, but also the public would be incapable of holding governments accountable for their actions. Footnote 3 It is of some significance, then, that the literature cited earlier finds evidence of thermostatic responsiveness across a range of countries and domains.
That said, the degree to which thermostatic responsiveness characterizes measured opinion–policy relationships varies widely across publics, policy domains, and political institutions. This is in large part because policy is not always clear: citizens do not always know about past and recent changes in policy. There are several reasons why we might expect that to be the case. First and foremost is issue salience. How much the public cares about and is attentive to an issue influences the demand for policy information, which presumably also influences the supply. An increased supply of information, in turn, augments the degree to which a public is informed about a policy domain. It thus makes sense that past work finds limited public responsiveness in low-salience domains (Soroka and Wlezien Reference Soroka and Wlezien.2010; Wlezien Reference Wlezien1995, Reference Wlezien2004; see also related work by Burstein Reference Burstein2013). Second, government institutions matter. For instance, federalism appears to be of special importance. It influences not the quantity of information but its quality, particularly insofar as multiple levels of government are involved in the same policy areas. When various layers are involved in policy making, the policy “signal” sent to the public is more complicated, and public responsiveness can be muted accordingly (Pacheco Reference Pacheco2013; Soroka and Wlezien Reference Soroka and Wlezien.2010; Wlezien and Soroka Reference Wlezien and Soroka2011, Reference Wlezien and Soroka2012).
In sum, public responsiveness depends on a sufficiently large stream of accurate information about what governments are doing in policy domains that matter to the public. Although past work has focused on the role that political institutions play in providing information to voters, research exploring public responsiveness has dealt with mass media only in passing, with two notable exceptions: Neuner, Soroka, and Wlezien (Reference Neuner, Soroka and Wlezien2019) and Williams and Schoonvelde (Reference Williams and Schoonvelde.2018). This is true despite (1) the fact that public responsiveness to policy—which is often well beyond citizens’ own personal experiences—almost certainly must rely, at least in part, on mass-mediated information; (2) the long-standing and vast literature arguing for the importance of mass media in representative democracy (for example, Iyengar and Kinder Reference Iyengar and Kinder2010; McQuail Reference McQuail1997; and see citations in the section that follows); and (3) growing concern about press freedoms in the United States and elsewhere.
The Role of Mass Media
What is required of mass media in order for it to facilitate public responsiveness to policy? One requirement is that media coverage includes a sufficient amount of information about policy. Existing work indicates a relatively high frequency of policy-related stories in US newspapers (Boydstun Reference Boydstun2013), and there is a surprisingly large number of cues about the direction of policy change, at least in some domains (Neuner, Soroka, and Wlezien Reference Neuner, Soroka and Wlezien2019). Williams and Schoonvelde’s (Reference Williams and Schoonvelde.2018) recent work also highlights issue salience in media coverage as a critical precursor of public responsiveness in the United States. Their findings fit with work suggesting that people can and do learn about policy when there is sufficient media coverage (Barabas and Jerit Reference Barabas and Jerit2009), with research that finds some areas in which the public actually has relatively high levels of policy-specific knowledge (Delli Carpini, Keeter, and Webb Reference Carpini, Michael, Scott, Webb and Norris1997), and with evidence that information-rich environments tend to reduce the knowledge gap between the information-rich and the information-poor (Fraile Reference Fraile2013).
We focus here on a different but related concern about mass media, one that is higher up the causal chain: freedom of the press. Limitations on the press may constrain both the availability and accuracy of information about government policy. Mass media may be less able to report on policy, either because of restrictions on access to information or publication constraints that limit the amount of information available to citizens. An unfree press or media (we use the terms interchangeably here) might alternatively provide a good deal of policy information, but the accuracy of that information may be more suspect. Either way, it makes sense that research suggests that political knowledge increases alongside freedom of the press. We know that media coverage can inform citizens about policy (Neuner, Soroka, and Wlezien Reference Neuner, Soroka and Wlezien2019), and there is a well-established literature on the role that a free press plays in informing citizens and holding government accountable (Besley and Prat Reference Besley and Prat2006; Coyne and Leeson Reference Coyne and Leeson2004; Leeson and Coyne Reference Leeson and Coyne2007; Mulgan Reference Mulgan2003; Norris Reference Norris2006).
To be clear, we do not argue that press limitations are the only or even most serious threat to effective journalism. There are reasons to suspect that the changing economic models of press outlets pose a very serious challenge to the free flow of information, even (or perhaps especially) in countries with ostensibly high freedom of the press. We also acknowledge that press coverage of policy issues will be imperfect in a number of ways that may be entirely independent of limits on freedom of the press. Media coverage is also necessarily a sample, and so it contains the error associated with sampling. Indeed, vast literatures chronicle a range of systematic biases in news coverage (Altheide Reference Altheide1997; Bennett, Lawrence, and Livingston Reference Bennett, Lawrence and Livingston2008; Dalen, de Vreese, and Albæk Reference Dalen, de Vreese and Albæk2015; Groeling Reference Groeling2013; Meyrowitz Reference Meyrowitz1994; Patterson Reference Patterson1994; Shoemaker and Vos Reference Shoemaker and Vos.2009; Soroka Reference Soroka2012) and a dearth of information about policy (Lawrence Reference Lawrence2000), particularly on complex scientific issues (for example, Friedman, Dunwoody, and Rogers Reference Friedman, Dunwoody and Rogers1999; Stocking and Holstein Reference Stocking and Holstein2008). We nevertheless think that governmentally imposed constraints on the flow and accuracy of information can be critically important, both within and outside representative democracies.
In sum, drawing on past work highlighting the importance of a free press to representative democracy, as well as recent concerns about press freedoms, we explore in this article the possibility that thermostatic responsiveness to policy is contingent on a robust, free media. Put succinctly, we suggest that more controls on press freedoms will be associated with less accurate (and perhaps also less frequent) signals about policy change; that this will make it more difficult for citizens to hold informed opinions; and consequently, that it will be more difficult for citizens to hold their governments accountable. It is our expectation that thermostatic responsiveness will be greatest in an environment with few press limits. Conversely, increased controls on the press will lead to muted thermostatic responsiveness.
Data
Our analyses focus on the final (June 2018) release of Wave 4 of the Comparative Study of Electoral Systems (CSES), a cross-national survey that thus far includes more than 70,000 individuals in 39 countries, 24 of which are included in the analyses that follow. Footnote 4 The survey was administered between 2011 and 2016 through a collaboration between the Center for Political Studies at the University of Michigan and the GESIS–Leibniz Institute for the Social Sciences. CSES Wave 4 data are unique in that they include a series of questions on respondents’ preferences for change in government spending. These questions are vital to our inquiry, and they are not, to our knowledge, included in any other cross-national dataset of similar size and scope. Respondents are asked,
For the next questions, please say whether you would like to see more or less government expenditure in each of the following areas: Health, Education, Unemployment Benefits, Defense, Old-Age Pensions, Business and Industry, Policy and Law Enforcement, and Welfare Benefits. Remember if you say “more” it could require a tax increase, or “less,” it could require a reduction in those government services.
The response categories are as follows: Much more than now, Somewhat more than now, The same as now, Somewhat less than now, and Much less than now.
The CSES interviewer instructions include descriptions of each domain of spending and are provided to clarify the questions for respondents (refer to the Supplementary Appendix for the full question wording). Responses are recoded from −2 to +2, where low values indicate support for less spending, high values indicate support for more spending, and zero indicates support for the “same as now.”
We focus first on the welfare domain, both because of past work that finds strong public responsiveness in this domain and the availability of relevant and reliable spending data (see the later discussion). Our individual-level models include the following demographic variables: gender (binary, where female = 1), age (in years), and education (binary, where some university or more = 1). Respondent income is not asked in all countries, so we rely on a different question asking how likely it is that respondents’ standard of living will improve in the next 10 years. Responses range on a 4-item scale from “very likely” to “very unlikely.” We rescale responses from 0–1, where 1 is “very likely,” and the mean is 0.50. Insofar as demographics are related to preferences for welfare spending, we regard them as (partial) proxies for people’s underlying preferred levels of spending. We have the same view of the standard-of-living measure, and we expect that those who are less well off will, ceteris paribus, be more supportive of welfare spending (Cook and Barrett Reference Cook and Barrett1992; Hasenfeld and Rafferty Reference Hasenfeld and Rafferty1989; Page and Shapiro Reference Page and Shapiro1992).
We include several other individual-level measures intended to capture underlying preferred levels of spending in each country. First, we use respondents’ belief that government should reduce differences in income. Response options are on a 5-point scale from “strongly agree” to “strongly disagree.” We recode these responses to range from 0–1, with higher levels indicating stronger agreement; the mean for all respondents is 0.71. Second, we use the 11-point self-identified left–right ideological scale. We recognize that the variable does not clearly tap policy preferences, and, even to the extent it does, the meaning varies across countries; we therefore regard it here only as one (admittedly rough) indication of a commitment to the redistributive state. The variable is coded 0–10 (left to right). As with demographic variables, we view these variables as measures of respondents’ underlying preferences for policy; they are important controls in models that seek to identify the impact of spending on preferences.
We add to these individual-level data a number of country-level variables. First and foremost is our measure of government spending, drawn from the Organisation for Economic Co-operation and Development’s (OECD) Social Expenditure (SOCX) database. That database includes indicators of social spending as a percent of GDP for 25 of the 39 countries in Wave 4 of the CSES. Our analysis of welfare relies not on total social spending, which includes health, pensions, unemployment, for example, but rather on what the OECD terms “other” spending: the subdomain in the SOCX database that captures most social assistance and welfare programs. Footnote 5 To account for the fact that the election studies are in the field in different years and at different times within years, we take the following approach: if an election study occurs in the first four months of the year, we use the previous year’s spending; if the study takes place after April, we use the current year’s spending. There are five countries whose inclusion depends on an additional lag in spending, because subdomain spending data are not yet available for all countries after 2013. We thus use an additional lag for the following countries: Finland, Great Britain, Portugal, Sweden, and Turkey. This is not ideal, because preferences may adjust quickly in response to spending, even within a year (see Soroka and Wlezien Reference Soroka and Wlezien.2010). That said, diagnostic models suggest that using one-year lags for all countries does not fundamentally change the results, which we attribute to the fact that the cross-national variance of spending is much greater than that occurring from year to year within countries.
Although we expect the variables described earlier to work as proxies for the public’s preferred levels of spending, they may not completely account for cross-national differences. To more fully capture these tendencies, we control for each country’s long-term commitment to welfare spending. This idea is that the average level of support for welfare spending will be “baked in” to the average level of spending, tapping otherwise uncontrolled-for differences in support (for example, see Brooks and Manza Reference Brooks and Manza2007). We accordingly include a measure of mean social assistance spending, based on the same domain definition described earlier and averaged from 1990 to 2006, a period well before the period for which we use current spending across all countries. (Current spending is based on the survey year, which ranges from 2010 to 2015. Refer to the Supplementary Appendix, table 5.) Note that this variable is intended to control for variation in public support across countries, not to explain it; our expectation is that there will be a positive estimated effect of long-term spending on preferences, even as current spending has a negative effect. The difference in the two coefficients is quite important for our ability to draw inferences about both effects, because they are not competing but complementary, with one tapping long-term positive effects and the other short-term negative ones.
Finally, we include measures of freedom of the press. We rely first on the annual Freedom of the Press index from the Freedom House. The index combines measures that fall into three categories: economic environment, legal environment, and political environment. Each sub-index is highly correlated with the overall measure (Pearson’s r = 0.96–0.98 in our sample), and so we rely on the total index in our analyses. Data are available for all countries in the appropriate year, depending on the timing of elections, as described earlier.
The Freedom House measure is not the only possible indicator of press limits, and given the importance of press limits for our analysis, we also consider two others. The first is from Reporters without Borders (Reporteurs San Frontiers, RSF; https://rsf.org/en/ranking), and the second is a measure combining a series of related questions about press freedom from the V-Dem dataset (from the V-Dem Institute at the University of Gothenburg, https://www.v-dem.net/en/; see Coppedge et al. Reference Coppedge, Gerring, Knutsen, Lindberg, Skaaning, Teorell, Altman, Bernhard, Steven Fish, Cornell, Dahlum, Gjerløw, Glynn, Hicken, Krusell, Lührmann, Marquardt, McMann, Mechkova, Medzihorsky, Olin, Paxton, Pemstein, Pernes, von Römer, Seim, Sigman, Staton, Stepanova, Sundström, Tzelgov, Wang, Wig, Wilson and Ziblatt2018). These measures capture different elements of media systems. The RSF index focuses more on the treatment of journalists, both domestic and foreign, than does the Freedom House index. V-Dem data we use here are based on surveys of country experts and focus more on general perceptions of press limitations, the frequency with which critiques of government are evident in media coverage, and so on. There is no single measure of press freedoms in the V-Dem data, so we take an average across the seven different items, described in detail in the Supplementary Appendix.
The Freedom House measure most directly captures laws, regulations, and access— aspects of the government–media relationship that we suspect bear most closely on the availability of accurate information. Even so, the indices are highly correlated. Figures in the Supplementary Appendix show scatterplots of all countries for which data are available for (a) the Freedom House and RSF measures, and (b) the Freedom House and V-Dem measures. Across the first pair of measures, the Pearson’s r for all countries is 0.89 and is 0.95 for the in-sample countries; across the second pair, the correlations are 0.88 and 0.80, respectively.
We thus focus our analyses on the Freedom House measure but include additional results using all measures in the Supplementary Appendix. The original Freedom House index measure ranges from 0–100, with zero representing complete press freedom. For our estimation, we rescale the index from 0–1, and to reflect the fact that it captures increasing constraints rather than freedoms, we label it Press Limits. Footnote 6
All the equations that follow are estimated using ordinary least squares (OLS), with standard errors clustered by country (see Cameron, Gelbach, and Miller Reference Cameron, Gelbach and Miller2011), where individual-level spending preferences are the dependent variable.
Freedom of the Press and Responsiveness to Welfare Spending
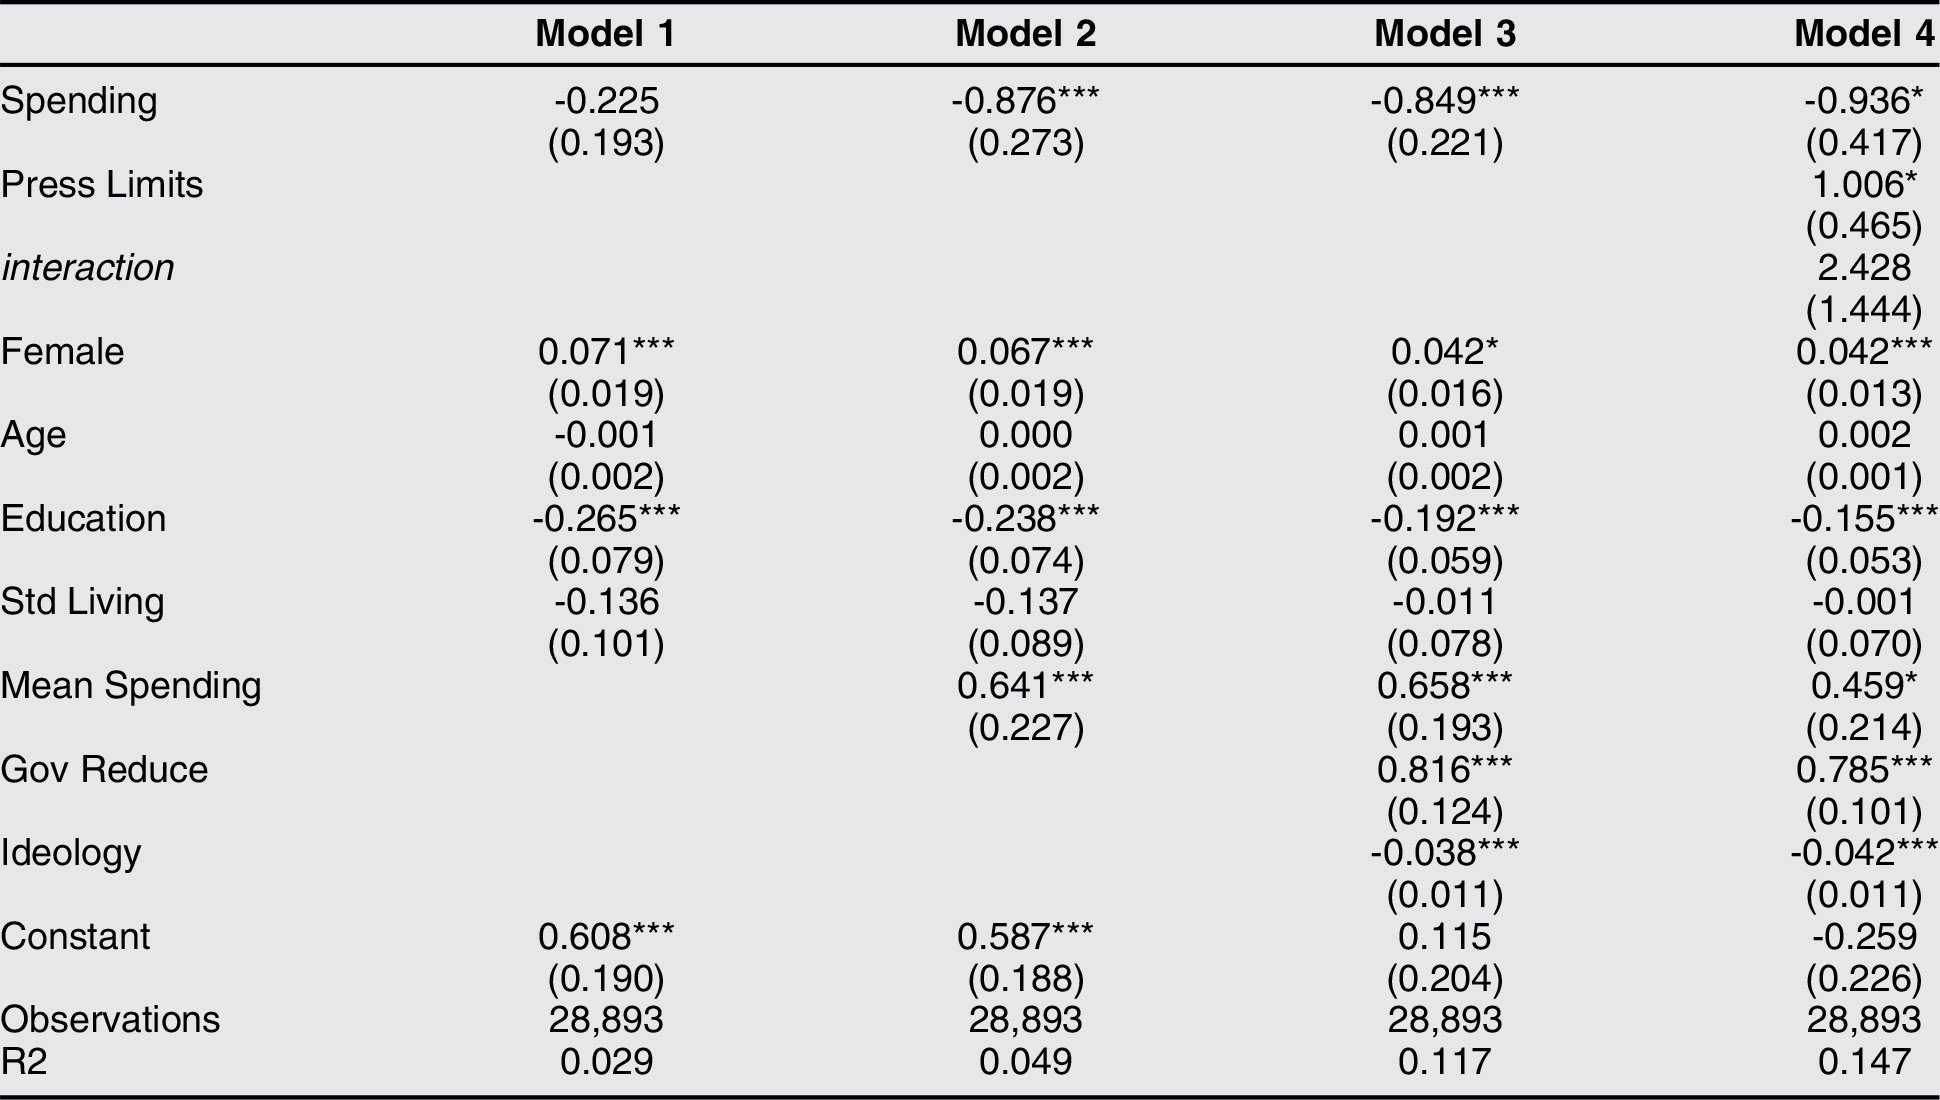
Although the CSES captures respondent preferences for a range of different policy domains, we focus on three that are both highly salient to voters and for which there are available measures of spending. We begin with welfare spending. Table 1 shows four models regressing welfare spending preferences on a basic set of demographics and our measure of country-level spending at t. Our focus here is on the coefficients in the top row of the table, which capture responsiveness to policy. The coefficient in column 1 is negative; as levels of spending increase, the demand for more spending decreases. That said, the coefficient is not statistically significant. There thus is only a hint of thermostatic responsiveness based on these results.
Modeling Relative Preferences for Welfare Spending

Note: * p <.05; ** p <.01; *** p <.001. Cells contain OLS regression coefficients with clustered standard errors (by country).
The first model in table 1 includes only demographic control variables, however. The second and third models in the table incorporate a range of other control variables: the second adds mean spending levels from 1990 to 2006, and the third model adds more proximate individual-level measures, support for the government reducing income disparities and left–right ideology. All variables have significant effects in the expected direction(s). Moreover, adding these controls reveals statistically significant (and substantial) thermostatic responsiveness to current levels of spending. Recall that our expectation is that as spending increases, public preferences for more spending should decrease, which is exactly what we observe in Models 2 and 3, where the coefficient is -0.876 and -0.849, respectively. These estimates imply that a 1-percent increase (across countries) in the welfare spending share of GDP is associated with nearly a 1-point drop in support for more spending, which is nearly 25% of the range of the variable. That said, a 1-percent difference in the spending share is substantial, because the in-sample standard deviation is 0.39. Given the coefficient in Model 3, a 0.39 increase in spending predicts a .33-point decrease in preferences, controlling for mean spending. This is a notable effect, approximately 8% of the range of preferences and 31% of its standard deviation (1.05).
Including long-term mean spending makes a big difference in table 1: controlling for it alone reveals thermostatic public responsiveness in Model 2. Recall that we view the positive effect of mean spending as an indication of the public’s long-term commitment to welfare, not a thermostatic response to policy trends, which is captured by the negative coefficient on current spending variable, per the foregoing discussion. Incorporating the individual-level covariates in Model 3 more than doubles the proportion of variance explained, but only has a trivial impact on estimated thermostatic responsiveness or the effect of long-term mean spending.
We regard results in Model 3 as striking: they demonstrate thermostatic responsiveness in a large dataset across what is, to our knowledge, the broadest and most diverse cross-national sample to date. Even so, we suspect that there is real heterogeneity in our sample, and our primary interest is in the possibility that thermostatic responsiveness is moderated by press freedoms.
This is the focus of Model 4, which adds our measure of press limits and the interaction with spending levels. We have no particular expectation about the direct effect of press limits, but we hypothesize that the interaction will be positive, reducing estimated thermostatic responsiveness. This is roughly what we observe. The coefficient for spending (-0.936) now captures the magnitude of responsiveness when there are no press limits; that is, when that measure is equal to 0 and thus is larger in magnitude than in previous models. The coefficient on the interaction (2.428) also points to the possibility that, as expected, responsiveness is reduced as we introduce press limits. That said, the coefficient for the interaction narrowly misses standard levels of statistical significance (p =.107).
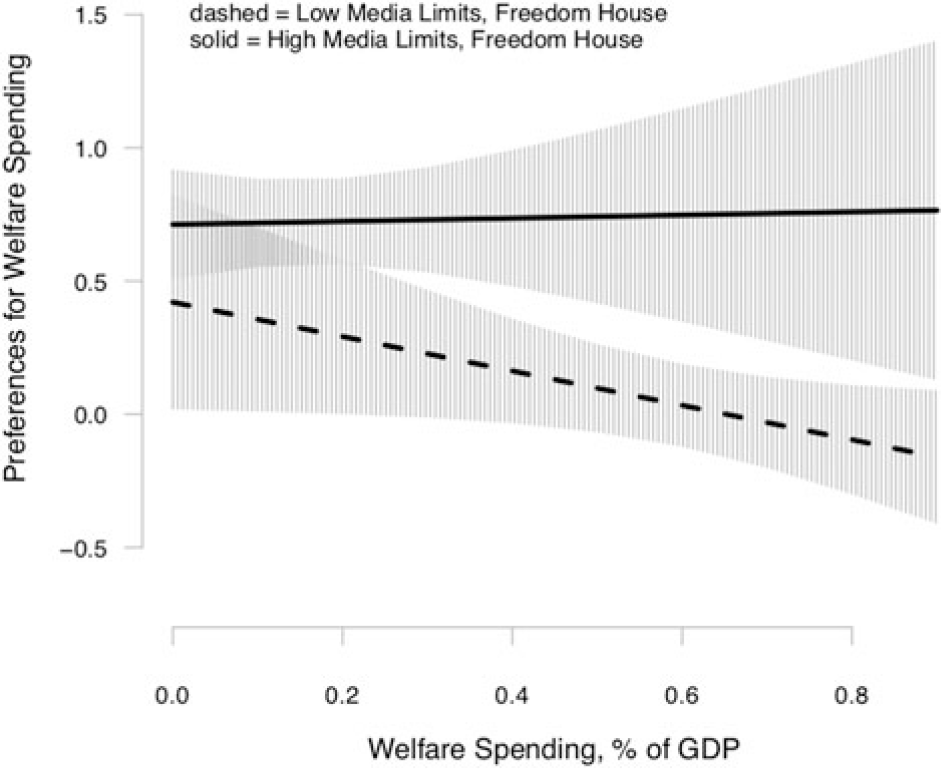
The effect of press limits is difficult to interpret based on the results in table 1, so figure 1 depicts how they condition the estimated impact of increases in spending on welfare preferences. We expect the line to decrease from left to right; that is, relative preferences for (more) spending decrease as spending increases. We plot predictions for two levels of press freedoms: low media limits, where press limits are set to the tenth percentile of the measure in our data (0.12), and high media limits, where press limits are set to the ninetieth percentile (0.41). This is a conservative approach to illustrating our findings because we are not relying on the entire range of media freedoms. Still, results in this figure are relatively clear: under low media limits, increasing spending appears to be associated with decreased preferences for more spending; under high media limits, this does not appear to be the case. Indeed, with media limits, there is no hint of thermostatic responsiveness whatsoever.
Welfare Preferences and Spending, Moderated by Press Freedom
Note: Predicted values using clustered standard errors and with 95% confidence intervals, based on Model 4 in table 1.

This may be a strong interpretation of effects given the results in table 1. We thus look for evidence of a similar effect by examining additional spending domains and then turning to alternative specifications, dropping and adding controls, and changing the RSF- and V-Dem-based measures of Press Limits. These results provide further evidence of the story we suggest here.
Freedom of the Press and Responsiveness in Other Spending Domains
The previous section presents evidence in line with our expectations in the welfare spending domain. We are interested in the welfare domain in particular because it is a relatively salient and important spending domain across a good number of countries. It also is a domain for which we have spending preferences, reliable measures of spending, and reasonable proxies for preferred levels of policy.
Welfare is not the only domain for which this is true, however. The CSES also asks respondents about their preferences on health care and old-age pensions—domains for which the OECD SOCX database also provides reliable spending data (comparable spending numbers are not readily available in the various other domains included in the CSES question). But there are several mitigating factors in both the health care and pension domains. First and foremost, we have weaker expectations of thermostatic responsiveness in these domains, given results of past research (Soroka and Wlezien Reference Soroka and Wlezien.2010). Second, the CSES does not include questions that work as equivalent indicators of people’s preferred levels of spending on health and pensions. Regarding welfare, the CSES asks about reducing differences in income, but there are no questions asking about attitudes toward dealing with health care or pensions. We still are able to use the country-level measure of preferred policy levels—average spending levels from 1990 to 2006—but for the individual level, we must rely on the welfare-focused measure on reducing inequalities (and also left–right ideology), recognizing that it has limited application in the health and pension domains.
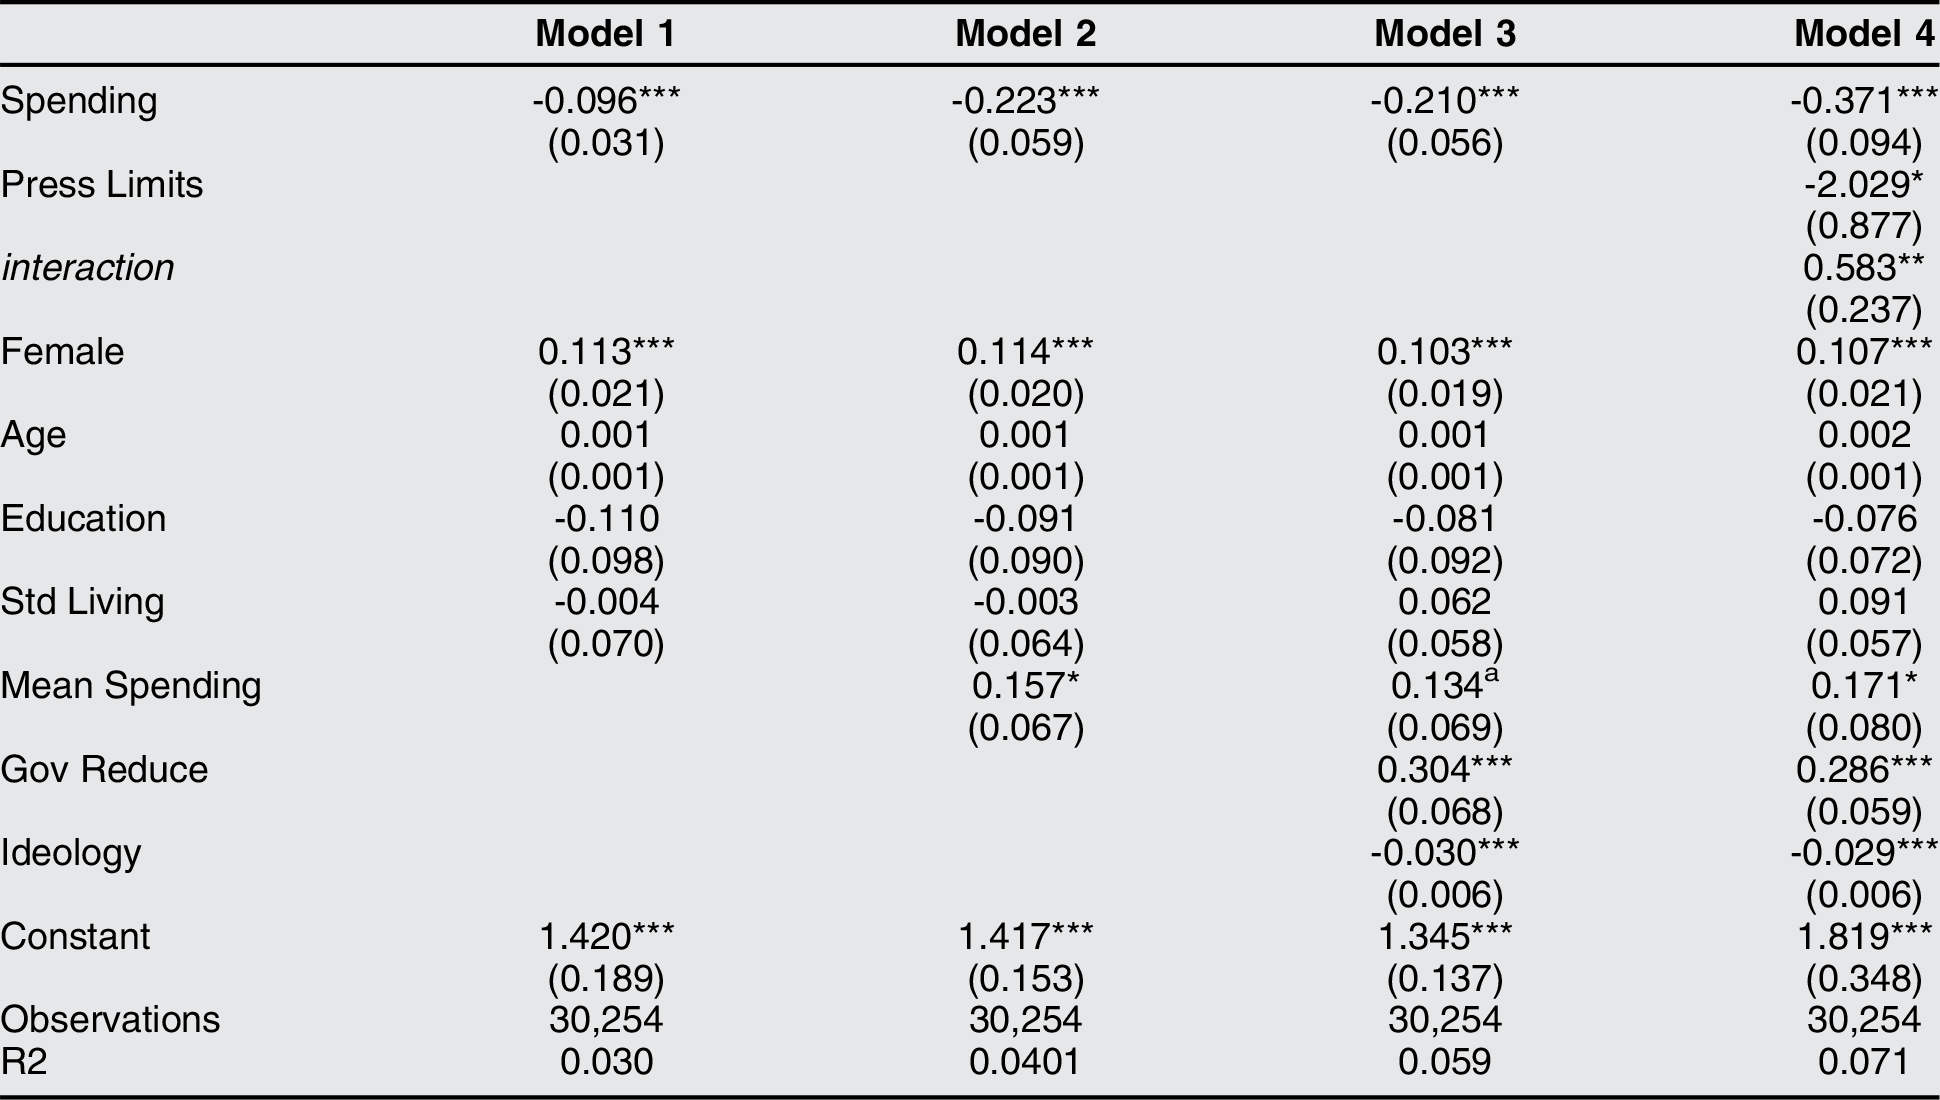
Table 2 presents the models of health spending preferences. Model 1 finds a coefficient for spending that is both negative and statistically significant, which is indicative of a thermostatic response. Adding the proxies for people’s preferred levels of spending in Models 2 and 3 reveals the significant impacts of both mean government spending and ideology and strengthens estimates of thermostatic responsiveness. By contrast with welfare, the controls are not decisive, because we saw evidence of negative feedback in Model 1. And Model 3 again doubles the proportion of variance explained from the first model.
Modeling Relative Preferences for Health Spending

Note: a p <.10; * p <.05; ** p <.01; *** p <.001. Cells contain OLS regression coefficients with clustered standard errors (by country).
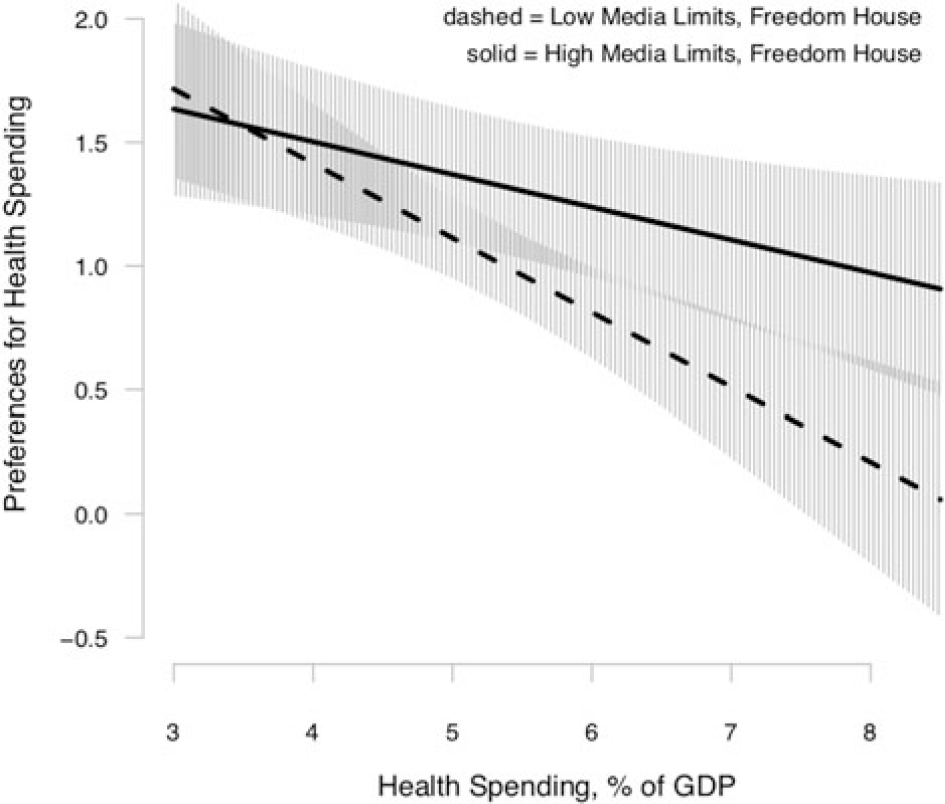
As with welfare preferences, we are most interested in the results when we incorporate Press Limits into Model 4. In this case, we find a statistically significant positive coefficient for the interaction term, alongside a larger (more negative, and significant) coefficient for spending. Figure 2 plots the estimated effects on health spending preferences at the same low and high media constraints as in figure 1. Results are similar to what we saw for welfare, with less separation between the plotted effects but statistically significant coefficients. Footnote 7 In this case relative preferences decline as spending increases for both sets of countries, and there are only hints that the relationship is stronger where press limits are low. The contrast with welfare may be revealing about the source(s) of information people rely on in the two domains, where health spending is more readily apparent from one’s own direct experience.
Health Preferences and Spending, Moderated by Press Freedom
Note: Predicted values using clustered standard errors and with 95% confidence intervals, based on Model 4 in table 2.

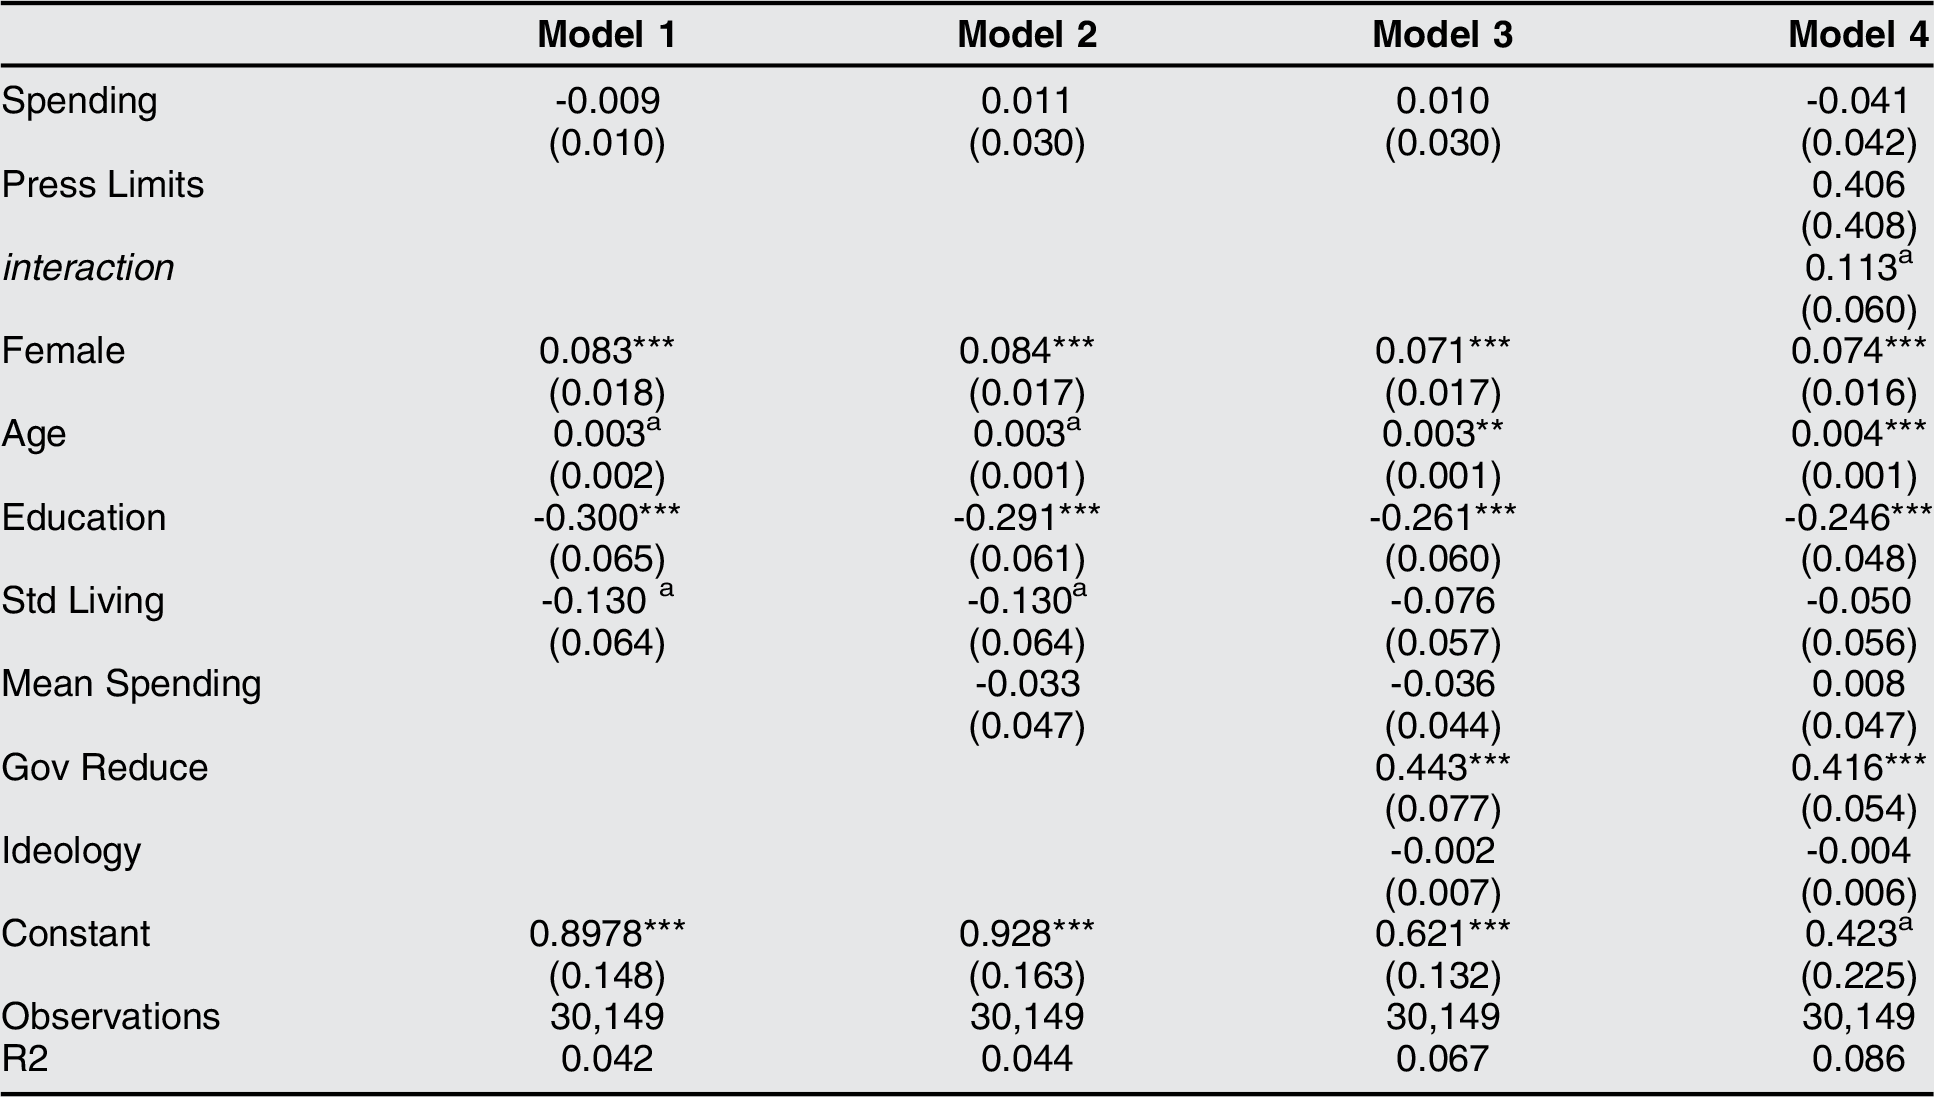
We next turn to old-age pensions, for which table 3 presents the same basic models. Much as we saw with welfare, Model 1 only hints at a thermostatic response, as the coefficient for spending is negative but nonsignificant. Contrasting welfare and health preferences, adding the proxies for policy preferences in Models 2 and 3 does not reveal the same kind of robust results for spending. Adding press limits in Model 4 makes a difference, however. The estimate for the interaction is in the expected positive direction and weakly significant.
Modeling Relative Preferences for Pensions Spending

Note: a p <.10; * p <.05; ** p <.01; *** p <.001. Cells contain OLS regression coefficients with clustered standard errors (by country).
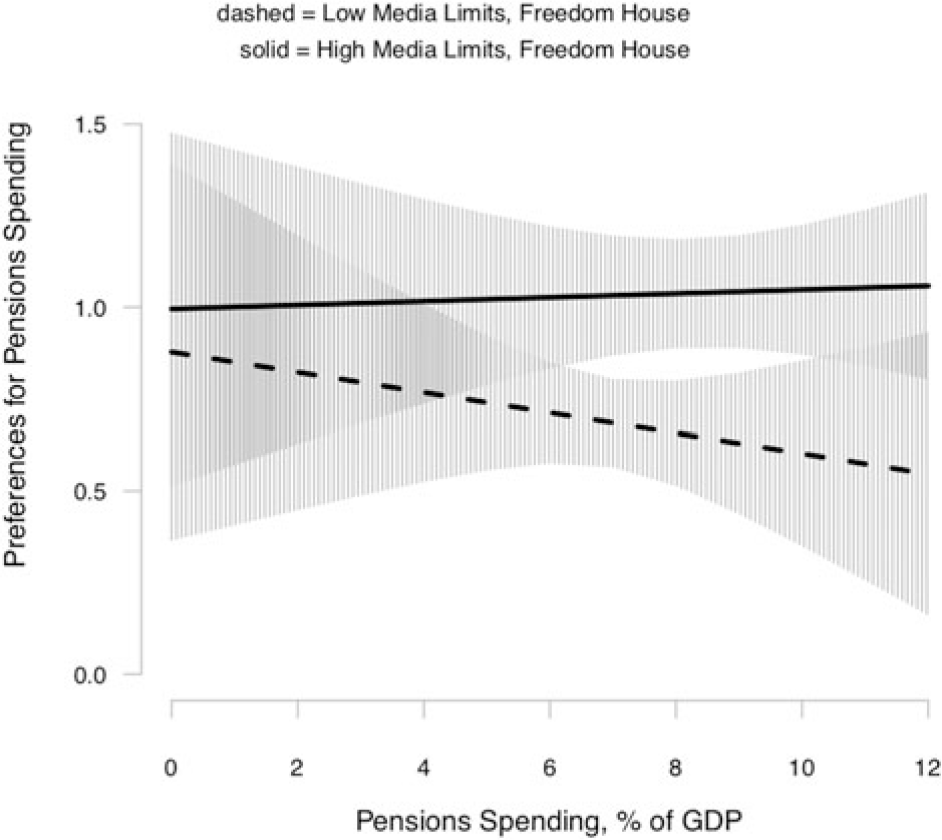
Figure 3 plots the interactive effects from Model 4. The pattern for pensions thus seems to be more similar to welfare than health in that there is evidence of thermostatic responsiveness when media limits are low, and the same is not true when media limits are high.
Pensions Preferences and Spending, Moderated by Press Freedom
Note: Predicted values using clustered standard errors, and with 95% confidence intervals, based on Model 4 in table 3.

Robustness Checks
Results thus far do not resoundingly support the contention that press freedom is critical to public responsiveness. This is not surprising, given that we are working with a limited number of countries and necessarily noisy data on both spending and press freedoms. The results also build on decades—perhaps centuries—of theory on (and observation of) media and democracy, which leads us to take the findings seriously, at least as a first step. It is still important to present several different robustness checks.
First, if it is in fact spending within each domain that drives preferences for that domain, then we should expect that spending in other domains does not do so. That is, the public would respond to spending in a specific domain and not to spending in other, even potentially related, areas (see also Wlezien Reference Wlezien2004). This depends on there being at least some independent variation in by-domain spending (and preferences), which there clearly is: across the 24 countries included in our estimations, welfare and health spending levels are correlated at 0.30, welfare and pensions at -0.08, and health and pensions at 0.39; only in the last instance is the correlation borderline significant (p =.06).
Our test for this is relatively straightforward: we reestimate Model 3 for each domain (in tables 1-3) using all “other” spending categories in the OECD database; that is, we use nonwelfare social spending in place of welfare spending. We do the equivalent for both health and pensions. Results are included in Supplementary Appendix table 1. For welfare and health, there is no sign of thermostatic responsiveness to “other” spending. For pensions, opinion does seem to respond to other spending. This gives us additional confidence in results for the first two domains, but also highlights that public responsiveness varies across domains. It may be that responsiveness to health and welfare spending is quite domain specific, whereas pension spending is not. This might not be surprising given previous research (Wlezien Reference Wlezien2004), but making the determination requires additional research.
Second, we explore the possibility that it is not press freedoms per se that produce the significant interactions in the tables, but other factors highly correlated with press freedoms. The most obvious possibility is that press freedom stands here as a surrogate for broader freedoms and that, for a wide variety of reasons, countries that are freer exhibit more thermostatic responsiveness. We test this by reestimating Models 4 (from tables 1-3), substituting other Freedom House measures for press freedom. Results are included in Supplementary Appendix table 2. Here, using the general indexes for (a) civil liberties or (b) political rights yields borderline-significant interactions for welfare and pensions (p <.10). We take these results as evidence that press freedoms are correlated with (and are a component of) freedoms more generally, but when it comes to public responsiveness, press freedoms in particular appear to matter.
Third, we evaluate two other measures of press freedom, from RSF and V-Dem, described earlier. Rather than present two additional versions of each of tables 1 through 3, Supplementary Appendix figure 3 depicts the illustrated interactions across all three variants of media freedom and all three policy domains. For welfare we find stronger interactive effects of Press Limits using the V-Dem measure, but not the RSF measure; for health we find similar but weaker results using the new measures; for pensions, effects are stronger for the RSF measure but weaker for the V-Dem measure. Although there is variation here, we regard the weight of the evidence as being in line with our expectations.
Fourth, we test the robustness of our results to the exclusion of individual countries using jackknife estimates for models in tables 1-3, in which we drop each country (with replacement) from the overall estimate. Excluding Mexico in the welfare preferences estimation is the only instance in which results change in a substantive way from what we saw earlier. In that case, both the direct impact of spending and the interaction are insignificant. Footnote 8
Fifth, we consider the addition of macroeconomic variables as controls, testing for the possibility that preferences for spending are conditioned by macroeconomics in addition to (or even instead of) spending. These results are included in Supplementary Appendix table 3. There we can see that adding unemployment and GDP per capita have only a limited impact on the impact of spending. Removing all controls produces weaker estimates of responsiveness, confirming the importance of the demographic and attitudinal controls in our models. Even when spending and press freedom are the only variables in the model, however, we find some evidence of thermostatic responsiveness, moderated by press freedom, at least for health and to a lesser extent welfare.
Finally, given that our dependent variable is a 5-category variable, we confirm our findings using an ordered logit estimation. Results confirming the robustness of our findings to this change in estimation are included in Supplementary Appendix Table 4. Indeed, using the logit estimation produces statistically significant interactions in every case.
Conclusions
Just how important is a free press to the public’s ability to hold a government accountable? There are strong claims that freedom of the press is critical, but thus far few direct tests of the importance of a free press, particularly in a cross-national setting. This study takes a first step, relying on a new body of data on citizens’ relative preferences for policy combined with measures of spending and press freedoms. The results offer some support for the supposition that public responsiveness in important social spending domains—welfare, health, and pensions—is moderated by restrictions on the press.
Where the press is relatively unconstrained, we observe responses to policy change. Where there are controls on the press, it appears as though the citizen response to policy change is muted. This finding is important: if citizens do not get accurate information about policy, they will be unable to effectively hold their government(s) accountable for what they do, and media freedom apparently matters. We see this as the basic thrust of the preceding results. That said, cross-national effects are difficult to model, measures of both spending and press freedoms are noisy, and the number of cases on which we are able to draw is limited.
We acknowledge a number of limitations to our analyses. To begin, we are constrained by the datasets that we can use. The CSES Wave 4 offers the most cross-national data to date on relative preferences for spending, but there are still limits to the countries in the sample, due in part to the need for reliable measures of spending as well. (Other surveys with similar question wording, such as the International Social Survey Programme, contain a narrower range of countries in their sample.) We are nevertheless able to draw on 24 countries included in the CSES, and we evaluate three separate datasets of press freedom measures and find similar results across seven of the nine possible combinations. Further, our results hold even when we exclude countries that are more constraining on their press (with the exception of Mexico as noted earlier). We view this as strong evidence of the robustness of our findings.
The use of observational data limits our ability to make strong causal claims. This is not a constraint exclusive to our work, of course. Note also that we find similar moderating effects across multiple Press Limits measures but not using measures that tap freedoms more generally; the pattern of results is robust to the inclusion of controls and a variety of other tests. Although not conclusive, the combination of theoretical motivation and evidence is strongly suggestive, perhaps even compelling.
Another concern is that we have a limited number of control variables in our models, and so it is possible that other unmeasured variables play a role in preferences. Omitted variables are always a concern, of course, and in our case we have a strong theoretical model, attempt to actually measure the constructs, and the measures we use work very much as we expect. Moreover, adding more controls does not appear to change our findings (refer to Supplementary Appendix table 3).
We thus regard these findings as making a useful contribution to debates about trends in media freedoms in the United States and around the world. Freedom House’s most recent report warns that press freedoms are at their lowest point in 13 years, with declines in both democratic and authoritarian states. Footnote 9 In 2016, we saw increasing government control over state media in Poland, and responses to an attempted coup in Turkey included the closing of a wide range of media outlets and the incarceration of more than 80 journalists. We also write this article in the midst of an increasingly fraught relationship between the White House and much of the mass media. But it is important to make clear that we view this study as only a first step in quantitatively evaluating the role of a free press on public opinion. There are a number of future directions that work can take, such as looking at media quality or the role of different economic models of the press. What we have done represents a jumping-off point for those studies, not a final resting place.
Note also that government–media relations are just one way in which the quality of information about policy may be waning. Consider, for instance, ongoing debates about whether news consumers exhibit increasingly selective exposure via online, and increasingly partisan, media outlets (the recent literature is vast, but see Garrett Reference Garrett2009; Iyengar and Hahn Reference Iyengar and Hahn2009; Messing and Westwood Reference Messing and Westwood2014; Stroud Reference Stroud2008, Reference Stroud2010) and whether this dynamic is ameliorated or worsened through the algorithms embedded in search engines and social media (Bakshy, Messing, and Adamic Reference Bakshy, Messing and Adamic2015; Flaxman et al. Reference Flaxman, Goel and Rao2016). Although our focus is on the impact of freedom of the press, our results may speak to the possible impacts of a broad range of both provision- and consumption-related dynamics affecting the quality of information reaching citizens. In short, the quality of policy information reaching citizens around the world is seemingly not getting better. Our analysis suggests that this may have consequences for both public responsiveness and political representation itself.
Supplementary Materials
To view supplementary material for this article, please visit https://doi.org/10.1017/S1537592719003852