Implications
To our knowledge this is the first study showing the inclusion of pumpkin seed cake (PSC) in the goats’ diets. Pumpkin seed cake was successfully used as replacement for soya bean meal in the diet of dairy goats without any negative effect on milk yield or milk composition. Similarly, the current study confirmed the beneficial role of extruded linseed (ELS) in increasing the n-3 fatty acids content in goat milk, a feature desired by certain groups of consumers. The effects of PSC supplementation on profitability and environmental issues like nitrogen excretions should still be evaluated.
Introduction
Numerous investigations have reported differences in the role of fatty acids for human health, depending on their chain length, number and position of double bonds, and their configuration and ratio of certain fatty acids. The effects of individual fatty acids consumption is a complex issue to study provided that fatty acids cannot be longer viewed as general categories (Vannice and Rasmussen, Reference Vannice and Rasmussen2014), but in general high intake of certain saturated and trans-fatty acids and low intake of polyunsaturated fatty acids (PUFA) are associated with increased cardiovascular disease risk (Mozaffarian et al., Reference Mozaffarian, Katan, Ascherio, Stampfer and Willett2006; Siri-Tarino et al., Reference Siri-Tarino, Sun, Hu and Krauss2010).
Fat supplementation in the diets of animals does not only enhance the energy content of the diet, but also has the potential to modify the fatty acid profile of animal products, depending on proportions of fatty acids in the animals’ diets, the level of biohydrogenation and the rumen microbial activity (Mele et al., Reference Mele, Buccioni, Serra, Antongiovanni and Secchiari2008). Milk fat in ruminants contains ~400 different fatty acids which makes it the most complex of all natural fats (Månsson, Reference Månsson2008) and presents a paramount factor in the nutritional quality of cheeses (Bodas et al., Reference Bodas, Manso, Mantecon, Juarez, de la Fuente and Gomez-Cortes2010). Goats’ milk contains a higher content of certain short-chain fatty acids (C6:0, C8:0, C10:0) than cows’ milk which contribute to better digestibility of fat in their milk or milk products by humans (Queiroga et al., Reference Queiroga, Melo Santos, Pereira Gomes, João Monteiro, Teixeira, Souza, Dias Pereira and Estevez Pintado2013).
By-products from oil production are used in animal nutrition to meet energy and protein requirements of ruminants. High and variable soya bean prices has led to attempt a partial or total replacement of soya bean as protein source for ruminants with alternative feedstuffs (Vasta et al., Reference Vasta, Nudda, Cannas, Lanza and Priolo2008). In this regard, PSC is a by-product with potential for ruminants’ feeding, with a higher CP concentration than soya bean meal (Zdunczyk et al., Reference Zdunczyk, Minakowski, Frejnagel and Flis1999) which effects on goats’ milk yield and composition have not been studied. The main fatty acids in the fat of PSC are linoleic acid (LA, 35.6 to 60.8 g/100 g fat), oleic acid (OA, 21.0 to 46.9 g/100 g fat), palmitic acid (9.5 to 14.5 g/100 g fat) and stearic acid (3.1 to 7.4 g/100 g fat) (Murković et al., Reference Murković, Hillebrand, Winkler, Leitner and Pfannhauser1996). Similarly, ELS is one of the most common by-products available and already adopted for enrichment of dairy products with beneficial fatty acids. Linseed is rich source of unsaturated fatty acids (UFA), particularly α-linolenic acid (ALA), which concentration in fat is 51.3 g/100 g (Bodas et al., Reference Bodas, Manso, Mantecon, Juarez, de la Fuente and Gomez-Cortes2010). The research by Nudda et al. (Reference Nudda, Battacone, Usai, Fancellu and Pulina2006) indicated high-nutritional value of ELS, which leads to an increase in ALA, CLA and vaccenic acid. The aim of this study was to research if PSC inclusion in the diets of dairy goats influences yield, composition and fatty acids profile of their milk as compared with the feeding of a conventional diet containing soya bean meal and a diet already replacing some soya bean meal with ELS as protein source.
Material and methods
Experimental design, animals and feeding
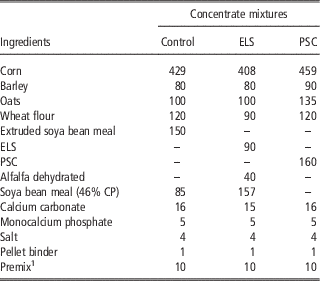
The research was conducted with 28 French Alpine dairy goats at the commercial farm Đurković in Marjančaci (Croatia). All goats had kidded within a period of 2 weeks in February 2014 and were included in the experiment on the 5th of March. The total duration of the experiment was 75 days and was conducted between March and May 2014. All goats were healthy and in good condition when the experiment started, and had an average age of 43.2±20.4 months and an average live weight of 46.9±7.9 kg (Table 1). All goats were fed ad libitum (~2.5 kg/goat per day) with a basal diet of a mixture of grass (600 g/kg dry matter (DM); Lolium multiflorum and Phleum pratense) and red clover hay (400 g/kg DM; Trifolium pratense). They were divided into three groups. In addition to the basal diet, each goat was individually supplemented with 1 kg/day of a concentrate mixture, in separated feeding troughs, offered in two portions during the morning and evening milking, no refusals of concentrate were observed for any animal. The concentrate mixture differed in the main source of protein (Table 2)
-
1. Control group (n=9): soya bean meal as main protein source.
-
2. Extruded linseed group (n=10): soya bean meal was partially substituted with ELS.
-
3. Pumpkin seed cake group (n=9): soya bean meal was completely substituted with PSC.
Experimental design and composition (as-fed) of experimental diets offered to lactating dairy goats (arithmetic mean±SD)

ELS=extruded linseed; PSC=pumpkin seed cake.
1 Hay mixture contained (on dry matter basis) 60% of Phleum pratense and Lolium multiflorum hay and 40% of Trifolium pratense hay.
Ingredient composition (g/kg, as-fed) of the concentrate mixtures containing soya bean meal (Control), extruded linseed (ELS) or pumpkin seed cake (PSC) in the diets of lactating dairy goats

1 Mineral–vitamin premix: Fe (iron sulphate monohydrate) 4000 mg, Cu (copper sulphate pentahydrate) 800 mg, Mn (manganese oxide) 3500 mg, Zn (zinc sulphate monohydrate) 5000 mg, I (potassium iodide) 80 mg, Co (cobalt sulphate heptahydrate) 20 mg, Se (sodium selenite) 15 mg, Mg (magnesium oxide) 5000 mg; vitamin A 0.1×10⁷ IU, vitamin D3 150 000 IU, vitamin E (α-tocopherol) 1500 mg, vitamin K3 (menadione sodium bisulfite) 50 mg, vitamin B1 (thiamine mononitrate) 100 mg, vitamin B2 200 mg, vitamin B6 200 mg, vitamin B12 1 mg, niacin 1000 mg, Ca-pantothenate 500 mg, choline chloride 10 000 mg.
Concentrate mixtures were isoproteic, isolipidic and isoenergetic (National Research Council, 2007). The diet had an approximate hay to concentrate ratio of 70 : 30 (on DM basis) with 18.12 MJ net energy for lactation (NEL)/day with ~40.5% of total NEL/day derived from the concentrate. All animals had free access to fresh drinking water. During the 1st month after kidding, kids were kept together with the goats and were allowed to suckle ad libitum. Kids were completely weaned at the age of 2 months, and kept separately from their mothers thereafter.
Chemical composition of feedstuffs
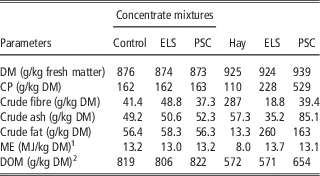
Four replicates of ~10 g of each concentrate mixture, PSC, ELS and hay mixture, were sampled, dried at 60°C, ground to 1 mm particle size using a cutting mill (Microtron MB 550; Kinematica, Luzern, Switzerland) and analysed for chemical composition (Table 3). In brief, crude ash (CA) concentrations were determined by incinerating the feed samples at 550°C for 6 h. The CP concentrations were estimated from nitrogen content according to the Kjeldahl method (Pearson, Reference Pearson1976). Crude lipids concentrations were analysed according to Onwuka (Reference Onwuka2005) using the universal Extraction System B-811 (Buchi, Flawil, Switzerland). Finally, crude fibre concentrations were determined using the Weende method described in Offor et al. (Reference Offor, Ehiri and Njoku2014).
Chemical composition of hay (n=4), pumpkin seed cake (PSC; n=4), extruded linseed (ELS; n=4) and the concentrate mixtures used in the Control, ELS and PSC diets of lactating dairy goats (arithmetic means)

DM=dry matter; ME=metabolisable energy; DOM=digestibility of organic matter; Gp=gas production (ml/200 mg DM); CP=crude protein concentration (g/kg DM); CL=crude lipids concentration (g/kg DM); CA=crude ash content (g/kg DM).
1 ME (MJ/kg DM)=1.06+0.157×Gp+0.0084×CP+0.022×CL−0.0081×CA (equation for hay); ME (MJ/kg DM)=2.20+0.136×Gp+0.0057×CP+0.00029×CL2 (equation for concentrates).
2 DOM (g/kg DM)=149+8.89×Gp+0.448×CP+0.651×CA (for hay and concentrates) (Menke et al., Reference Menke, Raab, Salewski, Steingass, Fritz and Schneider1979).
Metabolisable energy (MJ/kg DM) and digestibility of organic matter (g/kg DM) of feed samples were calculated from gas production after 24 h of in vitro incubation with Hohenheim gas test using the following equations (Menke et al., Reference Menke, Raab, Salewski, Steingass, Fritz and Schneider1979)
 $$\eqalignno{ {\rm ME}\,&({\rm MJ/kg}\,{\rm DM})\,{\equals}\,1.06{\plus}0.157{\times}{\rm Gp}{\plus}0.0084{\times}{\rm CP}\cr&{\plus}0.022{\times}{\rm CL}-0.0081{\times}{\rm CA}\,-\,{\rm for}\,{\rm hay,}$$
 $$\eqalignno{ {\rm ME}\,&({\rm MJ/kg}\,{\rm DM})\,{\equals}\,2.20{\plus}0.136{\times}{\rm Gp}{\plus}0.0057{\times}{\rm CP}\cr&{\plus}0.00029{\times}{\rm CL}^{2} \,-\,{\rm for}\,{\rm concentrates,}$$
 $$\eqalignno{ {\rm DOM}\,&({\rm g/kg}\,{\rm DM})\,{\equals}\,149{\plus}8.89{\times}{\rm Gp}{\plus}0.448{\times}{\rm CP}\cr&{\plus}0.651{\times}{\rm CA}\,-\,{\rm for}\,{\rm hay}\,{\rm and}\,{\rm concentrates,}$$
where DM is the dry matter (g/kg fresh matter), Gp the gas production (ml/200 mg DM), CP the crude protein concentration (g/kg DM), CL the crude lipids concentration (g/kg DM) and CA the crude ash concentration (g/kg DM).
Fatty acid analysis of feedstuffs
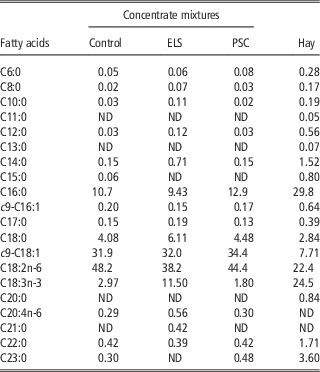
Fatty acids in dietary ingredients were determined by gas chromatography following the methodology of State office of agricultural chemistry in Baden Württemberg (LaChemie P23-5-008, V. 01, Determination of the complete fatty acids profile as fatty acids methyl esters in dietary compounds). Fatty acid proportions of concentrate mixtures are presented in Table 4.
Proportions (g/100 g fatty acids) of fatty acids in hay and concentrate mixtures containing soya bean meal (Control), extruded linseed (ELS) or pumpkin seed cake (PSC) in the diets of lactating dairy goats

ND=not determined.
Milk sampling
Goats were hand-milked twice a day at 0700 and 1900 h. Milk samples were taken on the 20th, 48th and 75th days after starting the experiment, however, during the first two sampling kids were still suckling and therefore only the analyses of samples taken on day 75 are presented here. For the fatty acid analysis four 100-ml sub-samples were taken as follows: evening milking on day 74, morning and evening on day 75 and morning milking on day 76. The four sub-samples were pooled and weighted by milk production to one sample. Milk yield of each goat was recorded with a measuring cylinder from these samplings. Milk yield expressed in volume (l) was converted in mass (kg) with the conversion factor 1.032 (normal goat milk density) according to International Committee for Animal Recording (2012).
Analysis of milk composition
Immediately after sampling the milk was transferred into 100-ml bottles containing 0.3 ml of the preservative azidiol, cooled to 4°C and transported to the Central Laboratory for Milk Control in Križevci (Croatia) for the analysis of fat (g/100 g), protein (g/100 g), lactose (g/100 g), urea (mg/dl) and somatic cell counts (SCC) (n/ml). Composition was analysed by IR spectroscopy HR ISO 92622:2001 method on the analyser MilkoScan FT 6000 (Foss Electric, Hillerød, Denmark). Somatic cell counts were determined by fluoro-opto-electronic method HR ISO 13366-2/Ispr.1:2007 with a Fossomatic 5000 analyser (Foss Electric).
Fatty acid analysis
After sampling milk was frozen at −80°C and stored until analysis. The extraction of milk fat was done following a three-step extraction with gravimetric reference method (The International Organization for Standardization, 2010). Fatty acid methyl esters (FAME) were obtained from the milk fat samples by transesterification according to The International Organization for Standardization (2002a), whereas the fatty acid composition was determined by GLC following procedures described in The International Organization for Standardization (2002b).
In brief, a mixture of 1200 μl of n-heptane, 300 μl of a 10% solution of fat in n-heptane and 60 μl of a 2 mol/l solution of potassium hydroxide in methanol was shaken vigorously for 2 min (vortex mixer) in a sample vial and allowed to stand for 5 min. After addition of 150 mg sodium hydrogen sulfate monohydrate the sample was vortexed (1 min) and centrifuged (3 min at 1000×g); 1 μl of the supernatant (~2% FAME in heptane) was injected into the gas chromatograph (Agilent 7890A; Agilent, Santa Clara, CA, USA). The gas chromatograph was equipped with an Agilent 7683B autosampler (Agilent), a split injection port (1:130), a flame ionisation detector and a 60-m fused silica capillary column (internal diameter 0.25 mm) coated with a 0.20 μm film of CP-Sil 88 (Agilent). Hydrogen was used as carrier gas at a constant flow of 1.3 ml/min (94 kPa initial pressure). Injector and detector temperatures were 255°C. The oven temperature was maintained at 50°C, isothermal, for 1 min then programmed at 5°C/min to 225°C, which was held for 3 min isothermal, and then programmed at 1°C/min to 237°C. Evaluation of chromatograms was performed with the Agilent Software EZChrom Elite 3.3.2. Calibration of the major fatty acids was carried out using the reference milk fat CRM 164 (IRMM, Geel, Belgium). Fatty acids in the range from C4 to C24 were determined, calculated as weight percentage (g/100 g fatty acids) and are presented as means of duplicate analyses.
Statistical analysis
The results are presented as arithmetic means and standard error of mean. Data were analysed using GLM procedure (SAS 9.3®) with diet treatment as fixed effect and parity, litter size as covariate for milk yield and composition analyses, whereas fatty acid proportion was analysed using milk yield as additional covariate. Means were compared using the Tukey’s test and differences between the groups were declared significant at P<0.05. Values of SCC were logarithmically converted to a linear score with the aim to approximate normal distribution.
Results and discussion
Milk yield and composition
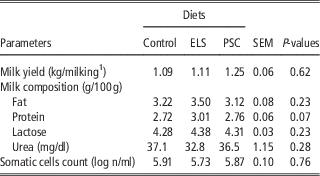
To the best of our knowledge, there is no scientific literature available on the effects of PSC feeding of goats on milk yield and composition. The contents of protein, fat, lactose, urea and the SCC in milk did not differ between ELS or PSC and the Control (P⩾0.07; Table 5). Nudda et al. (Reference Nudda, Battacone, Usai, Fancellu and Pulina2006) found no effects of ELS cake on milk yield and composition. Neither linseed oil in the study by Martínez-Marín et al. (Reference Martínez-Marín, Gomez-Cortes, Gomez-Castro, Juarez, Perez-Alba, Perez Hernandez and de la Fuente2012) had effect on milk production traits of goats.
Yield and composition of milk of dairy goats offered concentrate mixtures containing soya bean meal (Control; n=9), extruded linseed (ELS; n=10) or pumpkin seed cake (PSC; n=9) (arithmetic means)

1 Morning milking.
The inclusion of ELS or PSC as substitute of soya bean meal might have altered voluntary hay intake of goats in our study, which could not be measured under the current experimental setup. However, studies with sheep supplemented with fat in the form of seeds (Zhang et al., Reference Zhang, Wang and Xu2007) or oils (Ivan et al., Reference Ivan, Mir, Koenig, Rode, Neill and Mir2001) did not report negative effects on DM intake. Along the same line, Allen (Reference Allen2000) found that the response in DM intake of dairy cows to fat supplementation depends on the fat content of the initial diet, with the strongest effects occurring when fat is actually added and not substituted by another source as in this study. Therefore, as chemical composition of the three concentrate mixtures was similar (Table 3) and they were consumed at the same rate (1 kg/animal), ELS and PSC feeding likely did not pronouncedly alter hay intake of goats. Overall, our results thus show the potential of replacing soya bean meal partially by ELS or completely by PSC in the diets of dairy goat without any compromises in milk yield and composition.
Milk fatty acid profile
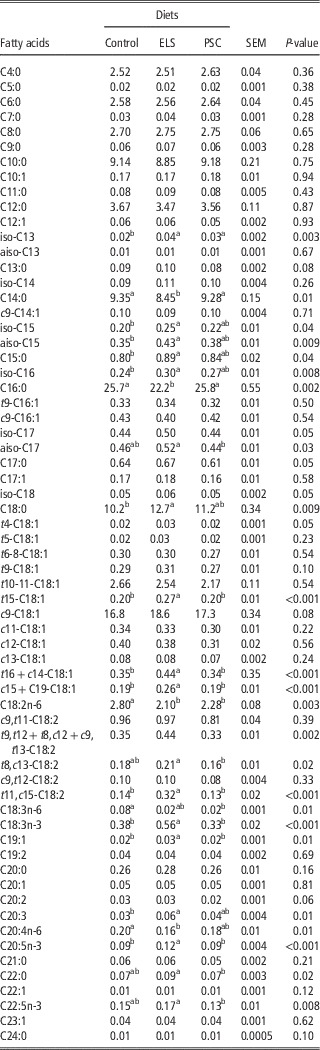
The ELS and PSC diets did not influence the proportions of C6:0, C8:0 and C10:0 (P⩾0.45; Table 6), which is desirable, because these fatty acids are responsible for the particular sensory properties of goat’s cheese upon lipolysis. Similar results were observed by Nudda et al. (Reference Nudda, Battacone, Usai, Fancellu and Pulina2006) who offered a diet providing 100 g/day per animal of ELS to dairy goats over a period of 21 days. Chilliard et al. (Reference Chilliard and Ferlay2003) stated that de novo synthesised fatty acid proportions may decrease, if biohydrogenation of dietary UFA increases C18:0 and t11-C18:1 proportions, as long-chain fatty acids (LCFA) inhibit lipogenic enzymes of the mammary gland (Mele et al., Reference Mele, Buccioni, Serra, Antongiovanni and Secchiari2008).
Proportions (g/100 g fatty acids) of fatty acids in milk of dairy goats offered concentrate mixtures containing soya bean meal (Control; n=9), extruded linseed (ELS; n=10) or pumpkin seed cake (PSC; n=9) (arithmetic means)

a,bValues within a row with different superscript letters differ significantly at P<0.05.
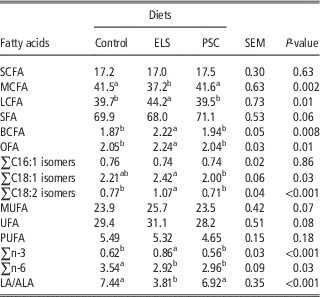
For medium-chain fatty acids, ELS had lower C14:0 and C16:0 concentrations than both PSC and Control. The lower C16:0 in ELS compared with Control is in agreement with results of previous studies (Nudda et al., Reference Nudda, Battacone, Usai, Fancellu and Pulina2006 and Reference Nudda, Palmquist, Battaconea, Fancellua, Rassua and Pulina2008; Renna et al., Reference Renna, Lussiana, D’Agostino, Mimosi and Fortina2013). A proportion of 40% of C16:0 in milk originates from de novo synthesis in the mammary gland and another 60% is absorbed from circulation (Chilliard and Ferlay, Reference Chilliard, Ferlay, Rouel and Lamberet2004; Nudda et al., Reference Nudda, Battacone, Usai, Fancellu and Pulina2006). In the present study both PSC and Control had higher C16:0 concentrations than ELS (Table 4). In addition, the decrease of C16:0 in ELS group, could be also due to increased proportion of LCFA which may inhibit de novo synthesis of fatty acids as suggested by Chilliard et al. (Reference Chilliard and Ferlay2003). Stearic acid (C18:0) proportion increased with addition of ELS compared with the Control, likely due to higher rate of complete biohydrogenation of dietary PUFA that could have been biohydrogenated to C18:0, whereas C18:0 concentration in milk fat of PSC was in an intermediate concentration between control and ELS. The sum of saturated fatty acids was not affected by ELS and PSC (Table 7; P=0.06).
Proportions (g/100 g fatty acids) of groups of fatty acid in milk of dairy goats offered concentrate mixtures containing soya bean meal (Control; n=9), extruded linseed (ELS; n=10) or pumpkin seed cake (PSC; n=9) (arithmetic means)

SCFA=short-chain fatty acids; MCFA=medium-chain fatty acids; LCFA=long-chain fatty acids; SFA=saturated fatty acids; BCFA=branched-chain fatty acids; OFA=fatty acids with odd number of carbon atoms; MUFA=monounsaturated fatty acids; UFA=unsaturated fatty acids; PUFA=polyunsaturated fatty acids; LA=linoleic acid; ALA=α-linolenic acid.
a,bValues within a row with different superscript letters differ significantly at P<0.05.
Total odd and branched-chain fatty acids (OBCFA; P⩽0.01) and some individual BCFA (iso-C15, aiso-C15 and iso-C16; P⩽0.04) were higher in ELS compared with the Control, with the PSC treatment being in most cases intermediate between the former two. As these fatty acids derive from bacteria living in the rumen, higher proportions of OBCFA with ELS diets might indicate an increase in growth and/or a shift in the species composition of the microbial consortium in the rumen (Vlaeminck et al., Reference Vlaeminck, Fievez, Cabrita, Fonseca and Dewhurst2006); Mika et al. (Reference Mika, Stepnowski, Kaska, Proczko, Wisniewski, Sledzinski and Sledzinski2016) reported anti-inflammatory, antidiabetic and anticancer properties of iso-BCFA, and potential benefits of iso-BCFA enriched diets. In contrast to our results, previous studies showed a decrease in content of BCFA in milk when linseed oil (Martínez-Marín et al., Reference Martínez-Marín, Gomez-Cortes, Gomez-Castro, Juarez, Perez-Alba, Perez Hernandez and de la Fuente2011) or formaldehyde-treated linseed (Bernard et al., Reference Bernard, Rouel, Leroux, Ferlay and Faulconnier2005) were added to the diets of lactating goats, which has been also observed when supplemented diets with fat containing high amounts of either LA, ALA or EPA and DHA (Vlaeminck et al., Reference Vlaeminck, Fievez, Cabrita, Fonseca and Dewhurst2006).
Although proportions of total C18:1 isomers increased in ELS, compared with PSC, proportions of OA and t10-,t11-C18:1 were not different between these two treatments. Total monounsaturated fatty acid proportion was not affected by ELS and PSC (P=0.07). Similar findings were reported by Chilliard et al. (Reference Chilliard and Ferlay2003) who supplemented dairy goats with 3.4±0.6% (DM basis) added lipids as crude whole linseed v. the group supplemented with lipids as soya beans in the same concentration. The proportion of C18:1 may be the result of the desaturation of C18:0 available in mammary gland which, in turn, originates from the biohydrogenation of PUFA in the rumen (Chilliard and Ferlay, Reference Chilliard, Ferlay, Rouel and Lamberet2004).
Diets with PSC decreased (P<0.05) LA by 18.6% and with ELS by 25.0% compared with the Control likely as consequence of the higher LA content of soya bean meal included in the Control diet (Table 4) which is in agreement with previous findings of Chilliard et al. (Reference Chilliard and Ferlay2003) and Renna et al. (Reference Renna, Lussiana, D’Agostino, Mimosi and Fortina2013).
Isomers t15-C18:1 and t11,c15-C18:2, both produced from ALA metabolism in rumen (Shingfield et al., Reference Shingfield, Bernard, Leroux and Chilliard2010), were higher in ELS than in Control group of the present study. Contrary, PSC diet lowered proportions of ALA compared with ELS diet in accordance with lower t15-C18:1 and t11,c15-C18:2. As isomers of LA in milk are intermediates of biohydrogenation of LA and ALA (Shingfield et al., Reference Shingfield, Bernard, Leroux and Chilliard2010), total C18:2 isomers were also higher with ELS than with Control or PSC diets. Furthermore, CLA (c9,t11-C18:2), one of the milk fatty acids of interest with respect to human health, was not affected by ELS or PSC (P>0.05).
Proportions of arachidonic acid (AA, C20:4n-6) were lower (20%) in ELS, likely due to lower proportion of LA in the diet (Table 4), whereas PSC did not influence AA proportion. Conversely, ELS increased ALA proportions (47.4%) compared with Control group (P<0.05), but no effects were observed with PSC. Similar to findings of Nudda et al. (Reference Nudda, Palmquist, Battaconea, Fancellua, Rassua and Pulina2008) and Renna et al. (Reference Renna, Lussiana, D’Agostino, Mimosi and Fortina2013), proportions of AA formed were lower in milk of goats of the ELS group than of those from Control group may be due to lower availability of LA as a precursor. Content of ALA was highest in the ELS diets (Table 4.) which resulted in higher ALA proportions in milk of goats of the ELS group compared with those of the Control or PSC group. Consequently, the LA/ALA ratio was lowest in the ELS group which is common observation when ELS is added in goat diets, also concluded by Renna et al. (Reference Renna, Lussiana, D’Agostino, Mimosi and Fortina2013). However, LA/ALA ratio in milk did not differ between goats of the PSC and Control group. Although n-6/n-3 ratio may have been misguided regarding cardiovascular disease (Salter, Reference Salter2013) there are many diseases that may develop due to imbalance of LA/ALA (Simopoulos, Reference Simopoulos2011).
Proportion of EPA in milk fat was increased (33.3%; P<0.05) with ELS diet, as a consequence of greater ALA supply from the diet as its precursor during the elongation. However, milk fat proportion of docosapentaenoic acid (DPA) was not different between ELS and Control diets. The PSC diet did not affect EPA compared with Control, but lowered DPA compared with ELS. Total n-3 fatty acids were by 27.9% higher in the ELS compared with the Control, whereas both ELS and PSC decreased n-6 fatty acids (P<0.05). Total PUFA and total UFA remained unchanged compared with the Control, although total LCFA increased when feeding ELS, probably due to LCFA increase in ELS diets.
The current findings indicate that soya bean meal can be completely substituted with PSC, when feeding dairy goats, without any decrease in milk production or sharp changes in fatty acid profile. Compared with partial substitution of soya bean meal with ELS, PSC had lower total n-3 fatty acids but similar total UFA, PUFA and LA/ALA ratio. Partially substituted soya bean meal with ELS in hay-based diets may enhance goat milk with n-3 fatty acids, especially ALA and EPA, and lowering LA/ALA ratio. Higher proportions of OBCFA were also observed with feeding ELS but not with PSC, which might indicate different activities of rumen microbes and is worth to further study.
Acknowledgements
The authors thank the farmers for care of animals, as well as Birte Fischer-Kassebart for assistance in performing fatty acid analyses.