





Bipolar disorder is one of the most severe and prevalent mental illnesses, affecting about 40 to 50 million people worldwide Reference Vos, Abajobir, Abbafati, Abbas, Abate and Abd-Allah1 and with an estimated 15–20% dying by suicide. Reference Miller and Black2 It is a complex disorder characterised by recurrent hypomanic or manic and depressive episodes and is associated with significant somatic and psychiatric comorbidity. Reference Grande, Berk, Birmaher and Vieta3 Lithium has remained the gold standard and first-line medication for patients with bipolar disorder for over 70 years, Reference Cade4,Reference Malhi, Bassett, Boyce, Bryant, Fitzgerald and Fritz5 effectively treating acute episodes of illness, preventing relapses and demonstrating anti-suicidal properties. Reference Tondo, Hennen and Baldessarini6,Reference Geddes, Burgess, Hawton, Jamison and Goodwin7 However, not all bipolar disorder patients experience sustained clinical benefits. Studies indicate that only about 30% of patients achieve full clinical remission with lithium monotherapy whereas 30–40% exhibit minimal clinical response. Reference Sportiche, Geoffroy, Brichant-Petitjean, Gard, Khan and Azorin8,Reference Hou, Heilbronner, Degenhardt, Adli, Akiyama and Akula9 Clinical causes and predictors of this response heterogeneity have been identified and summarised into a ‘clinical exemplar’ for optimal lithium response. Reference Nunes, Ardau, Berghöfer, Bocchetta, Chillotti and Deiana10,Reference Scott, Khayachi, Alda and Nunes11 Nevertheless, these clinical variables alone do not fully explain interindividual variability, Reference Papiol, Schulze and Heilbronner12 and in practice are difficult to comprehensively elicit from patients at the point of treatment decision. Therefore, the field has pursued the search for an objective biological predictor for the lithium-responsive phenotype that could support both clinicians and patients in their decision-making.
Previous studies have developed polygenic scores (PGSs) to predict lithium responsiveness in bipolar disorder, focusing on genetic risk profiles for related psychiatric conditions such as schizophrenia (SCZ), Reference Amare, Schubert, Hou, Clark and Papiol13 major depressive disorders (MDD) Reference Amare, Schubert, Hou, Clark, Papiol and Cearns14 attention-deficit hyperactivity disorder (ADHD) Reference Coombes, Millischer, Batzler, Larrabee, Hou and Papiol15 and on the lithium-responsiveness phenotype itself. Reference Sharew, Clark, Papiol, Heilbronner, Degenhardt and Fullerton16,Reference Amare, Thalamuthu, Schubert, Fullerton, Ahmed and Hartmann17 Although these PGSs have shown statistically significant associations with lithium treatment outcomes, each individual PGS explains only a small portion of the variability in lithium response – typically between 0.18 and 2.60%, indicating limited clinical utility when used alone. Reference Sharew, Clark, Schubert and Amare18–Reference Dudbridge20
An emerging approach to improving predictive accuracy is integrating PGSs for multiple phenotypes that share genetic architecture with the phenotype of interest. For example, Schubert et al meta-analysed the PGSs for MDD and SCZ and found a twofold increase in predictive capability compared with single-trait PGSs. Reference Schubert, Thalamuthu, Amare, Frank, Streit and Adl21 Another study by Albinana and colleagues combined 937 PGSs derived from multiple diseases and conditions that enhanced predictive accuracy for psychiatric diagnoses such as ADHD, affective disorder, autism spectrum disorder, bipolar disorder, anorexia nervosa and SCZ. Using this methodology, the explained variance for each diagnosis was four- to ninefold larger compared with a single-disorder PGS. Reference Zhu, Schork, Ingason, Aschard and Brikell22 Similarly, Krapohl et al used 81 Genome-Wide Association Studies (GWAS) of cognitive, medical and anthropometric phenotypes to predict educational achievement, general cognitive ability and body mass index (BMI). They found that the combined PGSs predicted 10.9% variance in educational achievement, 4.8% in general cognitive ability and 5.4% in BMI – representing increases of 10, 10 and 60%, respectively, compared with the best-performing single-score predictions. Reference Krapohl, Patel, Newhouse, Curtis, von Stumm and Dale23 These examples highlight the potential value of harnessing the shared genetic architecture of multiple phenotypes to improve the predictive power of PGSs for complex traits such as lithium response in bipolar disorder.
Aims
In the current study, we applied supervised machine learning methods within a multi-trait PGS (mt-PGS) framework to predict lithium responsiveness in patients with bipolar disorder. By integrating PGSs from multiple phenotypes previously implicated in bipolar disorder pharmacology and/or aetiology, we evaluated whether the mt-PGS approach would improve predictive performance. Additionally, we explored the relative contribution of each phenotype-specific PGS to lithium response, providing insights into its genetic relationship with lithium response phenotype.
Method
This study adheres to the Transparent Reporting of a multivariable Prediction model for Individual Prognosis Or Diagnosis – Artificial Intelligence (TRIPOD-AI) guideline Reference Collins, Moons, Dhiman, Riley, Beam and Van Calster24 to report the findings. The completed TRIPOD-AI checklist is provided in the supplementary material.
Data source and patient population
We utilised data from the International Consortium on Lithium Genetics (ConLi+Gen; http://www.conligen.org/), a global initiative investigating the genetic basis of lithium response in bipolar disorder. For this analysis, we included 2367 patients of European ancestry who received lithium and were followed up for a minimum of 6 months. Participants were recruited from Europe, North America, Asia and Australia between 2008 and 2013. Reference Schulze, Alda, Adli, Akula, Ardau and Bui25 Detailed characteristics of this cohort, including clinical and demographic information, are available elsewhere. Reference Hou, Heilbronner, Degenhardt, Adli, Akiyama and Akula9
Target outcome measure
The Retrospective Criteria of Long-Term Treatment Response in Research Subjects with Bipolar Disorder score (Alda scale), a validated retrospective criteria of long-term treatment response in research subjects, was used to assess patients’ response to lithium treatment. Reference Manchia, Adli, Akula, Ardau, Aubry and Backlund26,Reference Grof, Duffy, Cavazzoni, Grof, Garnham and MacDougall27 This scale quantifies the degree of improvement during lithium therapy by combining changes in the frequency and severity of mood symptoms into an A score (ranging from 0 to 10). To account for potential confounding factors influencing symptom improvement, the scale also incorporates a B score that considers five confounders, each scored 0, 1 or 2. The total score is then derived by subtracting the total B score from the A score. The detailed procedures for Alda scale measurement are described elsewhere. Reference Manchia, Adli, Akula, Ardau, Aubry and Backlund26,Reference Grof, Duffy, Cavazzoni, Grof, Garnham and MacDougall27 For this study, lithium treatment outcome was defined both as a continuous outcome (Alda score) and a categorical outcome, with those patients having a total score of 7 or higher classified as ‘favourable responders’ and those with a score less than 7 classified as ‘unfavourable responders’. Reference Hou, Heilbronner, Degenhardt, Adli, Akiyama and Akula9,Reference Grof, Duffy, Cavazzoni, Grof, Garnham and MacDougall27
An overview of the steps involved in developing mt-PGS and the data analysis procedures is outlined in Fig. 1.
The detailed steps for developing mt-PGS and data analysis procedures. (a) Polygenic score development and feature clustering. (b) Supervised machine learning modelling. mt-PGS, multi-trait polygenic score; GWAS, Genome-Wide Association Study; PGS, polygenic score; XGBoost, extreme gradient-boosted decision tree-based ensembles; R 2, explained variance; RMSE, root mean squared error; MAE, mean absolute error; AUC, area under the curve; PPV, positive predictive value; NPV, negative predictive value.

Fig. 1 Long description
Panel A: The diagram shows the process of developing polygenic scores (PGS) from genome-wide association studies (GWAS) for 60 selected phenotypes. It includes the clustering of these phenotypes into five clinical-biological clusters: Psychiatric and behavioural, Autoimmune/inflammatory, Cardiometabolic, Renal function, and Neurocognitive. Panel B: The diagram depicts the use of supervised machine learning models, specifically Elastic-net regularisation and XGBoost algorithm, to predict lithium treatment outcomes. The outcomes are measured using various metrics such as R-squared, RMSE, MAE, Pseudo-R-squared, AUC, PPV, NPV, specificity, sensitivity, and F1 score.
Step 1: Selection of phenotypes
For this study, we selected 60 phenotypes previously implicated in and/or potentially sharing a genetic architecture with the pharmacology or aetiology of bipolar disorder. The included phenotypes comprised psychiatric disorders and clinical–behavioural traits, Reference Grotzinger28 cardiometabolic traits, Reference Amare, Schubert, Klingler-Hoffmann, Cohen-Woods and Baune29 cognitive functions, Reference Smeland, Kutrolli, Bahrami, Fominykh, Parker and Fuhrer30 autoimmune and inflammatory conditions Reference Herrera-Rivero, Gutiérrez-Fragoso, Kurtz and Baune31 and renal function biomarkers. Reference Yu, Lin, Yang, Jin, Liao and Lu32 Details of the phenotype screening process, and a narrative review showing the biological and clinical implications of each phenotype for bipolar disorder pharmacology or aetiology, are provided in the Supplementary Methods. Briefly, the selection process involved downloading all available GWASs reported in the GWAS catalogue and other databases, resulting in 63 967 GWAS summary statistics across 12 767 phenotypes as of 26 April 2024. We excluded phenotypes derived from multi-omics studies, including proteomic, metabolomic and lipidomic, as well as blood cell measurement and rare copy variants-based GWAS. Phenotypes from studies conducted in non-European ancestries and those with limited clinical relevance to bipolar disorder pharmacology or aetiology were also excluded. Finally, 60 phenotypes that appeared in the narrative review and had corresponding GWAS summary data were considered for the final analyses. We provide Supplementary Fig. 1 showing the screening process of phenotypes from the GWAS catalogue and other databases.
Step 2: Computing PGSs and building a mt-PGS library
To develop PGSs, we extracted publicly available summary statistics (discovery data) for the selected phenotypes from the GWAS catalogue (https://www.ebi.ac.uk/gwas/), GWAS Atlas (https://atlas.ctglab.nl/), GIANT consortium (https://portals.broadinstitute.org/collaboration/giant/index.php/GIANT_consortium), CNCR – CTG lab (https://cncr.nl/ctg/) and Psychiatric Genomics Consortium (https://www.med.unc.edu/pgc). Detailed characteristics of the GWAS summary statistics used are provided in Supplementary Table 2.
Before developing the PGSs, genotype data from the ConLi+Gen consortium (target sample) underwent standard quality control and imputation procedures, as previously described. Reference Hou, Heilbronner, Degenhardt, Adli, Akiyama and Akula9,Reference Amare, Schubert, Hou, Clark and Papiol13,Reference Amare, Schubert, Hou, Clark, Papiol and Cearns14,Reference Amare, Thalamuthu, Schubert, Fullerton, Ahmed and Hartmann17,Reference Schubert, Thalamuthu, Amare, Frank, Streit and Adl21 A brief summary of the genotyping, quality control and imputation steps is provided in Supplementary Methods.
Using the GWAS summary statistics described above, the quality control-filtered individuals and single-nucleotide proteins from the ConLi+Gen sample and the precomputed linkage disequilibrium of the 1000 Genome European external reference panel, PGSs for each phenotype were computed. The polygenic risk score–continuous shrinkage scoring method was employed to construct the PGS for each phenotype. Reference Ge, Chen, Ni, Feng and Smoller33 Subsequently, we constructed an agnostic PGS library for the selected phenotypes. Each score was standardised to a zero mean and unit variance. Detailed information on the computation of PGSs is available in Supplementary Methods.
Step 3: Phenotype clustering for dimensionality reduction
Because the number of features in this study (#60) was large relative to the sample size, a clustering strategy was implemented for dimensionality reduction. The numbers of clusters and cluster labels were assigned following expert consultation involving two psychiatrists and one genetic epidemiologist. These experts also independently reviewed and confirmed the assignment of each phenotype to the respective clusters (Supplementary Table 3). Accordingly, the phenotypes were grouped into five clinically and biologically informed clusters: psychiatric disorders and clinical–behavioural phenotypes (or ‘psychiatric and behavioural’) (#23), cardiometabolic (#17), autoimmune/inflammatory (#5), neurocognitive (#8) and renal function (#7) (Supplementary Table 4).
The optimal number of features per cluster was determined using the R package pmsampsize, Reference Riley, Ensor, Snell, Harrell, Martin and Reitsma34 which indicated that clusters containing approximately 10–18 features were appropriate for the available sample size (Supplementary Methods).
Step 4: Developing mt-PGS using machine learning models
We trained an elastic-net regression for the continuous outcome and extreme gradient-boosted decision tree-based ensembles (XGBoost) for the categorical outcome using fivefold nested cross-validation within each cluster. Our data-set was partitioned into inner-loop training folds (80%, N = 1894) and an outer-loop testing fold (20%, N = 473). The inner and outer loops were independent, and prediction scores and performance metrics were aggregated across all outer-loop folds. The inner folds were used to tune hyperparameters and minimise cross-validation error, while the model was trained on the entire inner training set and evaluated on omitted data from the outer fold. This procedure was repeated for each outer fold, after which the pooled predictions from unseen test data were compared against the ground-truth outcomes. Reference Lewis, Spiliopoulou, Goldmann, Pitzalis, McKeigue and Barnes35 Features retained from the cluster-level analysis were then combined for the final mt-PGS analysis. A step-by-step analysis procedure for developing mt-PGS models is available in Supplementary Methods, and the flow diagram is shown in Supplementary Fig. 2. Detailed modelling procedures for each outcome are described below.
Continuous outcome model (A)
Elastic-net regularisation regression was employed because of the substantial genetic correlations among selected predictors within and across clusters in our data. By blending the penalties of ridge and LASSO regression, elastic-net effectively handles correlated predictors while simultaneously performing feature selection, thereby improving model stability, predictive performance and interpretability compared with either method alone. Reference Lewis, Spiliopoulou, Goldmann, Pitzalis, McKeigue and Barnes35–Reference Zou and Hastie37 We used 5 inner folds and evaluated a hyperparameter range of 0.05 to 1.00 with steps of 0.05 for the regularisation strength parameter (α). Details of the hyperparameter space are provided in Supplementary Table 1. The predictive performance of models was assessed using R 2, root mean squared error (RMSE) and mean absolute error (MAE) for each cluster and the final mt-PGS models. We ranked the contribution of features to the continuous outcome based on their absolute standardised coefficient in the final mt-PGS model.
Categorical outcome model (B)
The XGBoost algorithm was selected for the categorical outcome due to its remarkable accuracy and adaptability, by capturing complex, non-linear relationships and correlations among predictors through sequential gradient-boosting that iteratively learns from previous prediction errors. Reference Chen and Guestrin38,Reference Friedman39 In addition, the algorithm can accommodate class imbalance through class-weighting, making it suitable for our data-set, which comprised 660 responders and 1707 non-responders to lithium treatment. Reference Tanha, Abdi, Samadi, Razzaghi and Asadpour40 Furthermore, feature importance was evaluated using Shapley additive explanation (SHAP) values, which quantify the contribution of each predictor to the model output and identify the most important polygenic predictors. Reference Lundberg, Erion, Chen, DeGrave, Prutkin and Nair41 XGBoost has also demonstrated robust predictive performance across a range of biomedical applications, including psychiatric genetics and mood disorder classification, where it has frequently outperformed conventional machine learning approaches in capturing complex disease architectures. Reference Gao, Calhoun and Sui42,Reference Lee, Kim, Park, Gan, Son and Park43 A learning rate (η) of 0.3, a minimum loss reduction (Υ, Lagrangian multiplier) of 0, a maximum tree depth of 6 and cyclic feature selector hyperparameter spaces were applied (see Supplementary Table 1 for further details on the hyperparameter space). Model discrimination, the accuracy of classification models, was evaluated using area under the curve (AUC), balanced accuracy, accuracy, negative and positive predictive values, sensitivity, specificity and F1 score. Model calibration was evaluated for the classification models using out-of-fold predicted probabilities obtained from the outer loop of nested cross-validation. Predicted probabilities were truncated to the interval 1.0 × 10⁻⁶ to 1.0 – (1 × 10⁻⁶), prior to logit transformation to avoid numerical instability. Overall calibration performance was assessed using the Brier score, which quantifies the proximity of predicted probabilities to observed outcomes; this score ranges from 0 to 1, where lower values indicate superior model performance. Additionally, bootstrap bias-corrected calibration curves were plotted to examine agreement between predicted and observed probabilities. Reference Huang, Li, Macheret, Gabriel and Ohno-Machado44 The R package ‘boost’ was used to bootstrap a 95% confidence interval for prediction performance metrics with 500 bootstrap replicates and the ‘perc’ method. Class weights were applied based on the ratio of responders and non-responders to achieve balanced predictions for imbalanced data, and to assign greater importance to misclassifications of the underrepresented class during optimisation. McFadden pseudo-R 2 was calculated and the reported observed R 2 was transformed to a liability scale, Reference Lee, Wray, Goddard and Visscher45 taking into account a lithium responsiveness prevalence of 30% Reference Hou, Heilbronner, Degenhardt, Adli, Akiyama and Akula9 and the proportion of lithium responders to non-responders in the target cohort. Finally, the importance of features was ranked using the mean SHAP value, which determines the contribution of each feature to the categorical outcome in the final mt-PGS model. The SHAP value is the average marginal contribution of a feature value across all possible coalitions in the XGBoost models. Reference Lundberg, Erion, Chen, DeGrave, Prutkin and Nair41
All machine learning analyses were conducted in R version 4.3.1 for Windows (R Foundation for Statistical Computing, Vienna, Austria; https://www.r-project.org/) using the Caret package version 6.0-94 for Windows (Max Kuhn et al; https://cran.r-project.org/package=caret).
Ethical standards
The Ethics Committee at the University of Heidelberg provided central ethical approval for the consortium, and written consent was obtained from all participants according to the study protocols of each of the participating sites and their institutions. All procedures were performed according to the Declaration of Helsinki guidelines. Reference Hou, Heilbronner, Degenhardt, Adli, Akiyama and Akula9
Results
Cohort characteristics
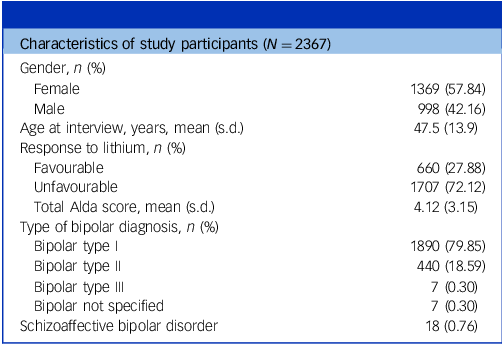
A total of 2367 patients with bipolar disorder who had been treated with lithium for at least 6 months were included in this study. Nearly 60% of participants were female and mean age was 47.53 ± 13.73 years. Of the total sample, 660 patients (27.9%) responded favourably to lithium treatment and the mean Alda total score was 4.12 ± 3.15. Detailed sample characteristics of the cohort can be found in previous publications Reference Hou, Heilbronner, Degenhardt, Adli, Akiyama and Akula9,Reference Amare, Schubert, Hou, Clark and Papiol13,Reference Amare, Schubert, Hou, Clark, Papiol and Cearns14,Reference Amare, Thalamuthu, Schubert, Fullerton, Ahmed and Hartmann17,Reference Schubert, Thalamuthu, Amare, Frank, Streit and Adl21 and in Table 1.
Characteristics of the study participants

Table 1 Long description
A table with 7 rows and 2 columns detailing characteristics of 2367 study participants. Row 1: Gender, Female, 1369 (57.84 percent). Row 2: Gender, Male, 998 (42.16 percent). Row 3: Age at interview, years, mean (standard deviation), 47.5 (13.9). Row 4: Response to lithium, Favourable, 660 (27.88 percent). Row 5: Response to lithium, Unfavourable, 1707 (72.12 percent). Row 6: Total Alda score, mean (standard deviation), 4.12 (3.15). Row 7: Type of bipolar diagnosis, Bipolar type 1, 1890 (79.85 percent). Row 8: Type of bipolar diagnosis, Bipolar type 2, 440 (18.59 percent). Row 9: Type of bipolar diagnosis, Bipolar type 3, 7 (0.30 percent). Row 10: Type of bipolar diagnosis, Bipolar not specified, 7 (0.30 percent). Row 11: Type of bipolar diagnosis, Schizoaffective bipolar disorder, 18 (0.76 percent).
Alda score, Retrospective Criteria of Long-Term Treatment Response in Research Subjects with Bipolar Disorder.
Polygenic scores derived from 60 phenotypes were analysed. Pairwise genetic correlation (rg) analyses across these 1770 phenotype pairs showed 409 statistically significant positive correlations and 263 statistically significant negative correlations (p < 0.05). Full genetic correlation results are shown in Supplementary Table 5, with a heatmap of phenotypes in the final models presented in Supplementary Fig. 3.
Multi-trait polygenic model for lithium response (continuous outcome)
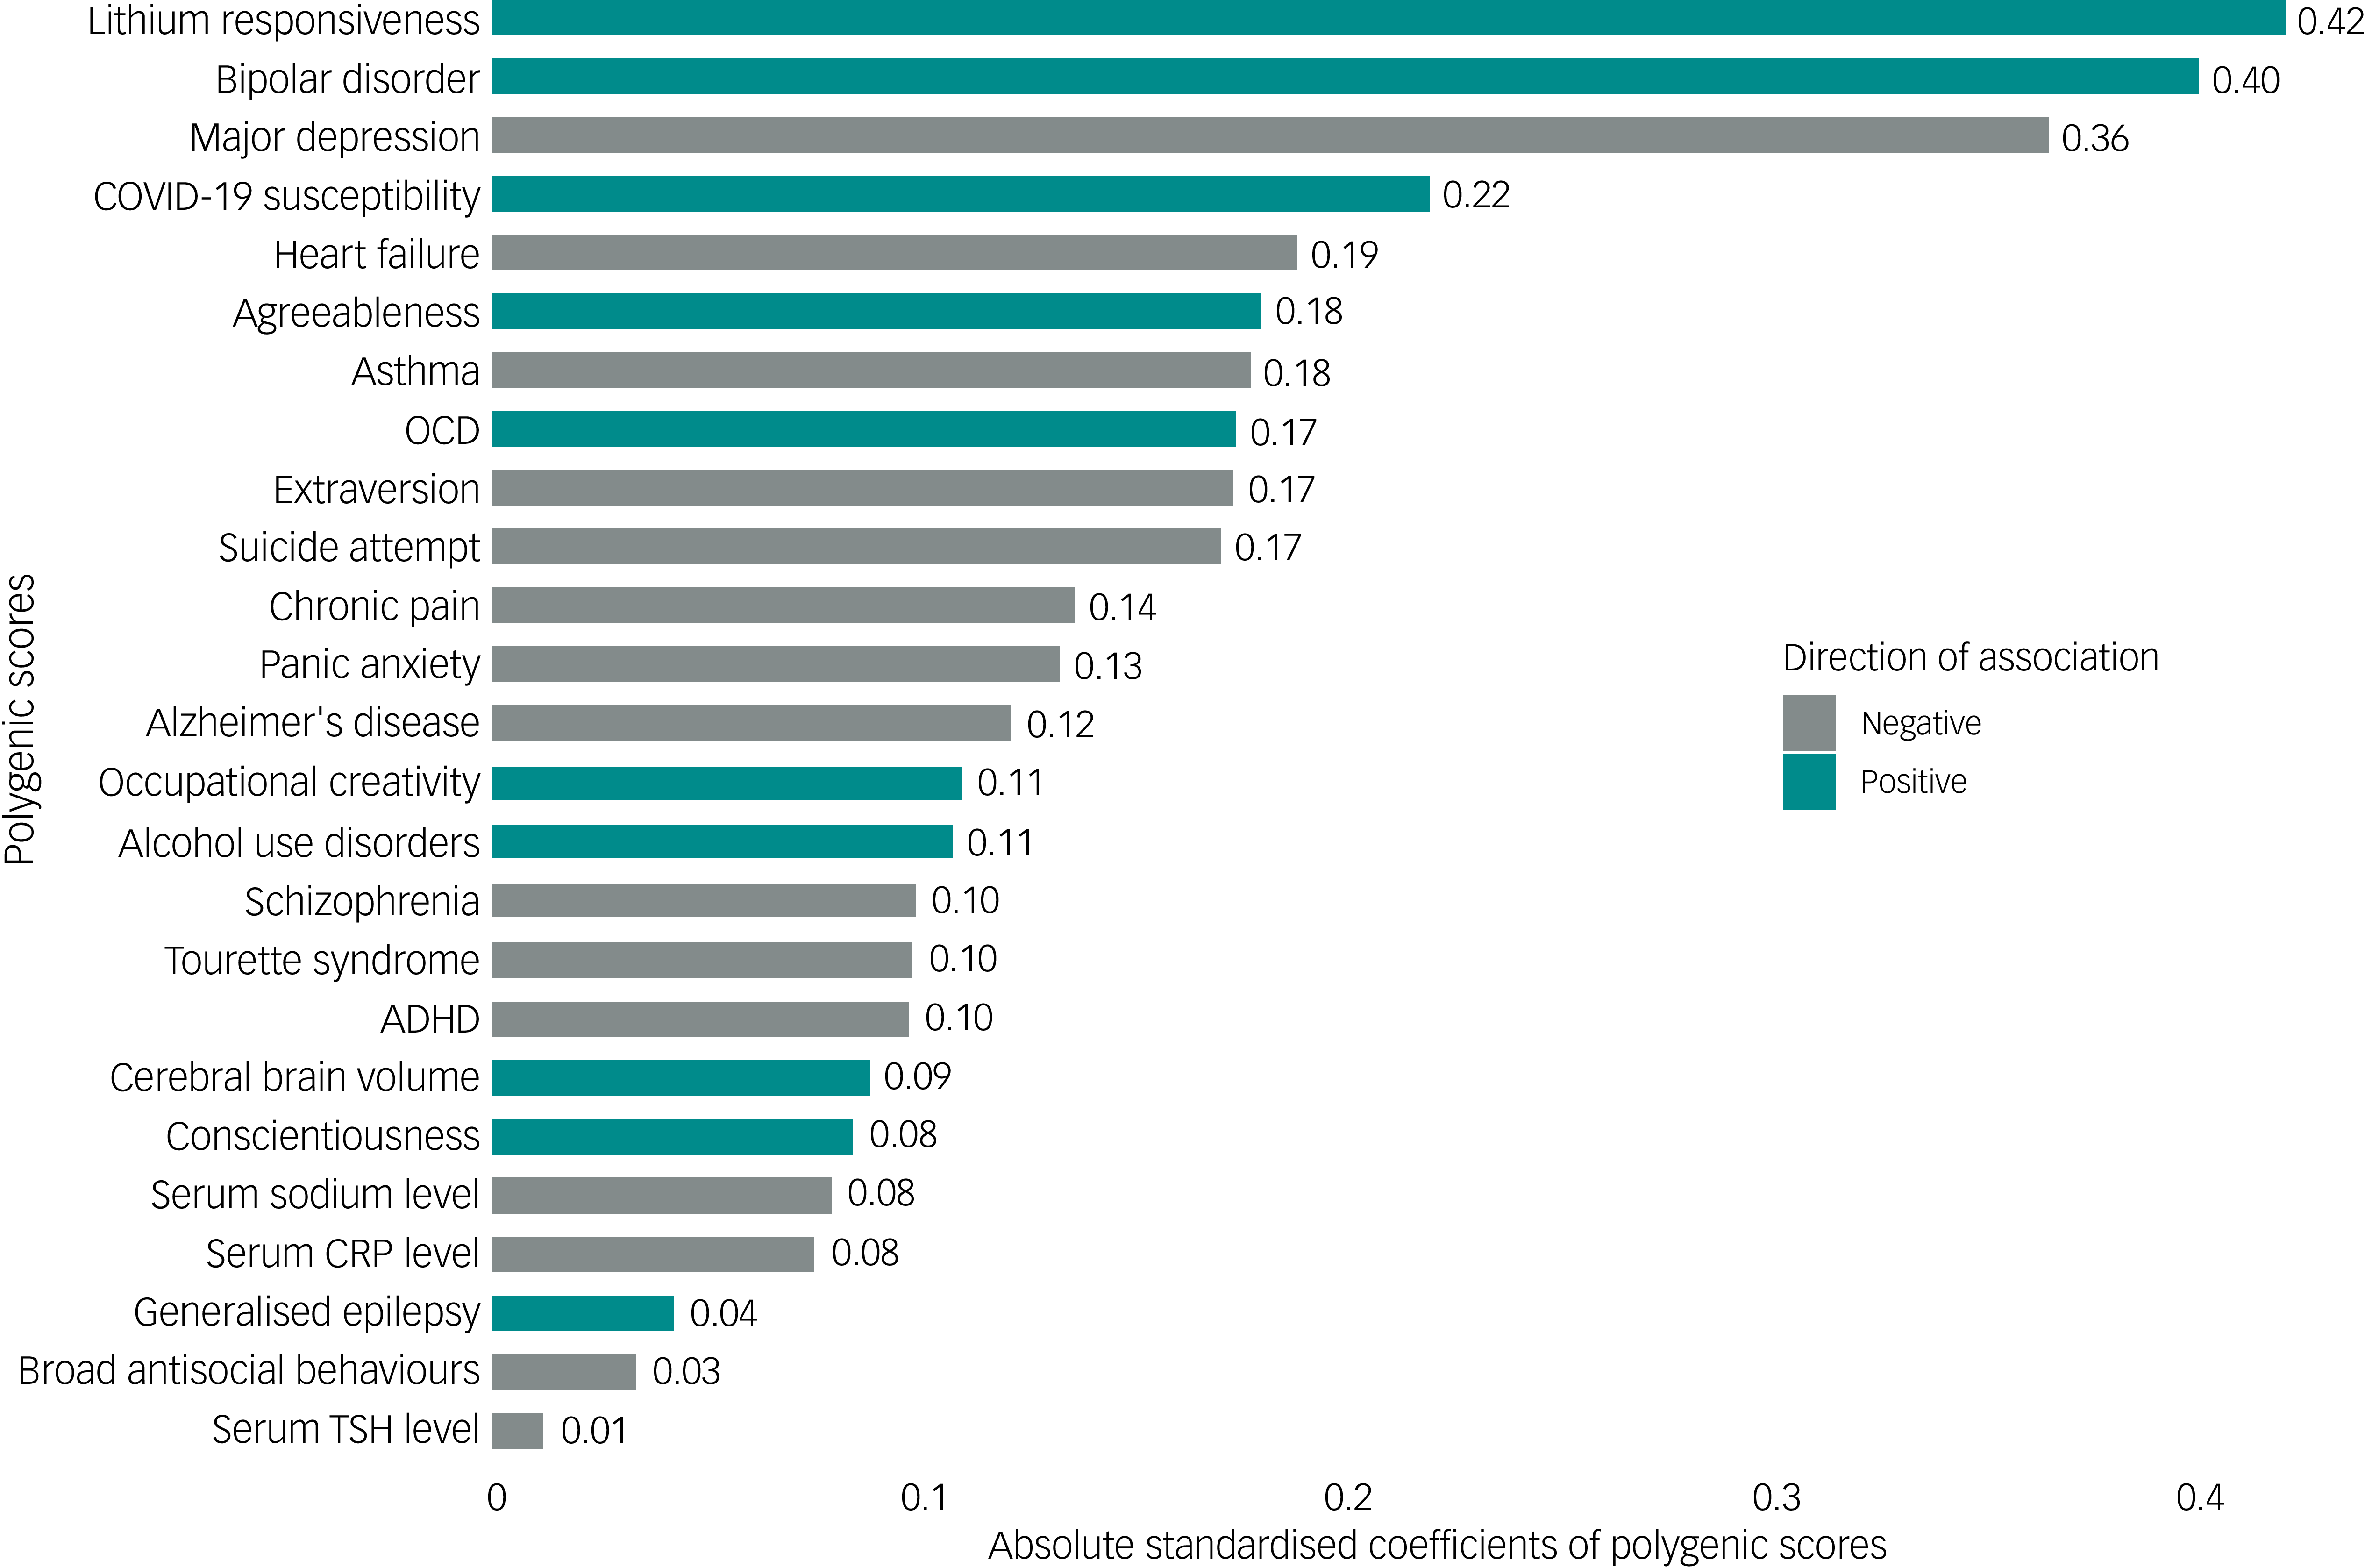
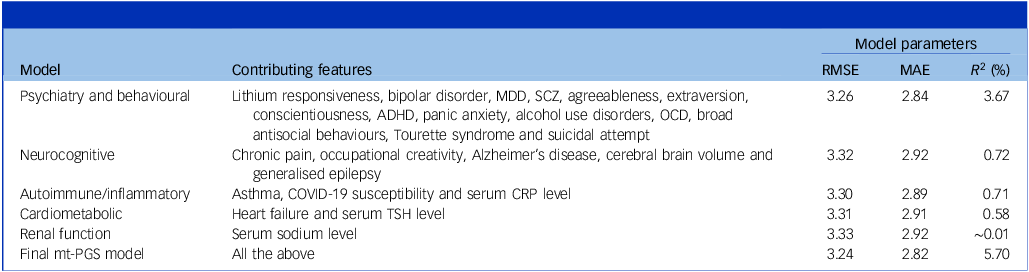
The final mt-PGS model combining PGSs from 25 phenotypes across 5 clusters explained 5.70% of the variance in lithium responsiveness (RMSE = 3.26, MAE = 2.84; see Table 2 for full details). The top ten contributing PGSs for the final mt-PGS model were scores for lithium responsiveness, bipolar disorder, major depression, COVID-19 susceptibility, heart failure, agreeableness, asthma, obsessive–compulsive disorder (OCD), extraversion and suicide attempt (see Fig. 2).
Retained polygenic scores in the final mt-PGS model of continuous outcome. mt-PGS, multi-trait polygenic score; OCD, obsessive–compulsive disorder; ADHD, attention-deficit hyperactivity disorder; CRP, C-reactive protein; TSH, thyroid-stimulating hormone.

Continuous outcome model parameters in cluster-level and combined cluster models

Table 2 Long description
A table with five rows and five columns. The columns are labeled Model, Contributing features, RMSE, MAE, and R-squared (percent). The rows are labeled Psychiatry and behavioural, Neurocognitive, Autoimmune/inflammatory, Cardiometabolic, Renal function, and Final mt-PGS model. The table lists the contributing features and model parameters for each model. For Psychiatry and behavioural, the contributing features include lithium responsiveness, bipolar disorder, MDD, SCZ, agreeableness, extraversion, conscientiousness, ADHD, panic anxiety, alcohol use disorders, OCD, broad antisocial behaviours, Tourette syndrome, and suicidal attempt, with RMSE 3.26, MAE 2.84, and R-squared 3.67 percent. For Neurocognitive, the contributing features include chronic pain, occupational creativity, Alzheimer’s disease, cerebral brain volume, and generalised epilepsy, with RMSE 3.32, MAE 2.92, and R-squared 0.72 percent. For Autoimmune/inflammatory, the contributing features include asthma, COVID-19 susceptibility, and serum CRP level, with RMSE 3.30, MAE 2.89, and R-squared 0.71 percent. For Cardiometabolic, the contributing features include heart failure and serum TSH level, with RMSE 3.31, MAE 2.91, and R-squared 0.58 percent. For Renal function, the contributing feature is serum sodium level, with RMSE 3.33, MAE 2.92, and R-squared approximately 0.01 percent. For the Final mt-PGS model, the contributing features include all the above, with RMSE 3.24, MAE 2.82, and R-squared 5.70 percent.
RMSE, root mean squared error; MAE, mean absolute error; R 2, explained variance; MDD, major depressive disorder; SCZ, schizophrenia; ADHD, attention-deficit hyperactivity disorder; OCD, obsessive–compulsive disorder; COVID-19, coronavirus 19; CRP, C-reactive protein; TSH, thyroid-stimulating hormone; mt-PGS, multi-trait polygenic score.
Cluster-level analysis showed that the psychiatric and behavioural (14 phenotypes), neurocognitive (5), autoimmune/inflammatory (3) and cardiometabolic (2) clusters explained 3.67, 0.72, 0.71 and 0.58% of the variability in lithium responsiveness, respectively. The renal function cluster contributed the least to the overall model, with the PGS for serum sodium level accounting for only ∼0.01% of the variance in lithium responsiveness. A detailed breakdown of variance, explained by cluster-wise model and the final mt-PGS model, is provided in Table 2.
Multi-trait polygenic model for lithium response (categorical outcome)
Of the 60 PGSs initially considered, 21 were retained in the final mt-PGS model, collectively explaining 9.11% of the variance in lithium responsiveness on the liability scale (McFadden pseudo-R 2, s.e. = 0.017), and resulted in a prediction accuracy of 68.24% (95% CI: 64.98–71.66, Brier score 0.257) for lithium responders. The top contributing features in order of importance were as follows: the PGS for lithium responsiveness was the most dominant feature contributor to the final mt-PGS model parameters for the categorical outcome, followed by agreeableness, panic anxiety, chronic pain, OCD, Tourette syndrome, COVID-19 susceptibility, bipolar disorder, treatment-resistant schizophrenia and serum C-reactive protein (CRP) level (see Fig. 3).
The top 20 polygenic scores contributing to the final mt-PGS model of categorical outcome, ranked by importance from most to least (top to bottom). mt-PGS, multi-trait polygenic score; CRP, C-reactive protein; ADHD, attention-deficit hyperactivity disorder; SHAP, Shapley additive explanation; OCD, obsessive–compulsive disorder.

Cluster-level analyses showed that PGSs from the psychiatric and behavioural, autoimmune/inflammatory, neurocognitive and cardiometabolic clusters explained, respectively, 6.52, 1.88, 1.64 and 0.68% of the variance in lithium responsiveness in liability scale, with corresponding AUCs of 62.98% (95% CI: 58.26–66.07, Brier score 0.264), 55.37% (95% CI: 51.62–59.30, Brier score 0.28), 51.99% (95% CI: 48.43–55.98, Brier score 0.279) and 52.43% (95% CI: 48.79–56.21, Brier score 0.298). No phenotype in the renal function cluster contributed meaningfully to lithium responsiveness (categorical outcome). The bootstrap bias-corrected calibration curves for all categorical models are provided in Supplementary Fig. 4. A full summary of the categorical outcome model parameters in cluster-wise and final mt-PGS models is provided in Supplementary Table 6.
Discussion
This study demonstrates that a mt-PGS approach, integrating genetic risk information across a broad range of phenotypes implicated in lithium pharmacology and/or the aetiology of bipolar disorder, substantially improves the prediction of lithium treatment response. The mt-PGS explained 5.70 and 9.11% of variance in the continuous and categorical lithium treatment outcomes, respectively, achieving an AUC of 68.24% (95% CI: 64.98–71.66). These results represent a substantial improvement over previously reported single-trait PGSs, such as those based on SCZ, Reference Amare, Schubert, Hou, Clark and Papiol13 MDD, Reference Amare, Schubert, Hou, Clark, Papiol and Cearns14 both SCZ and MDD, Reference Schubert, Thalamuthu, Amare, Frank, Streit and Adl21 ADHD Reference Coombes, Millischer, Batzler, Larrabee, Hou and Papiol15 or lithium responsiveness itself, Reference Amare, Thalamuthu, Schubert, Fullerton, Ahmed and Hartmann17 which typically explained only 1.0–2.6% of the variance in lithium responsiveness. However, the model predictive performance remained lower than that observed in previous work combining meta-analysed PGSs for MDD and SCZ with clinical data, Reference Cearns, Amare, Schubert, Thalamuthu, Frank and Streit46 underscoring the value of integrating mt-PGS with clinical phenotypic features to further improve prediction and support potential clinical translation. The superior performance of the mt-PGS model over single-trait PGSs is probably due to several factors. First, by leveraging polygenic information from multiple, genetically correlated phenotypes, the model captures a broader and more relevant spectrum of genetic variance. Reference Grotzinger28 This approach aligns with recent research showing that multi-trait models, especially those integrating traits with shared biological pathways, consistently outperform single-trait models in complex trait prediction. Reference Schubert, Thalamuthu, Amare, Frank, Streit and Adl21,Reference Xu, Ganesh and Zhou47 Second, the inclusion of PGSs from medical and behavioural phenotypes that are already known to be associated with psychiatric conditions, as well as pharmacogenomic phenotypes, increases statistical power and biological specificity. Reference Singh, Stocco, Theken, Dickson, Feng and Karnes48
Polygenic scores for phenotypes within the psychiatric and behavioural cluster emerged as the most strongly associated features in predicting lithium responsiveness, with R 2 of 3.67% in the continuous outcome model and McFadden pseudo-R 2 of 6.52% in the categorical outcome model. This strong association is expected, given that the psychiatric and behavioural phenotype shares a similar genetic architecture with both bipolar disorder and lithium responsiveness, as established in previous genetic studies. Reference Grotzinger28 Of the individual phenotypes, the top predictors were the PGSs for bipolar disorder and the lithium responsiveness phenotype, both of which positively associated with clinical lithium response, echoing earlier research Reference Amare, Thalamuthu, Schubert, Fullerton, Ahmed and Hartmann17 and supporting the idea that individuals with a higher genetic predisposition for bipolar disorder and lithium response are more likely to benefit from lithium treatment. Conversely, PGSs for MDD, SCZ, ADHD, panic anxiety and broad antisocial behaviour were negatively associated with lithium responsiveness. These findings may appear counterintuitive, given the substantial genetic correlation between bipolar disorder and MDD or SCZ (rg ∼ 0.7). Reference Ruderfer, Ripke, McQuillin, Boocock, Stahl and Pavlides49 However, a positive correlation does not mean that all MDD/SCZ-related genetic variation increases bipolar disorder liability or influences lithium response in the same level of effect and/or consistent direction. Instead, there are shared and unique components, some of which may relate differently to treatment response. This is in line with clinical observations Reference Amare, Schubert, Hou, Clark and Papiol13–Reference Coombes, Millischer, Batzler, Larrabee, Hou and Papiol15,Reference Schubert, Thalamuthu, Amare, Frank, Streit and Adl21 showing that there might be a unique biological signature of bipolar disorder directly linked to better lithium response but not shared with MDD or SCZ. Statistically, our mt-PGS model can simultaneously adjust for bipolar disorder, SCZ and MDD PGSs and separate their overlapping and non-overlapping genetic components, reducing the counterintuitive effects.
Consistent with previous findings in psychiatric pharmacotherapy, Reference Bucher, Suzuki and Samuel50 positive associations were observed between agreeableness and conscientiousness personality traits and lithium treatment response. These associations may be mediated through underlying genetic mechanisms Reference Lo, Hinds, Tung, Franz, Fan and Wang51 and/or through the influence of these traits on medication adherence and therapeutic engagement, and supportive behaviours. Reference Bucher, Suzuki and Samuel50 The findings were further supported by genetic evidence showing that the PGSs for openness and conscientiousness have previously been associated with favourable antidepressant treatment outcomes, such as response and remission. Reference Amare, Schubert, Tekola-Ayele, Hsu, Sangkuhl and Jenkins52 Collectively, these converging lines of evidence suggest that personality traits may represent broadly generalisable modifiers of psychotropic treatment response across diagnostic categories, potentially via shared genetic mechanisms and/or observable behavioural, cognitive and affective mechanisms that influence treatment adherence, symptom perception, stress reactivity and clinician–patient interaction. Reference Rayner, Coleman, Purves, Cheesman, Hübel and Gaspar53
Autoimmune and inflammatory PGSs explained a modest but notable proportion of lithium responsiveness, accounting for 0.71–1.64% of the variance. Within this group, PGSs for asthma and serum CRP levels were negatively associated with lithium response, indicating that individuals with higher genetic risk for these inflammatory conditions are less likely to benefit from lithium treatment. This finding aligns with the established role of inflammation in bipolar disorder, where elevated CRP and chronic low-grade inflammation are linked to greater symptom severity and shorter duration of effective lithium therapy. Lithium’s recognised immune-modulating properties, including its influence on proinflammatory cytokine regulation, Reference Rybakowski54 may underlie some of its therapeutic effects in mood disorders. The negative association between serum CRP PGS and lithium response supports the hypothesis that lithium’s anti-inflammatory action could be a key mechanism in its efficacy, and that individuals with a genetic predisposition to greater inflammation may experience less benefit. Reference Queissner, Lenger, Birner, Dalkner, Fellendorf and Bengesser55 Furthermore, immune-related gene sets have been shown to be overrepresented in lithium resistance, with activation of inflammatory and adaptive immune pathways observed in non-responders. Reference Herrera-Rivero, Gutiérrez-Fragoso, Kurtz and Baune31
Interestingly, the study found a significant positive association between the PGS for COVID-19 susceptibility and lithium response. This is perhaps surprising, but lithium has demonstrated antiviral properties including activity against COVID-19, in preclinical studies. Reference Murru, Manchia, Hajek, Nielsen, Rybakowski and Sani56 In addition, epidemiological evidence indicates that individuals treated with lithium have a decreased risk of respiratory infections, Reference Landén, Larsson, Lichtenstein, Westin and Song57 supporting broader immunoprotective or anti-inflammatory effects. One possible explanation is that genetic variants conferring susceptibility to COVID-19 may overlap with immune pathways that also enhance lithium’s therapeutic effects, or that individuals with these variants may have an immune profile that is particularly responsive to lithium’s modulatory actions. However, this association warrants further investigation to clarify the underlying biological mechanisms.
We observed a negative association between PGSs for heart failure, serum TSH levels and Alzheimer’s disease with lithium responsiveness. This suggests that individuals with a higher genetic predisposition to these phenotypes are less likely to respond favourably to lithium treatment. Although these results seem to be in conflict with lithium’s established neuroprotective Reference Forlenza, De-Paula and Diniz58 and cardioprotective actions, Reference Jiang, He and Huang59 it might be because these conditions are characterised by advanced pathological changes, including chronic inflammation, oxidative stress, mitochondrial impairment, neuronal loss and disrupted neurovascular coupling, that counteract lithium’s protective mechanisms. Reference Malhi and Outhred60 Cardiometabolic diseases such as heart failure have been associated with an increased risk of renal impairment, which can reduce lithium clearance leading to lithium accumulation and toxicity, thereby altering its therapeutic efficacy. Reference Jankowski, Floege, Fliser, Bohm and Marx61 Hypothyroidism is a well-documented side-effect of long-term lithium therapy, and a high genetic loading for this condition may reduce the therapeutic benefits of lithium. Reference Shine, McKnight, Leaver and Geddes62 From a clinical perspective, our results should therefore be viewed as risk-stratification signals rather than treatment-exclusion criteria. They highlight the importance of considering broader biological vulnerability, including neurodegenerative and cardiometabolic burden, when evaluating expected lithium response, while reinforcing the fact that lithium remains an appropriate and potentially protective treatment for many patients. Additional factors, such as treatment adherence, medical comorbidity and illness chronicity, may further contribute to these associations and warrant investigation in larger, longitudinal studies.
Chronic pain emerged as a top contributor and showed a negative association with lithium treatment response. This may reflect lithium’s interactions with pain-modulation pathways; lithium has been shown to inhibit neuromodulators such as substance P and vasoactive intestinal peptide, which are implicated in the perception of pain. Reference Reavis, Abrams, Dimas, Meier and Fusick63 Elevated substance P levels have been reported in MDD and chronic pain, providing a plausible biological context for the poorer lithium response observed in patients with comorbid MDD and chronic pain, a subgroup characterised by high rates of treatment resistance. Reference Baig-Ward, Jha and Trivedi64 In addition, the observed strong genetic correlation between chronic pain and MDD may further influence lithium treatment response.
Limitations
Our study should be interpreted in light of important limitations. First, although the ConLi+Gen cohort represents the largest available data-set for studying lithium treatment outcomes in bipolar disorder, its sample size remains modest compared with cohorts used in other large-scale genetic studies. This limitation may reduce the statistical power to generate highly precise PGSs and could affect the stability of our findings. Reference Hou, Heilbronner, Degenhardt, Adli, Akiyama and Akula9,Reference Zhai, Mehrotra and Shen19,Reference Dudbridge20 Second, the application of machine learning analyses to a relatively small sample raises the possibility of overfitting, which can artificially inflate prediction accuracy. Reference Lewis, Spiliopoulou, Goldmann, Pitzalis, McKeigue and Barnes35 Although we employed nested cross-validation and careful hyperparameter tuning to mitigate this risk, the potential for overestimation of predictive performance cannot be entirely excluded. Third, although our model explains a greater proportion of the variance in lithium responsiveness than that reported in previous studies, its overall accuracy and calibration are poor, indicating important limitations for direct clinical translation. Fourth, our analysis was restricted to individuals of European ancestry, which means the findings may not be generalisable to populations with different genetic backgrounds and could limit the broader applicability of our results. Fifth, our PGSs were constructed using GWAS summary statistics, which primarily capture common genetic variants and may miss the influence of rare variants that could also affect lithium response. Sixth, the PGS for lithium responsiveness was calculated using the ConLi+Gen cohort as both the discovery and target data-set, employing a leave-one-country-out procedure. This approach may overestimate the effect of the lithium responsiveness phenotype and therefore requires validation analysis using an independent target cohort. Seventh, the predictive performance of each PGS depends on the sample size of the target cohort (discovery GWAS) and trait heritability, which may have influenced the selection of PGSs retained in our models. Finally, the set of polygenic predictors/phenotypes selected within each cluster may not be exhaustive or fully representative of all features potentially associated with lithium responsiveness, because additional relevant predictors may yet be identified as the field advances. These limitations highlight the need for larger, more diverse cohorts, prospective study designs and the inclusion of rare variant analyses in future research to further refine and validate predictive models for lithium response in bipolar disorder.
Implications
In summary, our study highlights that the predictive power of PGSs for lithium responsiveness can be substantially increased by integrating genetic variants from multiple pharmacogenomic and disease-associated traits, rather than relying solely on single-phenotype scores. This multi-trait approach takes advantage of the shared genetic architecture among related phenotypes, thereby capturing a wider and more clinically relevant spectrum of genetic risk factors. The integration of genomics with clinical data has already demonstrated considerable promise; for example, Cearns et al showed that combining PGSs for MDD and SCZ with clinical variables using machine learning algorithms explained nearly 14% of the variance in lithium responsiveness, outperforming models based on either genetic or clinical data alone. Reference Cearns, Amare, Schubert, Thalamuthu, Frank and Streit46 Building on this, further improvements in predictive accuracy are probably achievable by adopting mt-PGS approaches in combination with detailed clinical profiles. Looking ahead, future research should prioritise integrating pharmacomulti-omics data – including genomics, metabolomics, neuroimaging and clinical variables – with the goal of developing even more robust and personalised predictive models. Such integrative and data-driven strategies hold great promise for advancing precision psychiatry, ultimately enabling more tailored and effective treatment selection for individuals with bipolar disorder and other complex psychiatric conditions.
The preprint version of this work is available elsewhere. Reference Sharew, Clark, Hartmann, Papiol, Heilbronner and Degenhardt65
Supplementary material
The supplementary material is available online at https://doi.org/10.1192/bjp.2026.10776
Data availability
All data used in this analysis are available to ConLi+Gen members. See http://www.conligen.org/ for further information.
Acknowledgements
The authors thank all patients who participated in the study, and we appreciate the contributions of clinicians, scientists, research assistants and study staff who helped in patient recruitment, data collection and biological sample preparation of the studies. We are also indebted to the members of the ConLi+Gen Scientific Advisory Board (https://www.ConLi+Gen.org/) for critical input over the course of the project. The analysis of this study was carried out using the high-performance computational capabilities of Adelaide University’s Phoenix Supercomputer (https://serviceshub.adelaide.edu.au/esc?id=kb_article&sysparm_article=KB0015429&topic_id=1e2bf2e4c3f4b2508cf25bbeb0013168).
Author contributions
A.T.A. conceived and designed the project and secured a fellowship to lead the study. N.T.S. developed the research proposal, conducted the statistical analysis, interpreted the findings and drafted the manuscript. A.T.A., S.R.C., O.S. and S.H. provided supervision and critically reviewed the data analysis steps and manuscript draft. All authors contributed genetic and clinical data, provided feedback and made significant intellectual contributions to the manuscript.
Funding
This work is funded by the National Health and Medical Research Council (NHMRC) Emerging Leadership Investigator Grant 2021 – 2008000 awarded to A.T.A. N.T.S. is a recipient of the Adelaide University Research Scholarship. The primary sources of funding were Deutsche Forschungsgemeinschaft (DFG; grant nos RI 908/7-1, FOR2107 and RI 908/11-1 to M.R.; NO 246/10-1 to M.M.N.) and the Intramural Research Program of the National Institute of Mental Health (no. ZIA-MH00284311; ClinicalTrials.gov identifier: NCT00001174). The genotyping was in part funded by the German Federal Ministry of Education and Research (BMBF) through the Integrated Network IntegraMent (Integrated Understanding of Causes and Mechanisms in Mental Disorders), under the auspices of the e:Med Programme (grants awarded to T.S., M.R. and M.M.N.). The study Improving Recognition and Care in Critical Areas of Bipolar Disorders (BipoLife) was funded by BMBF: PIs – F.B., P.R., M.B., A.C.R., S.K.-S., T.S., J.W., G.J., A.J.F. and M.L. U.H. was supported by the European Union’s Horizon 2020 Research and Innovation Programme (PSY-PGx, grant agreement no. 945151). Certain data and biomaterials were collected as part of 11 projects (Study 40) that participated in the National Institute of Mental Health (NIMH) Bipolar Disorder Genetics Initiative. From 2003 to 2007, the principal investigators and co-investigators were the following: Indiana University, Indianapolis, Indiana, USA, no. R01 MH59545; John Nurnberger, MD, PhD; Marvin J. Miller, MD; Elizabeth S. Bowman, MD; N. Leela Rau, MD; P.Ryan Moe, MD; Nalini Samavedy, MD; Rif El-Mallakh, MD (at University of Louisville, USA); Husseini Manji, MD (at Johnson and Johnson); Debra A.Glitz, MD (at Wayne State University, USA); Eric T. Meyer, PhD, MS (at Oxford University, UK); Carrie Smiley, RN; Tatiana Foroud, PhD; Leah Flury, MS; Danielle M.Dick, PhD (at Virginia Commonwealth University, USA); Howard Edenberg, PhD, Washington University, St. Louis, Missouri, USA, no. R01 MH059534; John Rice, PhD; Theodore Reich, MD; Allison Goate, PhD; Laura Bierut, MD, no. K02 DA21237, Johns Hopkins University, Baltimore, Maryland, USA, no. R01 MH59533; Melvin McInnis, MD; J. Raymond DePaulo, Jr., MD; Dean F. MacKinnon, MD; Francis M. Mondimore, MD; James B. Potash, MD; Peter P. Zandi, PhD, Dimitrios Avramopoulos and Jennifer Payn, University of Pennsylvania, Pennsylvania, USA, no. R01 MH59553; Wade Berrettini, MD, PhD, University of California at San Francisco, California, USA, no. R01 MH60068; William Byerley, MD and Sophia Vinogradov, MD, University of Iowa, Iowa, USA, no. R01 MH059548; William Coryell, MD and Raymond Crowe, MD, University of Chicago, Illinois, USA, no. R01 MH59535; Elliot Gershon, MD, Judith Badner, PhD, Francis McMahon, MD, Chunyu Liu, PhD, Alan Sanders, MD, Maria Caserta, Steven Dinwiddie, MD, Tu Nguyen and Donna Harakal, University of California at San Diego, California, USA, no. R01 MH59567; John Kelsoe, MD; Rebecca McKinney, BA, Rush University, Illinois, USA, no. R01 MH059556; William Scheftner, MD, Howard M. Kravitz, DO, MPH, Diana Marta, BWS, Annette Vaughn-Brown, MSN, RN and Laurie Bederow, MA, NIMH Intramural Research Program, Bethesda, Maryland, USA, no. 1Z01MH002810-01; Francis J. McMahon, MD; Layla Kassem, PsyD; Sevilla Detera-Wadleigh, PhD; Lisa Austin, PhD; Dennis L. Murphy, MD, Howard University; William B. Lawson, MD, PhD; Evarista Nwulia, MD and Maria Hipolito, MD. This work was supported by NIH grants nos P50CA89392 from the National Cancer Institute and 5K02DA021237 from the National Institute of Drug Abuse. The study was endorsed by the Ministry of Research, Technology and Space (Bundesministerium für Forschung, Technologie und Raumfahrt) within the initial and set-up phases of the German Centre for Mental Health (grant nos 01EE2303A, 01EE2303F, 01EE2503F, 01EE2503A to P.F. and T.S.). Collection of the Barcelona sample was supported by Centro de Investigación en Red de Salud Mental (CIBERSAM), Institute of Health Carlos III (nos PI22/01048 and PI22/00431), IDIBAPS and the CERCA Programme/Generalitat de Catalunya (grant nos 2021SGR01093, 2021SGR00706, 2021SGR01358), and grant nos PID2022-139740OA-I00 and PID2021-1277760B-I00 funded by MICIU/AEI/10.13039/501100011033 and by FEDER, EU and La Marató de TV3 (no. 202203-30-31-32). The Canadian part of the study was supported by the Canadian Institutes of Health Research (grant no. 166098), and by Genome Canada and Research Nova Scotia grants to M.A. Collection and phenotyping of the Australian University of New South Wales sample, by P.B.M., P. Schofield, J.M.F. and A.W., was funded by an Australian NHMRC Programme Grant (no. 1037196). Collection of the Barcelona sample was supported by Centro de Investigación en Red de Salud Mental (CIBERSAM), IDIBAPS and the CERCA Programme/Generalitat de Catalunya (grant nos PI080247, PI1200906, PI12/00018, 2014SGR1636 and 2014SGR398). The Swedish Research Council, Stockholm County Council, Karolinska Institute and the Söderström-Königska Foundation supported this research through grants awarded to L.B., L.F., C.L. and M.S. Collection of the Geneva sample was supported by the Swiss National Foundation (grant nos Synapsy 51NF40-158776 and 32003B-125469). Collection of the Romanian sample was supported by U.E.F.I.S.C.D.I., Romania, via a grant awarded to M.G.-S.
Declaration of interest
E.V. has received grants and served as consultant, advisor or continuing medical education speaker for the following entities: AB-Biotics, Allergan, Angelini, AstraZeneca, Bristol-Myers Squibb, Dainippon Sumitomo Pharma, Farmindustria, Ferrer, Forest Research Institute, Gedeon Richter, GlaxoSmith-Kline, Janssen, Lundbeck, Otsuka, Pfizer, Roche, Sanofi-Aventis, Servier, Shire, Sunovion, Takeda, the Brain and Behaviour Foundation, CIBERSAM and the Stanley Medical Research Institute. M.B. has received competitive grant support from DFG, BMBF, the European Commission and Sächsische Aufbaubank. In the past 3 years he has served as an advisor to Alfred E. Tiefenbacher GmbH Co. KG, COMPASS Pathfinder Ltd, GH Research, MedEd-Link Inc., Janssen Global Services, LLC, Livanova, Mindforce Game Lab AB and Novartis. He has received lecture fees from MedTrix GmbH and Streamedup GmbH, and honoraria for editor-in-chief positions from Thieme Verlag and Springer Nature outside the submitted work. S.K.-S. has received grants and served as consultant, advisor or speaker for the following entities: Medice Arzneimittel Pütter GmbH and Shire/Takeda. B.T.B. has received grants and served as consultant, advisor or continuing medical education speaker for the following entities: AstraZeneca, Bristol-Myers Squibb, Janssen, Lundbeck, Otsuka, Servier, the National Health and Medical Research Council, the Fay Fuller Foundation and the James and Diana Ramsay Foundation. S.C. has received grants and served as consultant, advisor or continuing medical education speaker for the following entities: Otsuka Australia, Lundbeck Australia, Janssen-Cilag Australia and Servier Australia. T.K. has received honoraria for lectures, manuscripts and/or consultancy, from Kyowa Hakko Kirin Co., Ltd, Eli Lilly Japan K.K., Otsuka Pharmaceutical Co., Ltd, GlaxoSmithKline K.K., Taisho Toyama Pharmaceutical Co., Ltd, Dainippon Sumitomo Pharma Co., Ltd, Meiji Seika Pharma Co., Ltd, Pfizer Japan Inc., Mochida Pharmaceutical Co., Ltd, Shionogi & Co., Ltd, Janssen Pharmaceutical K.K., Janssen Asia Pacific, Yoshitomiyakuhin, Astellas Pharma Inc., Wako Pure Chemical Industries, Ltd, Wiley Publishing Japan, Nippon Boehringer Ingelheim Co. Ltd, Kanae Foundation for the Promotion of Medical Science, MSD K.K., Kyowa Pharmaceutical Industry Co., Ltd and Takeda Pharmaceutical Co., Ltd. T.K. also received a research grant from Takeda Pharmaceutical Co., Ltd. I.-G.A. has served as consultant, advisor or continuing medical education speaker for the following entities: Aristo, Idorsia, Janssen, Merck, Schwabe and Recordati. P.F. has received grants and served as consultant, advisor or continuing medical education speaker for the following entities: Abbott, GlaxoSmithKline, Janssen, Essex, Lundbeck, Otsuka, Gedeon Richter, Servier and Takeda, as well as the German Ministry of Science and the German Ministry of Health. E.R. has received grants and served as consultant, advisor or continuing medical education speaker for the following entities: Janssen and Institut Allergosan. M.L. declares that, over the past 36 months, he has received lecture honoraria from Lundbeck and served as a scientific consultant for EPID Research Oy, but declares no other equity ownership, profit-sharing agreements, royalties or patent. K.A. has received consulting honoraria from Taisho Toyama Pharmaceutical Co., Ltd. In 2021. J.Z. served as an advisor for Biogen concerning Aducanumab (Alzheimer’s Disease). I.F. has received funding (partly) from DFG – project-ID 521379614 – SFB/TRR 393 Trajectories of Affective Disorders. M.M.N. has received fees for membership of an advisory board from HMG Systems Engineering GmbH (Fürth, Germany), for membership in the Medical-Scientific Editorial Office of Deutsches Ärzteblatt, for review activities from the European Research Council and for serving as a consultant for EVERIS Belgique SPRL in a project of the European Commission (ID: REFORM/SC2020/029). He receives salary payments from Life & Brain GmbH and holds shares in Life & Brain GmbH. The other authors have no other conflicts of interest to disclose.
Software and code-sharing
The software used included polygenic risk score–continuous shrinkage (PRS-CS version 1.1.0 for Linux; Tian Ge et al, Massachusetts General Hospital, Boston,Massachusetts, USA; https://github.com/getian107/PRScs) and PLINK version 2.0 for Linux (Purcell S and Chang C; https://www.cog-genomics.org/plink/2.0/). The custom codes used in this study will be made available upon reasonable request to the corresponding author.



 Open access


eLetters
No eLetters have been published for this article.