



1. Introduction
The astonishing beauty of geological patterns has fascinated humanity for centuries (Hill, Forti & Shaw Reference Hill, Forti and Shaw1997). Several different geological structures are related to mineral dissolution (Cohen et al. Reference Cohen, Berhanu, Derr and Courrech du Pont2016) and precipitation (Meakin & Jamtveit Reference Meakin and Jamtveit2010) in aqueous systems. A few examples are terraces and steps due to precipitation of dissolved minerals in flowing fluids on the ground, which find a parallel in the structures arising from melting and freezing of ice, usually called icicles and crenulations. Another class of geological patterns is speleothems, which are karst structures encountered in limestone caves. The most common structures are stalactites, stalagmites, draperies, flutings, to name a few. The chemical mechanism behind the growth of speleothems is the precipitation of calcium carbonate dissolved in water which flows on the cave walls. Due to the higher partial pressure of  $\mathrm {CO}_2$ in the soil and rock compared with the atmosphere, flowing water becomes enriched in carbon dioxide. The pH of the solution is lowered and the quantity of calcium carbonate that can be dissolved in water increases (Short et al. Reference Short, Baygents, Beck, Stone, Toomey and Goldstein2005a; Short, Baygents & Goldstein Reference Short, Baygents and Goldstein2005b). Once the water enriched in CO
 $_2$ flows through an opening on the walls of a cave, the
 $\mathrm {CO}_2$ outgases from the solution, the concentration in the air being lower than in the water. As a result, the solution is supersaturated and calcium carbonate minerals deposit on the surface (Buhmann & Dreybrodt Reference Buhmann and Dreybrodt1985).
The role of hydrodynamics in the speleothem formation has increased in interest over the last two decades. Short et al. (Reference Short, Baygents, Beck, Stone, Toomey and Goldstein2005a) showed that the stalactite shape is self-similar and results from the coupling of hydrodynamics and the deposition process. In Camporeale & Ridolfi (Reference Camporeale and Ridolfi2012) the problem of the origin of crenulations on stalactites was tackled in the context of falling film theory, indicating that the pattern is mainly dictated by a hydrodynamic instability (Vesipa, Camporeale & Ridolfi Reference Vesipa, Camporeale and Ridolfi2015). The emergence of draperies structures in limestone caves is also driven by falling liquid film instabilities (Bertagni & Camporeale Reference Bertagni and Camporeale2017). Falling liquid films are usually described in the context of the long wave or lubrication approximation (Kalliadasis et al. Reference Kalliadasis, Ruyer-Quil, Scheid, Velarde and García2011), in which the fundamental assumption is that the interface modulation wavelengths are much larger than the characteristic thickness of the flowing film.
The dynamics of a viscous film underneath a substrate, and for which inertial effects are negligible, is related to the Rayleigh–Taylor instability. In the presence of gravitational forces, the flat interface is destabilized when a heavier fluid is placed above a lighter one (Rayleigh Reference Rayleigh1882; Taylor Reference Taylor1950). While gravity plays a destabilizing role, pushing the heavier fluid down, surface tension stabilizes disturbances of small wavelengths. In the case of a thin film coating the underside of a surface, the problem is solved in the context of the lubrication approximation (Babchin et al. Reference Babchin, Frenkel, Levich and Sivashinsky1983). When the substrate is horizontal, the resulting pattern is characterized by drops which organize in regular arrays (Fermigier et al. Reference Fermigier, Limat, Wesfreid, Boudinet and Quilliet1992) and can grow in time or saturate depending on the initial thickness (Lister, Rallison & Rees Reference Lister, Rallison and Rees2010; Marthelot et al. Reference Marthelot, Strong, Reis and Brun2018).
If the substrate is inclined, there is a gravity component which is projected along the substrate, leading to a flow. The growth rate of perturbations decreases due to the reduction of the gravity component normal to the substrate, and perturbations can be advected away. A link between the absolute to convective transition of the flow instability and dripping was shown by Brun et al. (Reference Brun, Damiano, Rieu, Balestra and Gallaire2015). A refined model including inertial and viscous extensional stresses for high flow rates demonstrated that the occurrence of the absolute instability does not predict the dripping satisfactorily (Scheid, Kofman & Rohlfs Reference Scheid, Kofman and Rohlfs2016; Kofman et al. Reference Kofman, Rohlfs, Gallaire, Scheid and Ruyer-Quil2018). In Lerisson et al. (Reference Lerisson, Ledda, Balestra and Gallaire2020) and Ledda et al. (Reference Ledda, Lerisson, Balestra and Gallaire2020) the conditions for the existence of steady patterns and the selection mechanisms for a thin film flowing under an inclined planar substrate in the absence of inertial effects were experimentally and numerically studied. The flow can reach a steady state without dripping, characterized by elongated structures modulated along the direction perpendicular to the flow (spanwise direction), called rivulets, also observed experimentally in Charogiannis et al. (Reference Charogiannis, Denner, van Wachem, Kalliadasis, Scheid and Markides2018). It has been demonstrated that the rivulet profile reaches a state mainly driven by static arguments, i.e. a pure equilibrium between surface tension and capillary effects. A weakly nonlinear model highlighted the selection mechanism of streamwise structures, and the stability analysis of the rivulet profile to streamwise perturbations revealed that short wavelengths are progressively stabilized as the substrate is more inclined or the liquid film thinner. Rivulets can therefore be a stable pattern, for certain values of angle, flow rate and streamwise length of the domain. Outside of this range, lenses appear on rivulets, and they may merge and eventually drip (Lerisson et al. Reference Lerisson, Ledda, Balestra and Gallaire2019).
Bertagni & Camporeale (Reference Bertagni and Camporeale2017) studied the morphogenesis of draperies structures in limestone caves using the thin film equation, combining a two-dimensional linear stability analysis and a weakly nonlinear approach to show the emergence of streamwise structures (i.e. rivulets in the fluid film, draperies on the substrate, see figure 1a,b). The growth rate of perturbations from a flat condition is slightly larger for streamwise aligned structures as the inertia of the flow is neglected. However, a complete characterization of the two-dimensional spatio-temporal dynamics and a description of the key mechanisms and the physics underlying the selection of streamwise structures on the substrate remain to be assessed. We will highlight in this work that a small coupling of the hydrodynamic effects with the deposition effect is already sufficient to induce a significant anisotropy in the spatio-temporal response, while it has only a minute effect in the temporal dispersion relation.
(a) Draperies observed in the Vallorbe caves, Switzerland and (b) their numerical rendering. (c) Description of the considered problem with the fluid film and substrate thicknesses indicated.

The response of a given flow to external perturbations can be characterized through the large-time asymptotic behaviour of the linear impulse response, the Green function. The Green function is the most synthetic and complete way to describe the nature of a forced linear system, since the response to any generic forcing is given by the convolution between the Green function and the forcing itself. The impulse can be localized only in space (steady analysis) or both in space and time (spatio-temporal analysis). Considering the steady case, for a thin film flowing over an inclined planar substrate, the linear Green function enables the reconstruction of the response which emerges from the presence of localized defects (Hayes, O'Brien & Lammers Reference Hayes, O'Brien and Lammers2000; Kalliadasis, Bielarz & Homsy Reference Kalliadasis, Bielarz and Homsy2000; Decré & Baret Reference Decré and Baret2003). Interestingly, the resulting Green function for a steady defect is characterized by a decaying behaviour as the distance from the defect location increases.
In unstable flows, the spatio-temporal Green function analysis is usually analytically tackled within the context of the saddle points approach, in which the large-time asymptotic properties of the response can be retrieved by the research of the saddle points of the spatio-temporal growth rate in the complex planes of the spatial wavenumbers which define the response (Briggs Reference Briggs1964; Bers Reference Bers1975; Huerre & Monkewitz Reference Huerre and Monkewitz1990; Carriere & Monkewitz Reference Carriere and Monkewitz1999; Juniper Reference Juniper2007; Brun et al. Reference Brun, Damiano, Rieu, Balestra and Gallaire2015).
Alternatively, it has been demonstrated that a numerical approach based on the post-processing of the numerical linear impulse response can well describe the long-time behaviour of the impulse response (Brancher & Chomaz Reference Brancher and Chomaz1997; Delbende & Chomaz Reference Delbende and Chomaz1998; Delbende, Chomaz & Huerre Reference Delbende, Chomaz and Huerre1998; Gallaire & Chomaz Reference Gallaire and Chomaz2003; Mowlavi, Arratia & Gallaire Reference Mowlavi, Arratia and Gallaire2016; Lerisson Reference Lerisson2017; Arratia, Mowlavi & Gallaire Reference Arratia, Mowlavi and Gallaire2018). The procedure consists of a demodulation of the signal along one direction using the Hilbert transform, which leads to the complex analytic continuation of the real response, the analytic signal. As we detail in this study, the multidimensional counterpart of the analytic signal is the monogenic signal (Unser, Sage & Van De Ville Reference Unser, Sage and Van De Ville2009), which finds many applications in image analysis processes and is based on the application of the Riesz transform, the multidimensional generalization of the Hilbert transform.
In this work, we propose a numerical method for the analysis of the long-time asymptotic two-dimensional linear impulse response, with the aim of shedding light on the linear physical mechanisms which may lead to the selection of draperies structures on the substrate. The paper is organized as follows. In § 2, the equations for the evolution of a thin film in the presence of substrate variations are defined. To introduce the numerical procedure for the analysis of the linear response in the presence of a deposition process, we first validate the algorithm against the results of the linear response in the absence of the deposition process and on a flat substrate, since in this circumstance the problem can be solved analytically. We define the theoretical framework of the linear impulse response and we derive the analytical solution for the thin film in the absence of substrate variations. We characterize the response, whose results will be used throughout the work as a comparison with the response in the presence of the deposition process. Subsequently, in § 4 we present the post-processing algorithm for the analysis of the spatio-temporal impulse response in two dimensions, which we validate using the theoretical results of the previous part. We exploit the validated numerical algorithm in § 5, where we focus on the linear impulse response of a thin film in the presence of a deposition process. The numerical solution of the linearized flow equations is analysed through the post-processing algorithm. An additional analytical tool for the validation and interpretation of the results is given in § 6, focused on the study of the response in the presence of a steady defect without deposition processes. We compare the numerical results with an analytical approach for the evaluation of the steady Green function within the framework of spatial stability analysis. To verify the faithfulness of the results of the performed linear analyses, nonlinear simulations in the presence of the deposition process are reported in § 7.
2. Thin film model
We study the dynamics of a thin film of a viscous fluid flowing under a plane inclined with respect to the vertical of an angle  $\theta$, in the presence of substrate variations (figure 1c). The fluid properties are the kinematic viscosity
 $\nu$, the density
 $\rho$ and the surface tension coefficient
 $\gamma$. We denote the fluid film thickness and substrate variation thickness as
 $\bar {h}$ and
 $\bar {h}^{0}$, respectively. Thus, the distance of the fluid interface from the reference flat substrate is
 $\bar {h}+\bar {h}^{0}$. A coordinate system
 $(\bar {x},\bar {y})$ is defined, where
 $\bar {x}$ and
 $\bar {y}$ are the streamwise and spanwise directions, respectively. We introduce the initial flat film (Nusselt) thickness
 $h_N$ and the reduced capillary length
 $l_c^{*}$ as follows:
 \begin{equation} l_c^{*}=\frac{l_c}{\sqrt{\sin(\theta)}}, \end{equation}
where  $l_c=\sqrt {\gamma /(\rho g )}$ is the capillary length. The following non-dimensionalizations are defined:
 \begin{equation} x=\bar{x}/l_c^{*}, \quad y=\bar{y}/l_c^{*}, \quad h=\bar{h}/h_N, \quad t=\bar{t}/\tau_{{RT}}, \end{equation}
where  $\tau _{{RT}}={\nu l_c^{2}}/{h_N^{3} \sin ^{2}(\theta ) g}$ is the characteristic time scale of the Rayleigh–Taylor instability.
The problem of the lubrication model in the presence of substrate variations has been widely studied in the literature, in the context of the long wave approximation (Tseluiko, Blyth & Papageorgiou Reference Tseluiko, Blyth and Papageorgiou2013) or more involved models based on the introduction of inertia and viscous extensional effects (Heining & Aksel Reference Heining and Aksel2009; D'Alessio et al. Reference D'Alessio, Pascal, Jasmine and Ogden2010). In this work, we consider the model used in Bertagni & Camporeale (Reference Bertagni and Camporeale2017), for the inertialess case, in which the complete curvature is retained (Wilson Reference Wilson1982; Weinstein & Ruschak Reference Weinstein and Ruschak2004). The non-dimensional equation for the evolution of the thickness in the presence of substrate variations reads
 \begin{equation} \partial_{t} h+{u h^{2} \partial_{x} h}+\tfrac{1}{3} \boldsymbol{\nabla} \boldsymbol{\cdot}\left[ { \chi h^{3}\boldsymbol{\nabla} (h+h^{0})}+{h^{3} \boldsymbol{\nabla} \kappa}\right]=0, \end{equation}
where  $\boldsymbol {\nabla }$ operates in the
 $(x,y)$ plane and
 $u=\cot (\theta ) l_c^{*}/h_N$ is the linear advection velocity (Brun et al. Reference Brun, Damiano, Rieu, Balestra and Gallaire2015). The constant
 $\chi$ is set to
 $\chi =1$ for the flow under an inclined substrate, which is analysed throughout the work, except in the appendix A, where we report the validation of the numerical procedure against a benchmark case in the literature for the flow over an inclined flat substrate (
 $\chi =-1$). The curvature of the free surface is denoted as
 $\kappa =- \boldsymbol {\nabla } \boldsymbol {\cdot } \boldsymbol {n}$, where
 \begin{equation} \boldsymbol{n}=\frac{[-\partial_{x} h -\partial_{x} h^{0} , -\partial_{y} h -\partial_{y} h^{0},1]^{\textrm{T}} }{\sqrt{1+ (\partial_{x} h^{0}+\partial_{x} h)^{2} +(\partial_{y} h^{0}+\partial_{y} h)^{2}}} \end{equation}
is the normal to the free surface.
In this paper, we focus on the substrate growth by precipitation of calcium carbonate in cave walls. The mathematical formulation of the problem involves different chemical reactions and diffusion processes that occur in the fluid layer (Buhmann & Dreybrodt Reference Buhmann and Dreybrodt1985). Following the derivation of Short et al. (Reference Short, Baygents and Goldstein2005b), to which we refer for details, the flux of calcium carbonate depositing on the substrate, i.e. the variation in time of the substrate thickness, can be written as follows:
 \begin{equation} \partial_{\bar{t}} \bar{h}^{0}={\bar{C}} \bar{h}, \end{equation}
where  $\bar {C}$ is the chemistry-dependent constant, of the order of
 $\bar {C} \sim 10^{-7} s^{-1}$ (Camporeale Reference Camporeale2015). Considering the time scale of the Rayleigh–Taylor instability for a horizontal substrate,
 $\tau_{RT}^{\mathrm{hor}}=\nu l_c^2/(h_N^3g)$, the deposition constant in this dimensionless time scale is of the order
 $C \sim 10^{-4}$. Introducing the non-dimensionalization (2.2a–d), the non-dimensional equation for the deposition reads
 \begin{equation} \partial_t h^{0}=\check{C} h, \end{equation}
where  $\check {C} =C / \sin ^{2}(\theta )$. Equations (2.3) and (2.6) define the system for the dynamics of a thin film flowing under (
 $\chi =1$) an inclined plane in the presence of substrate variations due to the deposition of calcium carbonate.
The equations are linearized around the baseflow solution  $[H,H^{0}]^{\textrm {T}}=[1,\check {C}t]^{\textrm {T}}$ introducing the following decomposition:
 \begin{equation} h=1+\varepsilon \eta, \quad h^{0}=\check{C}t+\varepsilon \eta^{0}, \end{equation}
where  $\varepsilon \ll 1$ and
 $[\eta ,\eta ^{0}]$ is the perturbation with respect to the baseflow solution. Keeping
 $O(\varepsilon )$ terms in (2.3) and (2.6), the following system of equations is obtained:
 \begin{gather} \partial_{t} \eta+u \partial_{x} \eta+ \tfrac{1}{3} \left[ \chi {\nabla}^{2} (\eta+\eta^{0})+{\nabla}^{4} (\eta+\eta^{0})\right]=0, \end{gather}
 \begin{gather} \partial_t \eta^{0}=\check{C} \eta, \end{gather}
which describes the linearized dynamics of the perturbation  $[\eta ,\eta ^{0}]$ around the constant flat film solution
 $H=1$ (2.8a), in the presence of a linear in time substrate growth
 $H^{0}$ due to the deposition law (2.8b), i.e.
 $[H,H^{0}]^{\textrm {T}}=[1,\check {C}t]^{\textrm {T}}$. Equations (2.8) are the starting point for the analysis of the speleothems’morphogenesis, in a linearized dynamics context.
The numerical implementation of the linearized equations (2.8) is based on a Fourier pseudo-spectral scheme implemented in MATLAB. Henceforth, we consider a rectangular domain of size  $1000\times 1000$, with a number of collocation points
 $N_x=N_y=1001$ and periodic boundary conditions. In appendix A we report the numerical procedure and the validation against the benchmark case of the response of a thin film flowing over an inclined flat substrate to a steady localized defect (Hayes et al. Reference Hayes, O'Brien and Lammers2000; Kalliadasis et al. Reference Kalliadasis, Bielarz and Homsy2000; Decré & Baret Reference Decré and Baret2003).
3. Linear response in the absence of substrate variations
3.1. Dispersion relation
In this section, we study the linear response in the absence of substrate variations (figure 2). We therefore impose  $\eta ^{0} =0$ in (2.8a), leading to the following equation for the linearized dynamics of the perturbation:
 \begin{equation} \partial_{t} \eta+u \partial_{x} \eta+ \tfrac{1}{3} \left[ {\nabla}^{2} \eta+{\nabla}^{4} \eta \right]=0. \end{equation}
(a) Sketch of the flow and substrate configurations adopted in § 3. (b) Sketch of the impulse response in a spatio-temporal diagram.

We introduce the ansatz  $\eta \sim \exp [\mathrm {i}(k_x x +k_y y -\omega t)]$, where
 $k_x$ and
 $k_y$ are real and
 $\omega$ is complex, within the temporal approach. Introducing
 $k=\sqrt {k_x^{2}+k_y^{2}}$, the following polynomial dispersion relation is obtained:
 \begin{equation} \omega=u k_x + \frac{\mathrm{i}}{3}\left(k^{2}-k^{4}\right), \end{equation}
which relates the behaviour in space and time of the perturbation. In the absence of deposition process, the temporal growth rate  $\mathrm {Im}(\omega )$ does not depend on
 $u$, which influences only the advection of perturbations. The response in the absence of deposition is characterized by concentric circles (see figure 3a) that propagate from a centre that is advected away with the linear advection velocity
 $u$. The maximum value of the thickness increases exponentially with time (see figure 3b). In the following, we rescale the fluid thickness using the maximum value, knowing that the growth in amplitude is exponential. The isovalues of the temporal growth rate are concentric circles propagating from
 $(k_x,k_y)=0$ (see figure 3c), i.e. the growth rate is isotropic. The growth rate increases for small wavenumbers, reaches a maximum at
 $k=1/\sqrt {2}$, then decreases and becomes negative for
 $k>1$, the cut-off wavenumber. Therefore, the linearized dynamics does not show any preferential direction for the growth of perturbations, which are advected away.
Two-dimensional linear impulse response in the absence of substrate variations, for  $u=0.77$. (a) Response in the physical space at
 $t=200$. (b) Temporal evolution of the maximum value of the response. (c) Temporal growth rate, as a function of
 $k_x$ and
 $k_y$. The red dot denotes the initial impulse location.

3.2. Large-time behaviour of the impulse response
In this section, we analytically study the linear impulse large-time response. So as to better characterize the response observed in figure 3(a) and understand the structure when the deposition process will be introduced, together with the differences with the case in the absence of substrate variations, we present the theoretical tools to describe the impulse response of a linear system, the Green function  $\tilde {g}$. The method is a generalization of the classical one-dimensional approach (Brevdo Reference Brevdo1991; Carriere & Monkewitz Reference Carriere and Monkewitz1999; Juniper Reference Juniper2007). For
 $t\rightarrow \infty$, the Green function asymptotically reads
 \begin{equation} \tilde{g}(x,y,t) \sim \hat{g} \exp\left[\mathrm{i}\left(k_x x +k_y y -\omega t \right)\right]/t, \quad t\rightarrow \infty \end{equation}
where the streamwise wavenumber  $k_x$, the spanwise wavenumber
 $k_y$ and the complex frequency
 $\omega$ are varying in space and time, via their dependence on so-called rays
 $x/t$ and
 $y/t$. The evaluation of the asymptotic properties along the rays (
 $x/t=\mathrm {const},y/t=\mathrm {const}$) for
 $t \rightarrow \infty$ is performed using the method of the steepest descent in the complex
 $k_x$ and
 $k_y$ planes. At large times, the dominating contribution with group velocity (
 $x/t,y/t$) is given by the following saddle points in the complex
 $k_x$ and
 $k_y$ planes:
 \begin{equation} \frac{\partial \omega^{\prime \prime}}{\partial k_x}=\frac{\partial \omega^{\prime \prime}}{\partial k_y}=0, \end{equation}
where  $\omega ^{\prime \prime }=\omega -k_x x / t-k_y y / t$. The resulting values of
 $k_x$,
 $k_y$ and
 $\omega ^{\prime \prime }$ for each ray
 $(x/t,y/t)$ allow to reconstruct the linearized dynamics of the wavepacket.
The evaluation of the saddle points is performed in MATLAB, by using the built-in function ‘fsolve’ that solves simultaneously for the saddle points in the two complex planes  $k_x$ and
 $k_y$ using the dispersion relation (3.2). The initialization is based on the solution of the one-dimensional case documented in Brun et al. (Reference Brun, Damiano, Rieu, Balestra and Gallaire2015) for
 $(x/t,y/t)=(0,0)$, which corresponds to the maximum temporal growth rate in the dispersion relation and is a contributing saddle point according to Barlow, Helenbrook & Weinstein (Reference Barlow, Helenbrook and Weinstein2017). The solution at different
 $(x/t,y/t)$ is obtained using as initial guess the previously calculated value.
The asymptotic properties for  $u=0.77$ are reported in figure 4. We report only positive values of
 $y/t$, since
 $\omega ^{\prime \prime }$,
 $\omega$ and
 $k_x$ are symmetric with respect the axis
 $y/t=0$, while
 $k_y$ is antisymmetric. The isocontours of the spatio-temporal growth rate
 $\sigma =\mathrm {Im}(\omega ^{\prime \prime })$ (figure 4a) are concentric circles that propagate from a centre at
 $(x/t=u,y/t=0)$. The maximum value
 $\sigma =1/12$ is located at the centre and coincides with the maximum of the dispersion relation (3.2). Increasing the distance from the centre, the values of
 $\sigma$ decrease. At a distance from the centre of
 $\approx 0.54$, the spatio-temporal growth rate is zero, and becomes negative at larger distances. The full description of the asymptotic properties is completed with the results in figure 4(b–f). The real part of the complex frequency
 $\mathrm {Re}(\omega )$ (figure 4b) is characterized by positive values in the upstream part of the wavepacket and by negative values in the downstream part. The transition region where
 $\mathrm {Re}(\omega )=0$ is located at
 $x/t=u$, and the transition becomes more abrupt whilst decreasing
 $y/t$, with a discontinuity at
 $y/t=0$. This discontinuity can be observed also in the real parts of the streamwise (figure 4d) and spanwise (figure 4f) wavenumbers, while the corresponding imaginary parts (figure 4c,e) are zero.
Large-time asymptotic properties of the two-dimensional linear impulse response in the absence of deposition, for  $u=0.77$, as functions of
 $x/t$ and
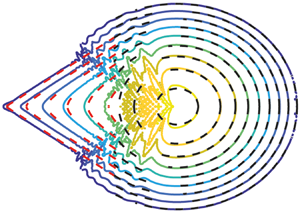
 $y/t$. The coloured isocontour plots represent the analytical results of § 3.2. (a) Spatio-temporal growth rate. (b) Real part of the complex frequency. (c) Imaginary part of the streamwise wavenumber. (d) Real part of the streamwise wavenumber. (e) Imaginary part of the spanwise wavenumber. (f) Real part of the spanwise wavenumber. The black dashed line identifies the region
 $\sigma =0$. The red dashed lines denote the results of the post-processing algorithm described in § 4.

According to the spatio-temporal analysis approach (Van Saarloos Reference Van Saarloos2003), the front is defined by the region where  $\sigma =0$. In the one-dimensional case the front is defined only by a value of
 $x/t$, while in two dimensions by couples
 $(x/t,y/t)$. From the analysis, it results that the front of the wave packet is a circle of radius
 $\approx 0.54$ centred around
 $(x/t=u, y/t=0)$. This value agrees with the absolute-convective instability transition predicted by Brun et al. (Reference Brun, Damiano, Rieu, Balestra and Gallaire2015) for the one-dimensional case. Since the centre of the wavepacket is located at
 $x/t=u$, and the front is a circle of radius
 $0.54$ (independent of
 $u$), the first case in which the spatio-temporal growth rate is non-negative at
 $x/t=0$ is when
 $u=0.54$. As the linear advection velocity decreases, the unstable region invades negative values of
 $x/t$, i.e. upstream of the initial impulse position, and the flow is said to be absolutely unstable (Huerre & Monkewitz Reference Huerre and Monkewitz1990).
The above-performed analytical spatio-temporal analysis could be in principle performed also in the presence of the deposition process. Nevertheless, the possible presence of multiple saddle points to be identified, and the discrimination of upstream and downstream propagating branches related to the different saddle points, make the problem arduous to tackle theoretically. We therefore propose a numerical approach, which presents some originalities and interesting perspectives. The analytical results of this section will be used to validate the numerical algorithm and as a reference point when restoring the coupling with the deposition process.
4. Numerical approach based on the monogenic signal
4.1. The Riesz transform and the monogenic signal
In this section, we introduce the mathematical tools necessary for the spatio-temporal analysis of the impulse response from the linear simulations. Numerical analyses of the linear impulse response have been already performed in the literature (Delbende & Chomaz Reference Delbende and Chomaz1998; Delbende et al. Reference Delbende, Chomaz and Huerre1998; Gallaire & Chomaz Reference Gallaire and Chomaz2003), where the asymptotic properties along one single direction were studied. The study of the asymptotic properties of a one-dimensional wavepacket is based on the introduction of the analytic signal (Delbende et al. Reference Delbende, Chomaz and Huerre1998), which is the complex continuation of a real signal. The analytic signal is derived using the Hilbert transform, which corresponds to a phase shift of  $-90^{\circ }$ and
 $+90^{\circ }$, respectively, to the positive and negative Fourier components of a function
 $g(x)$, i.e. the Hilbert transformed signal reads
 \begin{equation} {\mathcal{H}}{g}(x)=H_x\star g(x), \end{equation}
where  $H_x$ is a filter characterized by the Fourier transform
 $\hat {H}_x(k_x)=-\mathrm {i}\,\mathrm {sgn}(k_x)$, and the symbol
 $\star$ denotes the convolution operator. In the Fourier domain, the convolution becomes a product, such that the Fourier transform of the Hilbert transformed signal reads
 $\hat {\mathcal {H}}{g}=-\mathrm {i}\,\mathrm {sgn}(k_x)\hat {g}(k_x)$, where
 $\hat {g}$ is the Fourier transformed signal. The analytic signal gives access to the envelope and the phase of the wavepacket; indeed, as an alternative to its representation as the two components function
 $\boldsymbol {g}_a(x)=(g(x), \mathcal {H} g(x))$, the complex function
 ${g}_a(x)=g(x) +\mathrm {i}\mathcal {H} g(x)$ can be defined. The analytic signal
 $g_a$ is said to be the complex continuation of the real signal and can be rewritten in terms of amplitude and phase
 ${g}_a(x)=A \exp (\mathrm {i} \xi )$, where
 $A$ is the instantaneous amplitude (i.e. the envelope) and
 $\xi$ the phase of the complex signal. As explained in detail in § 4.2, knowledge of the envelope of the wavepacket is necessary to analyse the spatial and temporal growth rates, while the phase gives access to the spatial and temporal frequencies.
Our work aims to generalize the approach of Delbende et al. (Reference Delbende, Chomaz and Huerre1998) to the two-dimensional case, in the presence of two spatial propagation directions. We introduce the monogenic signal, the multidimensional generalization of the analytic signal (Unser et al. Reference Unser, Sage and Van De Ville2009). In the literature, there are several attempts to generalize the analytic signal in two dimensions (Bulow & Sommer Reference Bulow and Sommer2001; Felsberg & Sommer Reference Felsberg and Sommer2001; Hahn Reference Hahn2003). In this work, we use the definition given by Unser et al. (Reference Unser, Sage and Van De Ville2009), based on the multidimensional generalization of the Hilbert transform, the Riesz transform (Stein & Weiss Reference Stein and Weiss2016). In the two-dimensional case, in analogy to the Hilbert transform, the Riesz operator transforms the scalar signal  $g({x,y})$ to the vector signal
 $\boldsymbol {g}_R({x,y})$ that reads
 \begin{equation} \boldsymbol{g}_{{R}}({x,y})=\left(\begin{array}{@{}l@{}}{g_{{R}1}({x,y})} \\ {g_{{R}2}({x,y})}\end{array}\right)=\left(\begin{array}{@{}l@{}}{H_{x} * g({x,y})} \\ {H_{y} * g({x,y})}\end{array}\right), \end{equation}
where  $*$ denotes the convolution operator in two dimensions. The functions
 $H_{x}$ and
 $H_y$ are two filters characterized, respectively, by the Fourier transforms
 $\hat {H}_{x}({k_x,k_y})=-\mathrm {i} k_{x} /k$ and
 $\hat {H}_{y}({k_x,k_y})=-\mathrm {i} k_{y} /k$, and they are the generalization of the one-dimensional filter to two spatial directions. In an analogy to the Hilbert transformed signal, we consider a definition of the Riesz transformed signal that combines the two components in one scalar signal (Unser et al. Reference Unser, Sage and Van De Ville2009) as follows:
 \begin{equation} \mathcal{R} g({x,y}) =g_{{R}1}({x,y}) + \mathrm{i}g_{{R}2}({x,y}), \end{equation}
which in the Fourier domain reads
 \begin{equation} \hat{\mathcal{R}} g({k_x,k_y}) = \frac{\left(-\mathrm{i} k_{x}+k_{y}\right)}{k} \hat{g}({k_x,k_y}), \end{equation}
where  $\hat {g}$ is the two-dimensional Fourier transform of the signal. Note that at
 $k_x=k_y=0$ the Fourier transform of the Riesz transformed signal is singular and the regularization assumes zero value at the origin. We then introduce the monogenic signal as the three-components function, as follows:
 \begin{equation} {\boldsymbol{g}_m}(x,y)=(g(x,y), \ \operatorname{Re}(\mathcal{R} g(x,y)), \ \mathrm{Im}(\mathcal{R} g(x,y)))=\left(g, g_{R1}, g_{R2}\right). \end{equation}
According to Unser et al. (Reference Unser, Sage and Van De Ville2009), the relation between the Riesz and the Hilbert transforms along the  $(x,y)$ directions can be seen as the equivalent between the definition of gradient and partial derivatives. The quantity
 $r=\sqrt {g_{R1}^{2}+g_{R2}^{2}}=|\mathcal {R}g|$ identifies the maximum response of the directional Hilbert operator
 \begin{equation} \max _{\psi}\left\{\mathcal{H}_{\psi} g\right\}=\max _{\psi}\left\{\operatorname{Re}\left(\textrm{e}^{-\mathrm{i} \psi} \mathcal{R} g\right)\right\} \end{equation}
along the direction  $d_\psi$ given by the angle
 $\psi =\mathrm {atan}(g_{R2}/g_{R1})$. The instantaneous amplitude (i.e. the envelope of the signal) is given by
 \begin{equation} {A}=\sqrt{g^{2}+g_{R1}^{2}+g_{R2}^{2}} \end{equation}
and the phase by
 \begin{equation} \xi=\mathrm{atan}\left(\sqrt{g_{R1}^{2}+g_{R2}^{2}}/g\right). \end{equation}
This decomposition allows us to write the monogenic signal along  $d_\psi$ in the form
 \begin{equation} \tilde{g}(x,y,t)={A}\exp(\mathrm{i}\xi). \end{equation}
The amplitude  ${A}$ represents the envelope of the signal and
 $\xi$ the phase along the direction
 $d_{\psi }$. Note that (4.9) is valid only when amplitude and phase of the signal can be demodulated (Delbende et al. Reference Delbende, Chomaz and Huerre1998). This is valid when the variations of the envelope occur at a scale much larger than that governing the oscillations. The representation in (4.9) is the two-dimensional equivalent of the analytic signal (Delbende et al. Reference Delbende, Chomaz and Huerre1998) and identifies in
 $\tilde {g}$ the complex continuation of the two-dimensional real signal
 $g$.
4.2. Large-time asymptotic properties
In this section, we derive the asymptotic properties of the wavepacket by following the same procedure outlined in Delbende et al. (Reference Delbende, Chomaz and Huerre1998). According to § 3.2, the complex Green function reads
 \begin{equation} \tilde{g} \sim \exp\left[\mathrm{i}\left(k_x x +k_y y -\omega t\right)\right]/t, \end{equation}
where the asymptotic properties  $k_x$,
 $k_y$ and
 $\omega$ depend on
 $x/t$ and
 $y/t$.
The linear simulations of the impulse response give as a result the real signal  $g(x,y)$. We thus recover the complex Green function by the analytic continuation of
 $g$, i.e. the monogenic signal
 $\tilde {g}$, as follows:
 \begin{equation} \tilde{g} \sim \exp\left[\mathrm{i}\left(k_x x +k_y y -\omega t\right)\right]/t = {A}\exp(\mathrm{i}\xi), \end{equation}
where  ${A}=|\tilde {g}|$ and
 $\xi =\mathrm {arg}(\tilde {g} )$. Thus, by exploiting the last expression, we can use the monogenic signal
 $\tilde {g}$ to evaluate the asymptotic properties of the wavepacket. The spatio-temporal growth rate
 \begin{equation} \sigma=\mathrm{Im}(\omega^{\prime\prime})=\mathrm{Im}(\omega)-\mathrm{Im}(k_x)x/t -\mathrm{Im}(k_y)y/t=\mathrm{Im}(\omega)-\mathrm{Im}(k_x)v_x -\mathrm{Im}(k_y)v_y, \end{equation}
which represents the growth of a perturbation along a ray of group velocities  $(x/t,y/t)=(v_x,v_y)$, is obtained by applying the logarithm operator to the absolute value of (4.11)
 \begin{equation} |\tilde{g}| \sim \exp(\sigma t)/t = {A} \quad \rightarrow \quad \sigma t - \ln(t) \sim \ln(A) \end{equation}
and thus by evaluating the derivative with respect to time of the resulting expression (for  $x/t=\mathrm {const},y/t=\mathrm {const}$) as
 \begin{equation} \sigma(x=v_{x}t,y=v_{y}t) \sim \frac{\mathrm{d}}{{\mathrm{d}t}}\ln(A(x=v_{x}t,y=v_{y}t,t))+\frac{1}{t}. \end{equation}
The definition of the spatio-temporal growth rate (4.12) allows us to evaluate the imaginary part of the streamwise and spanwise wavenumbers at each ray  $(x/t,y/t)=(v_x,v_y)$ (see appendix B for details), i.e.
 \begin{gather} \mathrm{Im}(k_x(x=v_{x}t,y=v_{y}t))=-\partial_{v_{x}} \sigma, \end{gather}
 \begin{gather} \mathrm{Im}(k_y(x=v_{x}t,y=v_{y}t))=-\partial_{v_{y}} \sigma. \end{gather}
The real parts of the spatial wavenumbers are retrieved by considering (4.11) and exploiting the definition of phase:
 \begin{gather} \mathrm{Re}(k_x(x=v_{x}t,y= v_{y}t)) \sim \partial_x \xi(x=v_{x}t,y=v_{y}t), \end{gather}
 \begin{gather} \mathrm{Re}(k_y(x=v_{x}t,y= v_{y}t)) \sim \partial_y \xi(x=v_{x}t,y=v_{y}t). \end{gather}
Alternatively, still exploiting the logarithm of (4.11), a direct evaluation of the real and imaginary parts of the spatial wavenumbers from the complex monogenic signal can be performed giving
 \begin{gather} k_x\sim-\mathrm{i}\partial_x\ln(\tilde{g}(x=v_{x}t,y=v_{y}t)), \end{gather}
 \begin{gather} k_y\sim-\mathrm{i}\partial_y\ln(\tilde{g}(x=v_{x}t,y=v_{y}t)). \end{gather}
In this work, we adopted this technique to evaluate the streamwise and spanwise wavenumbers. The temporal growth rate is obtained from the knowledge of the spatio-temporal growth rate and the imaginary part of the wavenumbers, as follows:
 \begin{equation} \mathrm{Im}(\omega)=\sigma+\mathrm{Im}(k_x) x / t+\mathrm{Im}(k_y) y / t. \end{equation}
The real part of the complex frequency is, by definition, the temporal derivative of the phase  $\xi$, i.e.
 \begin{equation} \mathrm{Re}(\omega)(x/t,y/t,t) \sim - \partial_t \xi(x/t,y/t,t). \end{equation}
Note that in this case the derivative with respect to the time is evaluated in a relatively short time interval, without following the rays  $x/t=v_{x}$ and
 $y/t=v_{y}$ (Delbende et al. Reference Delbende, Chomaz and Huerre1998). Moreover, the sign of the spatial frequencies cannot be recovered from the analysis, since we are post-processing a real signal. In the following, we will consider positive values for the real parts of the complex frequency and spatial wavenumbers.
4.3. Numerical procedure and validation
The analytical developments derived in the previous sections aim at describing the asymptotic behaviour for  $t \rightarrow \infty$ using numerical simulations at finite times. In addition, (4.9) assumes that the amplitude and the phase of the signal subject to the Riesz transform can be demodulated, i.e. that a separation of scales between the variations of the envelope and the oscillations subsists. In this section, we verify the numerical procedure and the validity of the assumptions using as a test case the analytical solution described in § 3.2. The post-processing algorithm is validated against the theoretical results of the impulse response in the absence of substrate variations. The numerical implementation is based on MATLAB. The linear response is computed using (3.1) subjected to a Gaussian initial condition that mimics the Delta function behaviour, as follows:
 \begin{equation} \eta(x,y,0)=\eta^{0}(x,y,0)=\exp\left[-(x^{2}+y^{2})/2\varsigma^{2}\right], \end{equation}
with  $\varsigma =1$; no appreciable changes in the response have been observed for
 $\varsigma <1$.
The numerical steps for the post-processing are the following. We apply the two-dimensional Fourier transform to the linear response at different times via the built-in MATLAB function ‘fft2’. We obtain the Riesz transformed signal by (4.4). The inverse Fourier transform is applied (via the built-in MATLAB function ‘ifft2’) and we build the monogenic signal in the physical space, for different times, according to (4.9). We evaluate the spatio-temporal growth rate by (4.12), using the monogenic signals evaluated at different times. We then obtain the streamwise and spanwise wavenumbers by a finite difference expression of (4.19) and (4.20), and then the temporal growth rate by a finite difference approximation of (4.21). Finally, the real part of the complex frequency is recovered from (4.22) using the computed monogenic signals at different times.
We evaluate the derivatives using first-order finite differences. A convergence analysis has been performed on the number of collocation points and the order of the finite differences for the derivatives, and we observed the convergence of the results already for a domain of  $L_x=L_y=1000$ and
 $N_x=N_y=1001$. The odd number of points is necessary to have also the zero frequency
 $k_x=k_y=0$, where the transfer function of the Riesz transform is singular and has to be regularized imposing the zero value. The results are averaged at different times (Lerisson Reference Lerisson2017). We consider a time step of
 $\Delta t=15$ for the evaluation of the spatio-temporal growth rate, from
 $t=200$ to
 $t=350$. At each time, the real part of the complex frequency is evaluated using a time step of
 $\delta t=0.01$ (Delbende et al. Reference Delbende, Chomaz and Huerre1998).
In figure 4 we also report a comparison of the post-processing algorithm (red dashed lines) against the results of the saddle points analysis (coloured isocontours). The results agree with those obtained from the saddle-points approach. The spatio-temporal growth rate (figure 4a) is well described by the numerical post-processing, and the front of the wavepacket is well captured. The other variables well agree with the analytical solution. Figure 5 shows the results for the temporal properties and the streamwise wavenumber as functions of  $x/t$, at
 $y/t=0$. The comparison reveals a good agreement, except in the centre of the wavepacket where the analytical solution is discontinuous. The difference can be imputed to a transient effect at the centre of the wavepacket, which is reduced as time increases. Note that the analytical solution of § 3.2 is rigorously valid as
 $t \rightarrow \infty$. Nevertheless, in the numerical simulations, there is a practical limit in the final time related to the numerical noise. The maximum ratio between the smaller and greater values in the simulations is limited to
 $16$ decades, for the double precision (Trefethen & Bau Reference Trefethen and Bau III1997). Therefore, we cannot go beyond the final time above defined, i.e.
 $t=350$. Despite the presence of a discontinuity in the centre of the wavepacket, the numerical procedure well captures the structure of the solution. Concerning the spatio-temporal growth rate, the maximum error from the theoretical value is around
 $\varDelta =2 \times 10^{-3}$, which means a percentage error of
 $2.5\,\%$. The edges of the wavepacket agree well with the analytical solution. We conclude that our post-processing algorithm is able to capture the spatial structure of the asymptotic properties, making it suitable for the study of the impulse response in the presence of the deposition process.
Comparison of the long-time asymptotic properties of the two-dimensional linear impulse response in the absence of deposition ( $u=0.77$) as functions of
 $x/t$, for
 $y/t=0$. The solid lines and the dots denote the analytical (§ 3.2) and numerical approaches (§ 4), respectively. (a) Spatio-temporal growth rate, imaginary and absolute value of the real part of the complex frequency. (b) Imaginary and absolute value of the real part of the streamwise wavenumber. The black dashed line denotes the values of
 $\sigma$.

5. Linear response in the presence of the deposition process
5.1. Dispersion relation
In this section, we briefly study the temporal stability properties in the presence of the deposition process. Following the linear stability analysis approach, we assume the normal mode expansion
 \begin{equation} \left[\eta, \eta^{0}\right]^{\textrm{T}}=\left[\eta, \eta^{0}\right]^{\textrm{T}} \exp\left[\mathrm{i}\left(k_x x +k_y y -\omega t\right)\right]. \end{equation}
It is worth underlining that this decomposition for the substrate thickness assumes that the temporal growth due to the presence of the flat film is much slower than the one related to the Rayleigh–Taylor instability. The deposition constant  ${C}$ describes the growth in the absence of patterns in the fluid film. The characteristic time scale of this process has to be large enough so as the variations of the baseflow are negligible as the instability occurs. Under these conditions, a separation of scales between the speleothem growth and the Rayleigh–Taylor instability subsists. Since
 $C$ is already non-dimensionalized with the characteristic time scale of the Rayleigh–Taylor instability, we restrict ourselves to the case
 $C<10^{-3}$. In these conditions, we can safely assume the ansatz (5.1).
We introduce the normal mode decomposition in the equations for the linearized dynamics (2.8), leading to the dispersion relation which relates the complex frequency  $\omega$ to the wavenumbers
 $(k_x,k_y)$ for the coupled hydrodynamic-deposition problem
 \begin{equation} \omega=\frac{\omega^{H}}{2} \pm \sqrt{\left(\frac{\omega^{H}}{2}\right)^{2} -\frac{\check{C}}{3}\left(k^{2}-k^{4}\right)}, \end{equation}
where  $\omega ^{H}$ is the complex frequency in the absence of substrate variations, (3.2).
The dispersion relation (5.2) is analogous to the one reported in Bertagni & Camporeale (Reference Bertagni and Camporeale2017) in the absence of inertial effects. Two branches of the dispersion relation are identified. One branch is always damped while the other one tends to the hydrodynamic case as  ${C}$ goes to zero. The dynamics is governed by two non-dimensional parameters, the linear advection velocity
 $u$ and the deposition constant
 ${C}$. A preliminary analysis of the influence on the dispersion relation for a large range of
 $u$ did not show any appreciable effect on the temporal growth rate of perturbations, for fixed deposition constants
 $10^{-10}<{C}<10^{-3}$. For computational reasons, it is not convenient to consider extremely large values of
 $u$, as large as those that can be found in limestone caves (
 $l_c/h_N \sim 270$, i.e.
 $u \sim 10^{2}$), since the advection of perturbations will require the use of unrealistic extremely large computational domains for the numerical simulations, while the physics of the travelling wavepacket would not change significantly. For these reasons we focus on the case
 $u=0.77$ and
 $\theta =55^{\circ }$, and we study the effect of the deposition constant
 ${C}$.
In figure 6 we report the temporal growth rate  $\mathrm {Im}(\omega )$ as a function of
 $(k_x,k_y)$, for different values of the deposition constant. For
 ${C}=10^{-5}$, the temporal growth rate is analogous to the case without deposition, and no appreciable anisotropies are observed. At very high values of the deposition constant,
 ${C}=10^{-3}$, the isovalues are concentric circles in most of the
 $(k_x,k_y)$ plane, but there is a small region located close to
 $k_x=0$ where the growth rate is slightly higher (the difference is of order
 $10^{-3}$). The isotropy is broken, and spanwise structures (rivulets) experience a slightly larger growth than the streamwise structures (waves), as already pointed out in Bertagni & Camporeale (Reference Bertagni and Camporeale2017).
Temporal growth rate  $\mathrm {Im}(\omega )$ from the dispersion relation in the presence of deposition (5.2) as a function of
 $(k_x,k_y)$ for (a)
 ${C}=10^{-5}$ and (b)
 ${C}=10^{-3}$.

Nevertheless, the small anisotropy in the dispersion relation may be not sufficient to completely characterize a linear selection of streamwise structures in the deposition process that should arise also for low values of the deposition constant, in the range defined by Camporeale (Reference Camporeale2015). Moreover, the complex form of the dispersion relation does not highlight how the deposition process influences the spatio-temporal growth of perturbations, and thus it does not shed light on the physics underlying the phenomenon. We therefore focus on the response of the system to a localized initial perturbation, i.e. the Green function.
5.2. Numerical impulse response
In this section, we focus on the spatio-temporal analysis of the linear impulse response, both on the substrate and in the fluid film, in the presence of the deposition process (2.8). We consider two representative values of the deposition constant which cover the physical range indicated by Camporeale (Reference Camporeale2015),  ${C}=10^{-5}$ and
 ${C}=10^{-3}$. Figure 7 shows the linear impulse response in terms of fluid and substrate thickness, at
 $t=200$. We recall that in § 3 we observed that the fluid thickness response in the absence of substrate variations was characterized by concentric circles. The fluid film thickness (figure 7a,c) is characterized by a quite similar structure, albeit some differences can be highlighted. While in the downstream part (I) we observe circular isovalues for
 $\eta$, the pattern in the upstream part (II) is more intricate.
Linear impulse response (2.8) for  $u=0.77$ at
 $t=200$. (a,b) Here
 ${C}=10^{-5}$; (a) fluid film and (b) substrate thickness. (c,d) Here
 ${C}=10^{-3}$; (c) fluid film and (d) substrate thickness. Results are rescaled with the maximum fluid thickness for visualization purposes. The red dots denote the initial impulse location.

The substrate thickness (figure 7b,d) presents similar peculiarities. The isovalues in the downstream part are circular, while in the upstream part streamwise aligned structures are present. The region in which streamwise structures dominate roughly corresponds to the region upstream of the maximum film thickness. These structures grow as higher values of the deposition constant are considered. As a consequence, we observe a more perturbed pattern in the fluid film.
The isotropy breaking in the fluid film is related to the presence of deposited streamwise structures in the upstream part of the wavepacket. While in the downstream part the hydrodynamics dominate the pattern with an isotropic structure reminiscent of the case without deposition (§ 3), observed also in the substrate thickness, in the upstream part we observe an interaction between the hydrodynamics and the deposition process.
As the impulse travels, it leaves behind a substrate pattern characterized by predominant streamwise structures. From a physical point of view, this may be explained by the fact that waves are structures that are advected away with the flow, while rivulets are not. Furthermore, it has to be remembered that the deposition law is linear with the film thickness (see (2.6)). The growth of substrate disturbances is superposed with the classical growth in the presence of a flat film, i.e. the substrate thickness is always increasing, but this is not obvious for the perturbation  $\eta ^{0}$. Since waves are travelling structures (i.e. they are oscillating at fixed locations), the linearized deposition law is sequentially increasing and decreasing the substrate perturbation with respect to the linear growth in time, then leading to a much smaller effect on the deposition process. On the contrary, rivulets are not travelling structures. The substrate perturbation always increases or decreases, since there is no advection of the fluid structures along the spanwise direction. As a consequence of the passage of the wavepacket, predominant streamwise structures are deposited on the substrate.
5.3. Large-time behaviour of the impulse response
In this section we apply the post-processing algorithm, introduced in § 4, to the two cases of figure 7. According to the decomposition of (5.1), the analysis of the asymptotic properties can be applied to both variables. The difference in the patterns observed in figure 7 are related to the different eigenvectors  $[\hat {\eta },\hat {\eta }^{0}]$. In the following, we consider the fluid thickness for the evaluation of the asymptotic properties. However, the observed physical results are not affected by this choice.
In figure 8(a) we report the spatio-temporal growth rate obtained from the post-processing algorithm, for  ${C}=10^{-5}$. The spatio-temporal growth rate is greater than zero in a region downstream of the initial impulse position (III). The unstable region spreads in the
 $(x/t,y/t)$ plane within a region roughly defined by a front angle
 $\varphi \simeq 36.5^{\circ }$. In the downstream part of the wavepacket (I), we observe circular isovalues of the spatio-temporal growth rate, which decreases moving away from the value of
 $(x/t=u,y/t={0})$. The two regions interact in the region just upstream of the maximum spatio-temporal growth rate position (II). The real part of the complex frequency (figure 8b) presents the same structure of the spatio-temporal growth rate. In the region downstream of the initial impulse location, both the real and imaginary parts of the complex frequency are close to zero.
Asymptotic properties from the post-process algorithm (§ 4), for  $u=0.77$ and
 ${C}=10^{-5}$. (a) Spatio-temporal growth rate. (b) Real part of the complex frequency. (c) Imaginary part of the streamwise wavenumber. (d) Real part of the streamwise wavenumber. (e) Imaginary part of the spanwise wavenumber. (f) Real part of the spanwise wavenumber.

A complete characterization of the asymptotic behaviour of the impulse response requires also the evaluation of the spatial asymptotic properties  $k_x$ and
 $k_y$, which are reported in figure 8(c–f). Downstream of the initial impulse location, all the spatial properties isovalues are approximately rays that propagate from the initial impulse position. Interestingly, the real part of the streamwise wavenumber is very small, i.e.
 $\mathrm {Re}(k_x) \sim 10^{-2}$. Moreover, at
 $y/t=0$,
 $\mathrm {Re}(k_y) \simeq 1/\sqrt {2}$, while in the absence of deposition it was zero except in the singular point at the centre of the wavepacket.
The same behaviour is found in the case  ${C}=10^{-3}$ (reported in appendix C), but the front downstream of the initial impulse position is more curved. Moreover, the region in which the two patterns interact is displaced downstream.
The present analysis reveals that there are three regions in the spatio-temporal impulse response. Region (I) is characterized by asymptotic properties whose distribution is very similar to the case in the absence of substrate variations, studied in § 3.2. In region (III) streamwise structures dominate. Since in the region just downstream of the initial impulse location the complex growth rate is close to zero, the pattern is almost steady. Moreover, the analysis of the spatial asymptotic properties reveals that streamwise aligned structures dominate, since  $\mathrm {Re}(k_x)\sim 10^{-2}$ and
 $\mathrm {Re}(k_y) \sim 1/\sqrt {2}$. The other spatial asymptotic properties are almost constant for
 $y/x=\mathrm {const}$ since the isovalues are rays that propagate from the initial impulse position. In region (II), the two regions (I) and (III) interact, and it is best observed in the fluid film response (figure 7), where the substrate presents non-negligible values of the thickness compared with the fluid film. In this region, due to the high values of the fluid film thickness, we observe a strong deposition and an increase of the substrate thickness.
We therefore identified two linear mechanisms that could lead to the emergence of draperies structures on the substrate. First, the advection of oscillating perturbations along the streamwise direction promotes the deposition of drapery-like structures rather than wave patterns on the substrate (ripples). This interpretation confirms the observation of slightly higher growth rates for spanwise perturbations in the two-dimensional dispersion relation of Bertagni & Camporeale (Reference Bertagni and Camporeale2017). This first mechanism strongly enhances the growth of draperies structures in the region just upstream of the maximum thickness, which is advected away with time. The second mechanism was highlighted thanks to the post-processing algorithm, which shows the presence of another region in which the perturbation grows, absent in the case without substrate variations of § 3.2. The presence of the initial defect that grows without being advected, creates a quasi-steady region characterized by streamwise structures both in the fluid film and on the substrate. The second mechanism appears to be dominant in the regions in which the isotropic response has been advected away. In the following, we investigate the hydrodynamic origin of this second source of anisotropy.
6. Linear response in the presence of a steady defect without deposition process
6.1. Numerical response and large-time asymptotics
In this section, we provide an additional analytical insight to better understand the physical mechanisms underlying the response in the presence of the deposition process. We consider the linear response of the thin film (2.8) in the presence of a steady defect (i.e.  $C=0$) of the form
 \begin{equation} \eta^{0}(x,y,t)=\exp[-x^{2}/2-y^{2}/2], \end{equation}
together with the initial condition for the fluid thickness,  $\eta (x,y,0)=0$.
The wavepacket (figure 9), in the downstream part (I), is characterized by the isotropic structure typical of the temporal response (figures 3 and 7), as described in detail in § 3.2. Nevertheless, in the upstream part (II) we observe streamwise structures more pronounced than in the case of the impulse response in presence of deposition (described in § 3.2), since the initial condition differs from a steady defect as it is characterized by an impulse both in the fluid film and on the substrate.
Linear fluid film response (2.8) (rescaled with the maximum value) in the presence of a steady defect (i.e.  $C=0$) located at
 $(x=0,y=0)$, for
 $u=0.77$, (a)
 $t=100$ and (b)
 $t=200$. The black dots denote the steady defect location.

The asymptotic properties (figure 10) resulting from the post-processing algorithm present a spatial structure analogous to the case in the presence of deposition reported in figure 8. In region (III), downstream of the initial impulse location, the isovalues are rays that propagate from  $(x/t,y/t)=(0,0)$. Both real and imaginary parts of the complex frequency are zero in the region downstream of the steady defect, and the real part of the streamwise wavenumber is of order
 $10^{-2}$.
Long-time asymptotic properties from the post-process algorithm (§ 4) of the two-dimensional linear response to steady defect in the absence of deposition, for  $u=0.77$. (a) Spatio-temporal growth rate. (b) Real part of the complex frequency. (c) Imaginary part of the streamwise wavenumber. (d) Real part of the streamwise wavenumber. (e) Imaginary part of the spanwise wavenumber. (f) Real part of the spanwise wavenumber.

The steady defect analysis confirms that the structure of the wavepacket is mainly driven by hydrodynamic effects. Moreover, the region downstream of the obstacle is steady because  $\omega =0$ and originates from the presence of the steady defect. Since the asymptotic properties are rays that propagate from the centre, the properties of the steady pattern are constant at fixed
 $y/x$. This invariance suggests that the response can be evaluated in the context of a steady pattern asymptotic analysis, introduced in Lerisson et al. (Reference Lerisson, Ledda, Balestra and Gallaire2020) for the front analysis of a propagating steady wavepacket, known as spatio-spatial stability analysis.
6.2. The two-dimensional steady Green function
In this section, we analytically derive the Green function for a steady defect. The approach is based on the spatio-temporal analysis introduced in § 3.2, but we focus on the growth in space of a steady wavepacket. We can thus make an analogy to the classical one-dimensional analysis (Van Saarloos Reference Van Saarloos2003): the  $(x,y)$ directions play the role of space and time.
Following Hayes et al. (Reference Hayes, O'Brien and Lammers2000), we introduce the total free surface elevation  $\eta _{{t}}=\eta +\eta ^{0}$. We seek for the solution of the following problem:
 \begin{equation} u \partial_{x} \eta_{{t}}+\tfrac{1}{3}\left[\nabla^{2} (\eta_{{t}})+\nabla^{4} (\eta_{{t}})\right]=-u \partial_{x} \eta^{0}=f(x,y). \end{equation}
The impulse is located in the position  $y/x=0$, i.e. the Green function
 $\tilde {g}_s(x,y)$ solves the steady problem,
 \begin{equation} u \partial_{x} \eta_{{t}}+\tfrac{1}{3}\left[\nabla^{2} (\eta_{{t}})+\nabla^{4} (\eta_{{t}})\right]=\delta (x) \delta(\,y). \end{equation}
The solution in the presence of a localized defect  $\eta _{{t}}$ is found using the property of the Green function, i.e.
 $\eta _{{t}}=\tilde {g}_s * f$, where
 $*$ is the convolution operator. Since we consider the response to a steady localized defect
 $f(x,y)=\partial _x [\delta (x) \delta (\,y)]$. Using the properties of the Delta function and integrating by parts, we obtain the solution that reads
 \begin{equation} \eta_{{t}}=u \partial_x \tilde{g}_s(x,y). \end{equation}
The solution  $\tilde {g}_s$ is found using the same approach of the spatio-temporal stability analysis, where now we have the direction
 $x \rightarrow \infty$. The Green function for steady defect can be expressed as
 \begin{equation} \tilde{g}_s(x,y) \sim \hat{g} \exp(k_x x + k_y y) /\sqrt{x} \sim \hat{g} \exp(k_x^{\prime} x)/\sqrt{x}, \end{equation}
where  $k_x^{\prime }=k_x+k_y (\,y/x)$. The solution reads
 \begin{equation} \eta_{{t}}=u \partial_x \tilde{g}_s(x,y) \sim \mathrm{i}u k_x \exp[\mathrm{i}(k_x x +k_y y)]/\sqrt{x}, \end{equation}
i.e. the asymptotic properties of the total elevation  $\eta _{{t}}$ wavepacket are the same as the Green function for
 $x \rightarrow \infty$.
The spatio-spatial analysis is implemented similarly to the spatio-temporal stability analysis outlined in § 3.2. We look for the steady (i.e.  $\omega =0$) dispersion relation (3.2) saddle points of
 $k_x^{\prime }=k_x+k_y (\,y/x)$ in the complex
 $k_y$ plane, varying
 $y/x$. The resulting asymptotic properties define the response for each
 $y/x$. The method is numerically implemented in MATLAB; we solve for the saddle point using the built-in function ‘fsolve’. The initial guess is given by the maximum in the steady dispersion relation (3.2) for
 $y/x=0$, which is a contributing saddle point according to Barlow et al. (Reference Barlow, Helenbrook and Weinstein2017).
In figure 11 we report the spatial asymptotic properties as functions of  $y/x$. The spatio-spatial growth rate
 $\mathcal {K}=-\mathrm {Im}(k_x^{\prime })$ (figure 11a) is initially positive and decreases with
 $y/x$. Beyond the critical value of
 $y/x =0.74$ it becomes negative. Both the real and imaginary parts of the streamwise wavenumber (figure 11b) are negative and decrease with
 $y/x$, in opposition to the real and imaginary parts of the spanwise wavenumber (figure 11c), which are positive and increase with
 $y/x$.
Analytical asymptotic properties for the steady two-dimensional Green function. (a) Spatio-spatial growth rate as a function of  $y/x$. (b) Streamwise wavenumber and (c) spanwise wavenumber resulting from the analytical steady response, as functions of
 $y/x$.

The unstable region in the  $(x,y)$ plane is located where the spatio-spatial growth rate is positive. At low values of
 $y/x$, i.e. close to
 $y=0$, we observe a positive spatio-spatial growth rate, i.e. perturbations are growing (remember that one writes
 $\eta _{{t}} \sim \exp \left [\mathrm {i}(k_x x +k_y y)\right ]$). When
 $\mathcal {K}=0$ we define the value of
 $y/x$ beyond which perturbations are damped, that is
 $y/x=0.74$. This value of
 $y/x$ defines a ray in the
 $(x,y)$ plane, that corresponds to an angle with respect to the
 $x$ axis of
 $\varphi \simeq 36.5^{\circ }$, in agreement with the front observed in figures 8 and 10.
These results can be easily visualized in figure 12, in which we report the real part of the total free surface elevation and the asymptotic properties in the  $(x,y)$ plane, in a similar fashion to the previous plots for the spatio-temporal response. The total free surface elevation is characterized by predominant streamwise structures. The steady Green function is growing moving away from the obstacle, in strong contrast to the case of the flow over an incline, in which it is decaying (Hayes et al. Reference Hayes, O'Brien and Lammers2000; Kalliadasis et al. Reference Kalliadasis, Bielarz and Homsy2000; Decré & Baret Reference Decré and Baret2003). The streamlines of the wavevector
 $\boldsymbol {k}=(\mathrm {Re}(k_x),\mathrm {Re}(k_y))$ (red dashed lines in figure 12a) are parallel to the
 $y$ direction at
 $y=0$ and slightly bend upstream with
 $y$. This slight variation is related to the negative value of the real part of the streamwise wavenumber. The bending of the wavevector streamlines imply that the wavefronts (black dashed lines in figure 12a), orthogonal to the wavevector directions, tend to slightly diverge from the centre going downstream.
Results of the spatio-spatial analysis in the  $(x,y)$ plane. (a) Real part of the total free surface elevation
 $\eta _{{t}}$ obtained from the asymptotic properties. The red and black dashed line denote the streamlines of the wavevector
 $\boldsymbol {k}=(\mathrm {Re}(k_x),\mathrm {Re}(k_y))$ and the wavefronts, respectively. (b) Spatio-spatial growth rate, (c) imaginary and (d) real parts of the streamwise wavenumber, (e) imaginary and (f) real parts of the spanwise wavenumber. The red line denotes the value of
 $y/x$ for which
 $\mathcal {K}=0$.

We now consider the spatio-temporal response observed in § 6.1. In the steady regions, the spatio-temporal growth rate (§ 3.2)  $\sigma =\mathrm {Im}(\omega ) -\mathrm {Im}(k_x) x/t -\mathrm {Im}(k_y) y/t=\mathrm {Im}(\omega ) +\mathcal {K}x/t$ coincides with the spatio-spatial growth rate rescaled with
 $x/t$, i.e.
 $\sigma =\mathcal {K} x/t$, since
 $\omega =0$. In figure 13 we show the spatio-temporal growth rate obtained from the numerical simulation compared with analytical values of
 $\sigma$ and
 $\mathcal {K}x/t$, respectively, obtained from the spatio-temporal (§ 3.2) and spatio-spatial approaches, for
 $t=350$. The comparison shows a good agreement between spatio-spatial theory and numerical post-processing in the region downstream of the steady defect. Moreover, the numerical spatio-temporal response agrees well with the spatio-temporal results, in the region downstream of
 $x/t=u$.
Linear response to a steady defect: spatio-temporal growth rate from the post-process algorithm of § 4 (coloured isocontours) and from the saddle points approach of § 3.2 (black isocontours) and spatio-spatial growth rate (changed of sign) from the analytical steady approach of § 6.2 (red isocontours).

We report in figure 14 a comparison of the spatial asymptotic properties, at  $y/t=0$. Also in this case, the results are in good agreement; the values of
 $\mathrm {Re}(k_y)$ are converging to the analytic values as
 $x$ increases. The small difference in the values is due to the fact that we are considering not large enough values of
 $x$ close to the obstacle. The saddle point analysis is rigorously valid for
 $x \rightarrow \infty$, and in this case the steady response is present in the range
 $0<x<175$ for the considered time (
 $t=350$), which explains the small difference.
Comparison of streamwise (a) and spanwise (b) wavenumbers obtained from the post-process algorithm of § 4 (dots), the analytical approach (coloured solid lines) for the response to a steady defect of § 6.2 and the analytical results of the spatio-temporal analysis of § 3.2 (black solid lines), on the ray  $y/t=0$.

Our analysis shows that the temporal response to a steady defect is characterized by the presence of the steady and unsteady contributions which interact. The steady contribution, which originates from the presence of the steady defect, is not advected away and spreads in the domain as the streamwise coordinate increases. The presence of an initial perturbation gives rise also to a temporal response that is advected away. If we wait for enough time, eventually the temporal response is no longer present in the field and only the steady response survives, which is characterized by streamwise-aligned structures.
We then conclude that the emergence of streamwise structures both on the fluid film and on the substrate in the region just downstream of the initial impulse location is related to the presence of defects on the substrate and it has a linear hydrodynamic origin. This mechanism is predominant in the regions in which the temporal response has been advected away. In the context of morphogenesis of draperies, we thus argue that the response in the presence of the deposition process contains as fundamental ingredients two hydrodynamic effects, one related to the isotropic unsteady response in the absence of substrate variations, and the other one related to the steady response in the presence of a localized defect in the substrate. The deposition process couples these two different hydrodynamic mechanisms, giving rise to predominant draperies structures on the substrate.
7. Nonlinear response
The linear response in the presence of the deposition process is compared with nonlinear simulations of (2.3) and (2.6), for the case  ${C}=10^{-3}$. The system of (2.3) and (2.6) is subjected to the initial conditions
 \begin{gather} h=1+{S} \exp[-x^{2}/2-y^{2}/2], \end{gather}
 \begin{gather} h^{0}={S} \exp[-x^{2}/2-y^{2}/2], \end{gather}
where  ${S}=10^{-2}$.
The nonlinear simulations are performed using the finite-element software COMSOL Multiphysics. The flow equations are solved in a rectangular domain with periodic boundary conditions, for the variables  $(h,\kappa ,h^{0})$ using third-order finite elements; the time marching is obtained by a second-order backward differentiation formula. We consider a domain of size
 $L_x=310$ and
 $L_y=180$ with periodic boundary conditions and largest mesh element of characteristic size
 ${l}_c^{*}$ in the region, leading to a mesh of approximately
 $56000$ elements. A preliminary analysis shows that the numerical convergence is already achieved with this characteristic size of elements.
In figure 15 we show the results at three different times, for the fluid and substrate thickness. As a comparison, on the bottom, the results for  $h=1+\mathrm {S}\eta$ of the linear simulation of § 5.2 are reported. The nonlinear patterns are very similar to the corresponding linear ones, even if some differences can be highlighted. As time increases, the fluid film increases and the perturbation spreads in concentric circles from the maximum thickness location. Streamwise structures are selected in the downstream part of the response close to the maximum value position, while in the linear simulation the pattern is isotropic in this region. The dominance of streamwise structures in the downstream part is enhanced as
 $u$ increases (figure 16).


The upstream part shows the same intricate pattern observed in the linear simulations. The substrate thickness presents a defect at the origin, which slowly grows in time. Downstream of the defect at the origin, growing streamwise structures on the substrate emerge and propagate in the domain, with a front well described by a constant angle.
Under the light of the results of the previous linear analyses, we are able now to distinguish the different physical mechanisms underlying the selection of streamwise structures. The selection of streamwise structures both in the fluid film and on the substrate in the downstream part of the initial impulse location is due to the steady defect mechanism of § 6.2, while in the region upstream the maximum thickness draperies are purely selected by the deposition law. In addition, rivulets emerge also in the downstream part of the wavepacket. This selection is absent in the linearized dynamics and is due to nonlinear effects (Ledda et al. Reference Ledda, Lerisson, Balestra and Gallaire2020). The downstream part of the wavepacket is progressively invaded by rivulets with time, thus enhancing the deposition of streamwise structures on the substrate. Thanks to the linear analyses, we conclude that the linear effects are predominant in the upstream part of the wavepacket such that, after all, the selection of streamwise structures occurs for all the values of the linear advection velocity. The deposition of streamwise structures in the downstream part is largely dictated by the nonlinear selection of rivulets in the fluid film, whose dominance is enhanced with  $u$.
In figure 16, we observe that the visible perturbation in the nonlinear simulation spreads in a larger region compared with the linear simulation. This implies that the linear front given by the isolevel  $\sigma =0$ changes in the nonlinear regime. We thus focus on the structure of the nonlinear front with time. The analysis performed with the post-process algorithm could be in principle applied to the results of the nonlinear simulations. However, nonlinearities generate large wavelengths, altering the band structure of the spectrum of the perturbation observed in the linear simulations. As a consequence, it is no more possible to recover the envelope of the response (Melville Reference Melville1983; Delbende & Chomaz Reference Delbende and Chomaz1998).
Despite this, following Delbende & Chomaz (Reference Delbende and Chomaz1998), it is possible to obtain information about the front by following the isolevels of the absolute value of the response  $|\eta |$. We consider the centreline profile (i.e.
 $y/t=0$) and we extend the linear fronts (red dashed lines) in the nonlinear regime by following the corresponding isolevel of
 $|\eta |$ (figure 17a). We assume that this isolevel is a good approximation of the nonlinear front. The nonlinear front follows the linear one until
 $t \approx 108$, beyond which it bends and the perturbation spreads in a larger region. In the inset, we report the corresponding thickness profile at
 $t =108$. The maximum thickness location is very close to the linear front. The variation of the isolevel of
 $|\eta |$ well approximating the nonlinear front is reported in figure 17(b) as a function of
 $(x/t,y/t)$, for
 $t=50$ and
 $t=125$. The isolevel well approximates the linear prediction, and at
 $t=125$ we observe that the nonlinear front has spread downstream in a larger region.
(a) Isolevels of  $|\eta |$ as a function of
 $x$ and
 $t$, for
 $y=0$. The red dashed lines denote the linear front, while the black line the isolevel that well approximates the front at small times. The inset gives the thickness profile for
 $t=108$. (b) Isolevel of
 $|\eta |$ approximating the nonlinear front, for
 $t=50$ (blue line) and
 $t=125$ (green line). The red circle denotes the linear front given by the response in the absence of substrate variations, and the red lines the front given by the steady defect analysis with
 $u=3.85$ and
 $C=10^{-3}$.

The analysis of the nonlinear front shows that, at large times, the perturbation spreads in a larger region than the one predicted by the linear theory. While in the linear regime the advection of perturbation is given by  $u$, in the nonlinear regime it is equal to
 $u h^{2}$ (Babchin et al. Reference Babchin, Frenkel, Levich and Sivashinsky1983). As the perturbation grows, regions with thickness
 $h>1$ travel faster than the flat film and vice versa. Thus, for large enough times, the linear front is eventually reached (downstream for
 $h>1$, upstream for
 $h<1$). Our case corresponds to panels (c,d) in figure 3 of Delbende & Chomaz (Reference Delbende and Chomaz1998). For the sake of completeness, we report in appendix D the results of the nonlinear front in the absence of substrate variations. In conclusion, the nonlinearities tend to favour streamwise structures and to deform the front in which the perturbation spreads due to the differences in advection.
8. Conclusions and discussion
In this work, we studied the pattern formation of a thin film flowing under an inclined plane, in the presence of material deposition on the substrate, reminiscent of the karst structure formation in limestone caves. We tackled the problem theoretically and numerically studying the linearized dynamics when substrate variations are considered.
The spatio-temporal analysis in the presence of the deposition process was studied in the context of numerical simulations and a novel approach to retrieve the wavepacket properties. The numerical study of the impulse response was generalized to the two-dimensional case with the introduction of the monogenic signal, the two-dimensional analytic continuation of a real signal, based on the Riesz transform. The monogenic signal allows us to reconstruct the amplitude and the phase of the numerical response, and then the asymptotic properties of the wavepacket. This approach, which constitutes the generalization to two propagation directions of the approach introduced in Brancher & Chomaz (Reference Brancher and Chomaz1997) and Delbende et al. (Reference Delbende, Chomaz and Huerre1998), can be generally used in flows where the dispersion is not known analytically or when the saddle-point tracking becomes too challenging. In addition, this procedure allows one to proceed to an a posteriori description of the response, without the necessity to a priori define the unstable branches of the dispersion relation, making it suitable for the analysis of complex fluid responses. The numerical procedure aims at deriving the asymptotic behaviour for  $t \rightarrow \infty$ using numerical simulations at finite times, and assumes that the amplitude and the phase of the signal subject to the Riesz transform can be separated (i.e. a separation of scales between the variations of the envelope and the oscillations subsists). We verified the validity of the assumptions in the present case by a comparison with the analytical solution in the absence of substrate variations.
We therefore focused on the study of the linear impulse response in the presence of a deposition law. The temporal analysis of the dispersion relation showed only a slight anisotropy which promotes streamwise aligned structures. Motivated by this, we therefore studied the linear impulse response exploiting the post-processing algorithm. We identified an isotropic region (I) that is advected away (figure 18a) and a quasi-steady region (III) propagating downstream (figure 18b) with a front defined by an approximately constant angle, related to the presence of a growing substrate defect at the initial impulse location.

The analysis of the substrate thickness showed that the deposition law selects predominant streamwise structures as the wavepacket is advected away, in (II) the upstream part of the travelling wavepacket. Physically, we related this phenomenon to the fact that, in opposition to rivulets, waves are travelling structures. Perturbations are oscillating at fixed locations, thus having a much smaller effect on the substrate topography.
We thus analysed the response to a steady defect, for the pure hydrodynamic problem. The region just downstream of the steady obstacle coincides with the quasi-steady region (III) identified in the deposition case, and it is in good agreement with the analytical Green function for a steady defect (figure 18b). The emergent pattern is characterized by streamwise structures both in the fluid film and on the substrate thickness.
In the nonlinear simulations, we exploited the results of the linear analyses and we distinguished the selection mechanisms due to the substrate variations from the nonlinear mechanism of rivulets selection in the absence of substrate variations. While in the first case the dominance of streamwise structures is independent of the linear advection velocity, the latter plays a crucial role in the nonlinear selection mechanism. The latter promotes the selection of rivulets (in the fluid film) in the downstream part of the travelling wavepacket (I), thus enhancing the deposition of draperies structures. We analysed the evolution of the fronts between which the perturbation spreads, concluding that the emergence of rivulets modifies the downstream front by nonlinearly increasing the leading edge front velocity.
We conclude that the different selection mechanisms are dominant in different regions of the response. The deposition process couples the hydrodynamic mechanisms of the unsteady response in the absence of substrate variations and the steady response in the presence of localized substrate variations. In common natural environments, the relative importance of the mechanisms may depend on the fluid film and substrate conditions, but always giving rise to predominant draperies structures. The immense diversity of limestone patterns observed in nature may result from secondary instabilities of these predominantly selected primary streamwise-oriented structures.
Acknowledgement
We thank M. Unser for the precious advice about the Riesz transform at the first stage of the work.
Funding
We acknowledge the Swiss National Science Foundation under grant  $200021\_178971$.
Declaration of interests
The authors declare no conflict of interest.
Appendix A. Numerical method and validation
In this section, we introduce the numerical method to solve (2.8) in a rectangular domain, with periodic boundary conditions. We consider the Fourier transforms of the functions  $(\eta ,\eta ^{0})$, i.e.
 \begin{equation} \left[\hat{\eta}, \hat{\eta}^{0}\right]^{\textrm{T}}=\iint\left[\eta, {\eta}^{0}\right]^{\textrm{T}} \exp\left[{-\mathrm{i} \boldsymbol{k}\boldsymbol{\cdot} \boldsymbol{x}}\right]\,{\mathrm{d}} \boldsymbol{x}, \end{equation}
where  $\boldsymbol {k}=(k_x,k_y)$, are the streamwise and spanwise wavenumbers, respectively. Applying the Fourier transform to (2.8), the following complex ordinary differential equation system is obtained:
 \begin{gather} \frac{\textrm{d}\hat{\eta}}{\mathrm{d} t}=\hat{\eta}(-\mathrm{i} u k_{x})+(\hat{\eta}+\hat{\eta}^{0})\frac{1}{3}\left(\chi k^{2}-k^{4}\right), \end{gather}
 \begin{gather} \frac{\textrm{d}\hat{\eta}^{0}}{\mathrm{d} t} =\check{C} \hat{\eta}, \end{gather}
where  $k=|\boldsymbol {k}|$. Introducing the vector
 $\hat {\boldsymbol {\eta }}=[\hat {\eta },\hat {\eta }^{0}]^{\textrm {T}}$, the system of equations reads
 \begin{equation} \frac{\textrm{d}\hat{\boldsymbol{\eta}}}{\mathrm{d} t}=\left[\begin{array}{@{}cc@{}}{\tfrac{1}{3}\left(\chi k^{2}-k^{4}\right)-\mathrm{i} u k_x} & {\tfrac{1}{3}\left(\chi k^{2}-k^{4}\right)} \\ {\check{C}} & {0}\end{array}\right] \hat{\boldsymbol{\eta}}=A\hat{\boldsymbol{\eta}}. \end{equation}
With the decomposition  $\hat {\boldsymbol {\eta }}=\hat {\boldsymbol {\eta }}_r +\mathrm {i}\hat {\boldsymbol {\eta }}_i$, the final system of real ordinary differential equations reads
 \begin{equation} \frac{\textrm{d}\hat{\boldsymbol{y}}}{ \mathrm{d}t}=\left[\begin{array}{@{}l@{}}{\dfrac{\textrm{d} \hat{\boldsymbol{\eta}}_r}{\textrm{d}\mathrm{t}}} \\ {\dfrac{\textrm{d}\hat{\boldsymbol{\eta}}_{i}}{\textrm{d} \mathrm{t}}}\end{array}\right]=\left[\begin{array}{@{}cc@{}}{A_{r}} & {-A_{i}} \\ {A_{i}} & {A_{r}}\end{array}\right]\left[\begin{array}{@{}l@{}}{\hat{\boldsymbol{\eta}}_{r}} \\ {\hat{\boldsymbol{\eta}}_{i}}\end{array}\right]=B \hat{\boldsymbol{y}}. \end{equation}
The solution of this problem can be written as
 \begin{equation} \hat{\boldsymbol{y}}= \mathrm{expm}[B t]\hat{\boldsymbol{y}}(0), \end{equation}
where  $\mathrm {expm}$ stands for the exponential matrix.
The numerical procedure is implemented in MATLAB. A rectangular domain of size  $1000\times 1000$ is considered, with a number of collocation points
 $N_x=N_y=1001$. A convergence analysis on
 $(N_x,\, N_y)$ has been performed, concluding that convergence is already achieved for
 $1001$ collocation points. No significant changes have been observed when increasing the domain size. The initial condition is transformed in the two-dimensional Fourier space using the built-in function for the fast Fourier transform ‘fft2’. Subsequently, the linear system of ordinary differential equations is solved using the built-in function for the exponential matrix, and the solution in the space domain is obtained through the inverse fast Fourier Transform ‘ifft2’.
The numerical code is validated against a benchmark case present in the literature for the experimental response in the presence of a steady defect for a thin film flowing over an inclined plane, i.e.  $\chi =-1$ and
 ${C}=0$. The initial condition is given by
 $\eta (x,y,0)=0$ and
 $\eta ^{0}(x,y,0)=-\exp [-(x^{2}+y^{2})/2\varsigma ^{2}]$, with
 $\varsigma =0.17$, which gives the same integral value of the experimental step-down defect used in Decré & Baret (Reference Decré and Baret2003) and does not vary with time. In the inertialess case and with the absence of defects, the flow over an inclined plane is stable and the solution is a film of constant thickness (Kalliadasis et al. Reference Kalliadasis, Ruyer-Quil, Scheid, Velarde and García2011). The presence of a localized steady defect creates a region close to the depression characterized by a variation of the free surface elevation
 $\eta +\eta ^{0}$ (see figure 19a). In the region just upstream of the depression, there is a small increase in the free surface elevation, followed by a strong decrease. Downstream, there is an overshoot greater than the initial thickness followed by a recovery of the flat film conditions. In figure 19(b) we show a comparison of the results of our model with the experimental and theoretical results of Decré & Baret (Reference Decré and Baret2003), for the free surface elevation at
 $y=0$. Results are rescaled using their non-dimensionalization. The comparison shows a good agreement, thus validating the numerical procedure.
Two-dimensional linear response in the presence of a localized steady defect for the flow over an inclined planar substrate at  $y=0$ as a function of the streamwise coordinate, for
 $u=16.75$. Results are rescaled using the non-dimensionalization reported in Decré & Baret (Reference Decré and Baret2003) (
 $L_d=(\gamma h_N /3\rho g \cos (\theta ))^{1/3}$). (a) Response in the
 $(x,y)$ plane. (b) Comparison between the experimental (red dots) and numerical (black stars) results of Decré & Baret (Reference Decré and Baret2003) and the numerical solution (blue line).

Appendix B. Evaluation of the imaginary part of the spatial wavenumbers from the spatio-temporal growth rate
In this appendix, we demonstrate (4.15) and (4.16) by generalizing to the two-dimensional case the approach outlined in Delbende et al. (Reference Delbende, Chomaz and Huerre1998). We consider
 \begin{equation} \omega^{\prime \prime} \left(v_{x}, v_{y}\right) =\omega-k_{x} v_{x}-k_{y} v_{y}. \end{equation}
We derive (B1) with respect to the group velocity  $v_x$ along the
 $x$ direction,
 \begin{equation} \frac{\partial \omega^{\prime \prime}}{\partial v_{x}}=\frac{\partial \omega}{\partial v_{x}}-\frac{\partial k_{x}}{\partial v_{x}} v_{x}-k_{x}-\frac{\partial k_{y}}{\partial v_{x}} v_{y}. \end{equation}
Since  $\omega =\omega (k_x,k_y)$, we evaluate the derivative as follows:
 \begin{equation} \frac{\partial [\omega \left(k_{x}, k_{y}\right)]}{\partial v_{x}}=\underbrace{\frac{\partial\omega}{\partial k_{x}}}_{v_{x}} \frac{\partial k_{x}}{\partial v_{x}}+\underbrace{\frac{\partial\omega}{\partial k_{y}}}_{v_{y}} \frac{\partial k_{y}}{\partial v_{x}}, \end{equation}
where  $v_x$ and
 $v_y$ are real (Delbende et al. Reference Delbende, Chomaz and Huerre1998). Substituting in (B2), the imaginary part of the streamwise wavenumber is obtained as
 \begin{equation} \mathrm{Im}\left(k_{x}\right) =-\frac{\partial \sigma}{\partial v_{x}}. \end{equation}
Deriving  $\omega ^{\prime \prime }$ with respect to
 $v_y$ and following the same procedure,
 $\mathrm {Im}(k_y)$ reads
 \begin{equation} \mathrm{Im}\left(k_{y}\right) =-\frac{\partial \sigma}{\partial v_{y}}. \end{equation}
Appendix C. Results of the post-processing algorithm for  $C=10^{-3}$

In this section, for the sake of completeness, we report the results of the post-processing algorithm of § 4 applied for the case in the presence of the deposition process (§ 5.3), for  $C=10^{-3}$. The results, reported in figure 20, are similar to those observed in the case
 $C=10^{-5}$ (figure 8), with a front downstream of the initial position more curved and the region where the two contributions (quasi-steady and spatio-temporal) interact displaced downstream.
Asymptotic properties from the post-process algorithm (§ 4), for  $u=0.77$ and
 ${C}=10^{-3}$. (a) Spatio-temporal growth rate. (b) Real part of the complex frequency. (c) Imaginary part of the streamwise wavenumber. (d) Real part of the streamwise wavenumber. (e) Imaginary part of the spanwise wavenumber. (f) Real part of the spanwise wavenumber.

Appendix D. Nonlinear front in the absence of substrate variations
In this appendix, we report the results of the evaluation of the nonlinear front for the case in the absence of substrate variations, for  $u=3.85$. The results, reported in figure 21, show a deformation of the front similar to figure 17, without the quasi-steady part propagating downstream.
(a) Isolevels of  $|\eta |$ as a function of
 $x$ and
 $t$, for
 $y=0$. The red dashed lines denote the linear front, while the black line the isolevel that well approximates the front at small times. The inset gives thickness profile for
 $t=108$. (b) Isolevel of
 $|\eta |$ approximating the nonlinear front, for
 $t=50$ (blue line) and
 $t=125$ (green line). The red line denotes the linear front in absence of substrate variations (
 $u=3.85$, no substrate variations).



