Introduction
The paradigm of semantic interference has been described as a “cognitive stress test” that identifies subtle deficits characteristic of very early Alzheimer's disease (AD) (Loewenstein et al., Reference Loewenstein, Acevedo, Luis, Crum, Barker and Duara2004; Loewenstein et al., Reference Loewenstein, Curiel, Duara and Buschke2017). The Semantic Interference Test (SIT) is a modification of the three-trial Fuld Object Memory Evaluation (Fuld-OME) (Fuld, Reference Fuld1981), which consists of learning trials of 10 actual common objects. In the SIT modification, a second group of objects semantically related to the first group (e.g. matches vs. lighter) is introduced, allowing the assessment of proactive and retroactive semantic interference. Proactive semantic interference (PSI) occurs when old learning interferes with new learning of a semantically similar list of different targets. Conversely, retroactive interference (RSI) refers to difficulties recalling the original targets as a function of learning the semantically related new targets.
The Fuld-OME and SIT have been shown to have little cultural or language bias and to have no or only weak associations with education level (Lowenstein, Reference Lowenstein1995; Snitz et al., Reference Snitz2010). However, the SIT might function somewhat differently in different study settings for the following reasons: first, any given test with established sensitivity and specificity for a particular outcome can have different predictive values in different study populations depending upon the underlying distribution of the outcome in those populations. For example, positive predictive value (PPV) will be high in a population with high prevalence of a disorder such as AD, especially one that has been enriched for that disease such as a specialized research clinic. Second, since semantic interference is associated with the particular type of cognitive decline seen in AD, the efficacy of SIT observed in AD research clinical samples may be greater than in more heterogeneous population-based samples.
Clinical thresholds for identification of AD have been established for the SIT which have yielded high sensitivity and specificity in clearly defined clinical samples with a high probability of underlying AD (Loewenstein et al., Reference Loewenstein, Acevedo, Luis, Crum, Barker and Duara2004; Loewenstein et al., Reference Loewenstein, Acevedo, Agron and Duara2007). Moreover, these thresholds have been strongly related to total and regional brain amyloid load in community-dwelling elderly adults who have otherwise normal scores on traditional neuropsychological tests (Loewenstein et al., Reference Loewenstein2015). However, it cannot be assumed that those thresholds that best distinguish between diagnostic groups are also the most appropriate to predict the likelihood of progression of mild cognitive impairment (MCI) to dementia over time. Also unknown is whether optimal thresholds for predicting progression might differ in specialty clinical versus community samples, between which the underlying prevalence of AD and other dementias would vary considerably.
In this investigation, we examined the data of a large population-based cohort as well as a sample of participants in an Alzheimer's Disease Research Center (ADRC) registry. We empirically derived thresholds that optimally distinguished between progressors and non-progressors from MCI to dementia, independently for each cohort, and for each of several specific SIT component measures (assessing initial recall, recall vulnerable to PSI, recall vulnerable to RSI, and the combined interference score). We explored how optimal thresholds might differ in the two samples and determined the extent to which these thresholds were useful for tracking progression.
Our hypotheses were that (1) Optimal thresholds predicting MCI progression to dementia would be lower (i.e. worse or more impaired) than optimal clinical thresholds previously established for distinguishing MCI from normal cognition. (2) Optimal thresholds would more clearly differentiate MCI progressors to dementia from non-progressors in the ADRC registry than in a population-based cohort in which the underlying prevalence of AD and other dementias is likely to be lower.
Methods
Participants
Clinical sample
The clinical sample comprised 184 individuals aged 65 and older who were part of the Florida ADRC program beginning in 2005 and followed annually for up to four years. Some participants came to the ADRC as patients, others as spouses or normal volunteers, while some were referred from memory screening programs in the community. All of these individuals were diagnosed with MCI at baseline by an experienced clinician who completed a Clinical Dementia Rating (CDR) (Hughes et al., Reference Hughes, Berg, Danziger, Coben and Martin1982). Based on this interview and cognitive and functional history from the identified informant, the clinician diagnosed MCI if (a) there was a complaint about memory or other cognitive functions; (b) the clinician made a determination that based on informant report, there had been a decline in cognitive function; (c) the individual was able to independently manage ADLs and IADLs; and (d) there was no evidence of dementia by DSM-IV criteria after a diagnostic case conference. We excluded participants who were missing any SIT variables at baseline. Approximately, 20% of participants evaluated at baseline were lost to follow-up.
Population-based sample
The population cohort was drawn from the Monongahela-Youghiogheny Healthy Aging Team (MYHAT) study, a longitudinal study based in a region of southwestern Pennsylvania (Ganguli et al., Reference Ganguli, Snitz, Vander Bilt and Chang2009). Starting in 2006, an age-stratified sample was randomly recruited from publicly available voter registration records. Eligibility criteria included age 65 or over, living within the designated area, and not living in a long-term care institution. Participants were excluded if they were too ill to participate, too impaired in vision or hearing, decisionally incapacitated, or had substantial cognitive impairment defined as an age-education-corrected Mini-Mental State Examination (MMSE) score of less than 21 out of 30 (Folstein et al., Reference Folstein, Folstein and McHugh1975; Mungas et al., Reference Mungas, Marshall, Weldon, Haan and Reed1996). A total of 1982 participants met these criteria and underwent baseline and annual follow-up assessments for a maximum of seven total assessments. For the present study, we used CDR, which was not assigned on the basis of SIT or other neuropsychological test scores, to designate participants with MCI (CDR = 0.5) and dementia (CDR ≥ 1) (Ganguli et al., Reference Ganguli2010a). Research interviewers underwent systematic training and certification in the use of the CDR in the population setting (Ganguli et al., Reference Ganguli, Chang, Snitz, Saxton, Vanderbilt and Lee2010b). We restricted present analyses to those with CDR of 0.5 at baseline (n = 546) and full SIT data at baseline (n = 529). Approximately, 18% of participants were lost to follow-up, resulting in a sample size of 435. We truncated follow-up time at a maximum of four years to match that of the clinical sample.
Memory assessment: Fuld-OME and SIT
Participants completed the three-trial version of the Fuld-OME, in which they attempt to identify ten common household objects placed into a cloth bag (Bag A), first by touch and then by sight. Interposed with distracter tasks, they try to recall, with selective reminders, the ten items on three subsequent trials. Total Fuld Recall score is the sum of items correctly recalled in the three trials (maximum 30 points). The SIT introduces a second bag (Bag B) with ten different but semantically related household objects (e.g. substituting bracelet for ring). After the three trials of Fuld-OME, participants identify the items in Bag B in the same manner as for Bag A. They are then asked to recall these items (Bag B Recall, susceptible to PSI, maximum ten points). Then, they are asked to recall the items in Bag A again (Bag A Recall, susceptible to RSI, maximum ten points). In our analyses, we also considered the sum of Bag B Recall and Bag A Recall (Combined Interference Score).
Statistical methods
Sample characteristics
We generated descriptive statistical summaries to characterize the clinical and population-based samples and performed significance testing to assess differences between the two samples as well as between non-progressors and progressors to dementia within both samples. Statistical significance was set at p < 0.05.
Assessing comparability of MCI and dementia diagnoses
Since different methodologies were used to assign MCI and dementia diagnoses in the two studies, we compared mean CDR Sum of Boxes and neuropsychological test scores for progressors to dementia in the two samples, using Wilcoxon rank sum test and Welch's t-test, respectively, both at baseline and at the time of dementia diagnosis. In addition to Fuld-OME and SIT, neuropsychological tests administered in both study settings included the MMSE (Folstein et al., Reference Folstein, Folstein and McHugh1975), WMS-R Logical Memory (immediate and delayed recall) (Wechsler, Reference Wechsler1987), WMS-R Visual Reproduction (immediate and delayed recall) (Wechsler, Reference Wechsler1987), and Trail Making Test B (Reitan, Reference Reitan1958).
Optimal thresholds
Treating progression to dementia (observed within a maximum of four years of follow-up) as a binary outcome, we used receiver operating characteristic (ROC) analysis methods to determine optimal thresholds independently in the clinical and population samples for the four test scores of interest. We used two different criteria for establishing the optimal thresholds: (1) Youden's J statistic, which chooses the threshold that maximizes the sum of sensitivity and specificity; and (2) the threshold of maximum specificity that achieved a minimum sensitivity of 70%. We chose this minimum specificity criterion because the Youden's J statistic weights sensitivity and specificity equally, which could produce optimal thresholds that behave quite differently (e.g. a threshold with 20% sensitivity and 70% specificity would have the same J statistic as one with 70% sensitivity and 20% specificity). We wanted to compare optimal thresholds in the two samples in cases where we knew that at least 70% of progressors were identified. A sensitivity of 70% was chosen as the threshold because the results using the Youden's J statistic criterion yielded highest sensitivities close to 70%. We calculated the areas under the ROC curve (AUC), and for each optimal threshold we determined sensitivity, specificity, PPV, negative predictive value (NPV), classification accuracy, and Youden's J statistic. We repeated the analyses on 10,000 empirical bootstrap samples (stratified so as to maintain the same number of progressors and non-progressors) and used the 2.5th and 97.5th quantiles of the distributions of the statistics to form 95% confidence intervals for these quantities. Non-overlapping confidence intervals were considered to indicate a statistically significant difference.
Adjusting for covariates
To further assess the behavior of the optimal thresholds in the two samples, we created binary variables using the set of optimal thresholds established for the clinical sample under the Youden's J criterion. For each SIT measure, we fitted an unadjusted logistic regression model with the binary test score variable, a sample indicator variable, and the interaction of the two as predictors. This allowed us to calculate odds ratios for both samples and to test whether the thresholds predicted progression differently across samples. To account for differences in baseline characteristics between the two samples, we then adjusted these models for age, sex, years of education, race/ethnicity, baseline CDR Sum of Boxes, and a baseline test composite combining scores from the other neuropsychological tests mentioned previously. To create the composite, test scores were each standardized using the baseline means and standard deviations from the pooled sample data, and then averaged together (negative Trail Making Test B scores were used since higher scores indicate worse performance). For the approximately 12% of participants who were missing one or more test scores, composites were formed using available tests. We also fitted unadjusted and adjusted Cox proportional hazards models to account for differences in follow up time and censoring. We employed log–log survival plots to check the proportional hazards assumption for the Cox models.
All statistical analyses were performed using R version 3.3.3 and the packages pROC (Robin et al., Reference Robin2011) and survival (Therneau, Reference Therneau2015).
Results
Sample characteristics
Comparing clinical and population samples
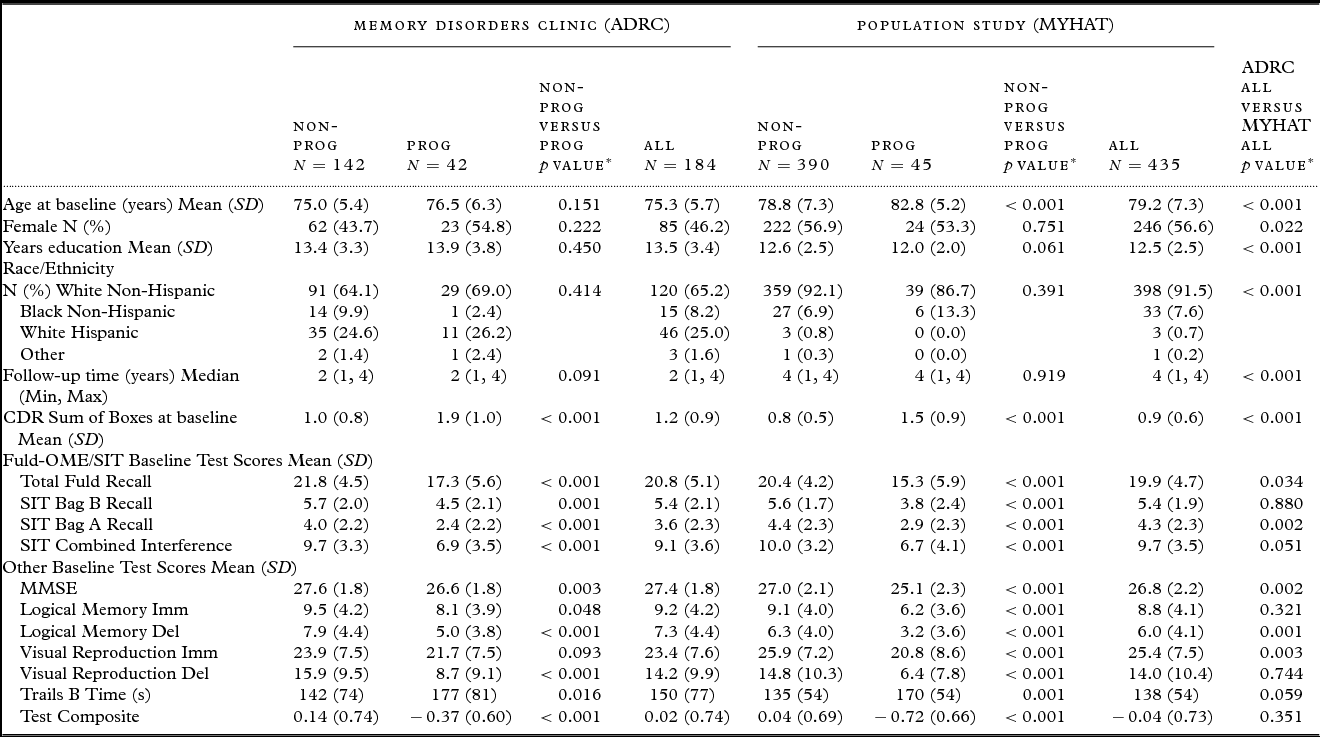
Sample characteristics are summarized in Table 1. Within four years of follow-up, 42 (22.8%) individuals in the clinical sample and 45 (10.3%) individuals in the population sample progressed to dementia (Fisher's exact test p < 0.001). The mean (SD) times to dementia were 1.90 (0.82) years for the clinical sample and 2.51 (1.04) years for the population sample (Welch's t(82.9) = 3.04, p = 0.003); incidence rates for dementia were 105.0 and 33.1 cases per 1,000 person-years, respectively. The two samples differed significantly in all demographic variables considered. The clinical sample was younger, had a greater proportion of men, had more years of education, and was more ethnically diverse with a greater proportion of Hispanic participants than the population sample. Median follow-up time was shorter in the clinical sample. While baseline CDR Sum of Boxes indicated slightly greater impairment in the clinical sample than the population sample, baseline test composite scores showed the opposite trend, although this difference was not significant.
Participant characteristics

*Welch's t-test for continuous variables, Fisher's exact test for categorical variables, Wilcoxon rank sum test for follow-up time, and CDR Sum of Boxes.
Notes: Total Fuld Recall assesses total list recall; SIT Bag B Recall assesses proactive semantic interference; SIT Bag A Recall assesses retroactive semantic interference, and SIT Combined Interference is the sum of the latter two scores. Test Composite is the mean of the six test scores directly above, after standardization of the scores using means and standard deviations calculated from the pooled clinic and population study baseline data (negative Trails B Time was used since higher scores indicate worse performance).
Abbreviations: ADRC = Alzheimer's Disease Research Center; MYHAT = Monongahela–Youghiogheny Healthy Aging Team; Prog = Progressors to dementia during follow-up; NonProg = Non-Progressors to dementia during follow-up; CDR = Clinical Dementia Rating; Fuld-OME = Fuld Object Memory Evaluation; SIT = Semantic Interference Test; MMSE = Mini-Mental State Examination; Imm = Immediate; Del = Delayed; Trails B = Trail Making Test B.
ADRC missing: one Logical Memory Delayed, one Visual Reproduction Immediate, one Visual Reproduction Delayed, four Trails B Time.
MYHAT missing: 10 Logical Memory Immediate, 18 Logical Memory Delayed, 18 Visual Reproduction Immediate, 26 Visual Reproduction Delayed, 49 Trails B Time.
Comparing progressors and non-progressors to dementia within samples
The clinical sample evidenced no significant differences in demographics or follow-up time between non-progressors and progressors. In the population-based sample, progressors were older than non-progressors, with no other significant differences in demographics or follow-up time. For both samples, Fuld, SIT, and other neuropsychological test score means at baseline all indicated significantly worse performance in the progressors than non-progressors.
Assessing comparability of MCI and dementia diagnoses
The clinical sample progressors to dementia had mean (SD) baseline CDR Sum of Boxes of 1.9 (1.0), slightly higher than the population sample progressors to dementia mean (SD) of 1.5 (0.9) (p = 0.027). However, at the time of dementia diagnosis the clinical sample progressors had a lower mean (SD) CDR Sum of Boxes, which was 4.5 (2.2) versus 5.2 (1.6) for the population sample progressors (p = 0.002). Neuropsychological test composite scores were higher for the clinical sample progressors at baseline, with mean (SD) −0.37 (0.60) versus −0.72 (0.66) for the population sample (p = 0.011), and at the time of dementia diagnosis, with mean (SD) −1.24 (0.81) versus −1.77 (0.85) for the population sample (p = 0.004). Within subject change in CDR Sum of Boxes was smaller for clinical sample progressors (mean (SD) 2.6 (2.4)) than for the population sample progressors (mean (SD) 3.7 (1.8), p = 0.013). Within-subject change in test composite scores were not significantly different, with mean (SD) of −0.88 (0.98) for the clinical sample and −1.05 (1.00) for the population sample (p = 0.425). Results for individual neuropsychological tests are presented in (see Table S2, available as supplementary material attached to the electronic version of this paper at www.journals.cambridge.org/jid_IPG).
Optimal thresholds
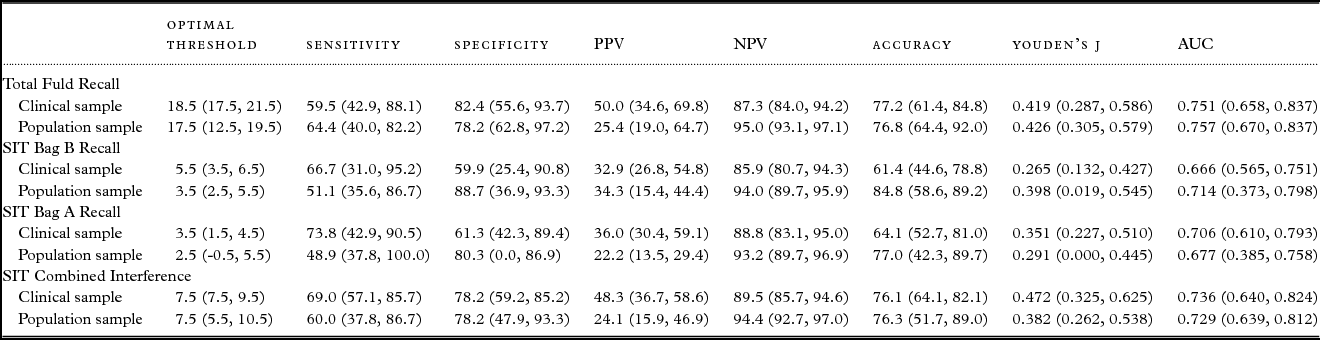
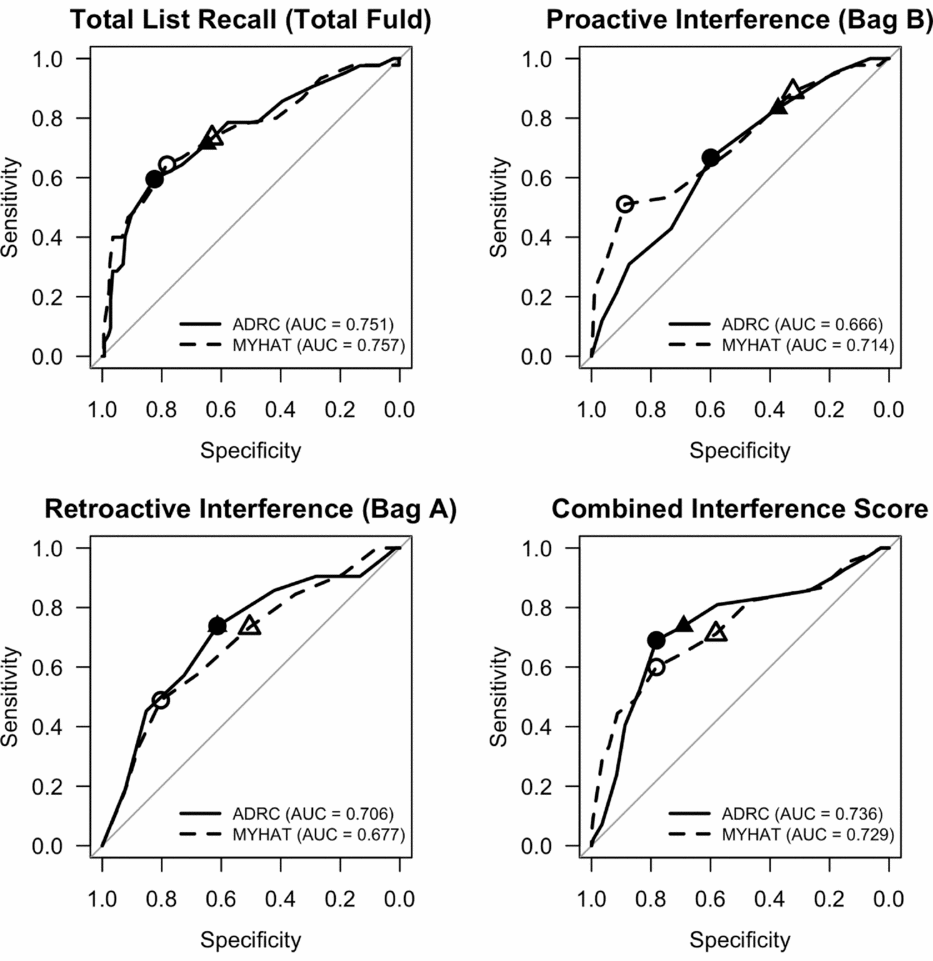
In both the clinical and population samples, AUC was highest for Total Fuld Recall, which yielded an AUC of approximately 0.75 for both (Table 2, Figure 1). According to the 95% bootstrap confidence intervals the AUC did not differ significantly between the samples for any of the tests. Optimal threshold results for the Youden's J statistic criterion are summarized in Table 2. Bag A Recall threshold yielded a significantly higher PPV in the clinical sample; the other quantities were not significantly different. Optimal threshold results for the sensitivity ≥ 70% criterion are summarized in (see Table S1, available as supplementary material attached to the electronic version of this paper at www.journals.cambridge.org/jid_IPG). Again, we found a significantly higher PPV for Bag A Recall in the clinical sample and the other quantities were not significantly different. However, the point estimates for specificity, PPV, and accuracy were consistently higher in the clinical sample, and NPV was consistently higher in the population-based sample.
Optimal Semantic Interference Test (SIT) thresholds (yielding maximum sensitivity + specificity) for predicting progression to dementia in the two samples (with 95% bootstrap confidence intervals)

Notes: Total Fuld Recall assesses total list recall; SIT Bag B Recall assesses proactive semantic interference; SIT Bag A Recall assesses retroactive semantic interference, and SIT Combined Interference is the sum of the latter two scores. Youden's J = sensitivity/100 + specificity/100 – 1.
Receiver operating characteristic (ROC) curves depicting sensitivity and specificity for thresholds on baseline Semantic Interference Test subtests for predicting progression to dementia within 4 years of follow-up in the clinical (ADRC) and population-based (MYHAT) samples. Circles indicate optimal thresholds derived using Youden's J criterion; triangles indicate thresholds of maximum specificity yielding at least 70% sensitivity. Solid lines and plotting points are used for clinical sample and dashed lines and open plotting points are used for population-based sample.

Adjusting for covariates
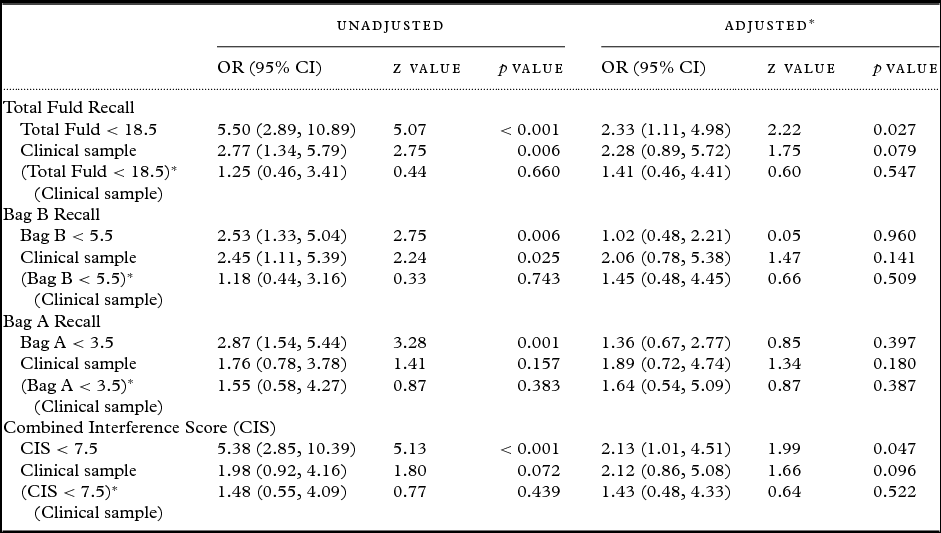
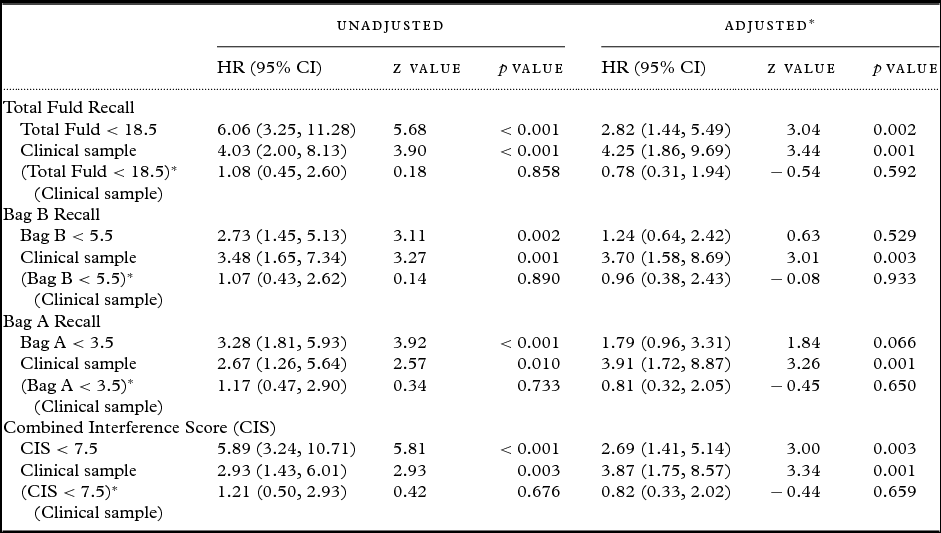
Logistic regression (Table 3) and Cox proportional hazards models (Table 4, Figure S1, available as supplementary material attached to the electronic version of this paper at www.journals.cambridge.org/jid_IPG.) demonstrated no significant interaction between the binary threshold variables and the clinical sample indicator in any of the unadjusted or adjusted models. The clinical sample indicator variable had an odds or hazard ratio significantly greater than one in most unadjusted and all of the adjusted models, consistent with a higher overall risk for progression in the clinical sample.
Unadjusted and adjusted logistic regression odds ratios for progression to dementia during follow-up

*Adjusted for age, sex, years of education, race/ethnicity, baseline CDR sum of boxes, and baseline neuropsychological test composite score.
Notes: Total Fuld Recall assesses total list recall; SIT Bag B Recall assesses proactive semantic interference; SIT Bag A Recall assesses retroactive semantic interference, and SIT Combined Interference is the sum of the latter two scores.
The reference level for the regression models is a test score above the noted threshold and membership in the population-based sample. Notation such as (Total Fuld < 18.5)*(Clinical sample) denotes the interaction between the binary variable encoding test score (equals 1 if score is below threshold, zero otherwise) and the binary variable indicating sample (equals 1 if participant is from the clinical sample, zero if from the population-based sample).
Abbreviations: SIT = Semantic Interference Test, CIS = Combined Interference Score, OR = odds ratio, CI = confidence interval.
Unadjusted and adjusted Cox proportional hazard ratios for time to dementia

*Adjusted for age, sex, years of education, race/ethnicity, baseline CDR sum of boxes, and baseline neuropsychological test composite score.
Notes: Total Fuld Recall assesses total list recall; SIT Bag B Recall assesses proactive semantic interference; SIT Bag A Recall assesses retroactive semantic interference, and SIT Combined Interference is the sum of the latter two scores.
The reference level for the regression models is a test score above the noted threshold and membership in the population-based sample. Notation such as (Total Fuld < 18.5)*(Clinical sample) denotes the interaction between the binary variable encoding test score (equals 1 if score is below threshold, zero otherwise) and the binary variable indicating sample (equals 1 if participant is from the clinical sample, zero if from the population-based sample).
Abbreviations: SIT = Semantic Interference Test, CIS = Combined Interference Score, HR = hazard ratio, CI = confidence interval.
Discussion
As dementia, including AD, becomes an increasingly urgent public health issue, it is important to identify where preventative efforts will have the most impact. Accordingly, many biomarkers and cognitive assessments have been studied for the purpose of identifying individuals with MCI who are most at risk of progression. The SIT, a cognitive stress test and an extension of the three-trial Fuld Object Memory Evaluation, has been developed as a sensitive measure that, unlike other verbal memory measures, shows minimal cultural and educational bias in both clinical and population-based studies (Loewenstein et al., Reference Loewenstein, Acevedo, Luis, Crum, Barker and Duara2004; Snitz et al., Reference Snitz2010). Previous research has demonstrated that thresholds of 19.5 or 20.5 (i.e. scores of less than 20 or 21 indicating likely impairment) for Total Fuld Recall, 4.5 for Bag B Recall (PSI trial), and 8.5 for Combined Interference Score (total interference trial) have been optimal for differentiating clinical cases with amnestic MCI (aMCI) from cognitively normal older adults (Loewenstein et al., Reference Loewenstein, Acevedo, Luis, Crum, Barker and Duara2004).
In the present study, we extended our work by comparing the utility of SIT for predicting progression of MCI to dementia within four years of follow-up in two different samples: a well-characterized clinical sample and a well-defined population-based sample. We found that, despite differences in distributions of age, years of education, gender, race and ethnicity, and rate of progression to dementia, the SIT performed similarly for predicting progression in both samples. Specifically, the SIT subtests had comparable AUC across samples, the optimal thresholds were in many cases the same across samples (or differed by at most two points, depending on the test and optimality criterion), and for one particular set of thresholds there were no significant differences in the dichotomized test score effect across samples in both unadjusted and adjusted regression models.
Our original hypothesis was that optimal thresholds for identifying progressors in both the clinical and population-based samples would be more impaired (i.e. lower) than previously observed optimal thresholds for differentiating persons clinically diagnosed with aMCI from cognitively normal older adults. We found that optimal thresholds determined in the present study under the same criterion (Youden's J, which yielded Total Fuld Recall thresholds of 17.5 and 18.5, Bag B Recall thresholds of 3.5 and 5.5, and Combined Interference Score threshold of 7.5 for both samples) are in fact slightly lower than the aforementioned clinical thresholds, with the exception of the threshold for Bag B Recall in the clinical sample. This suggests that those with MCI who are most at risk for progression may be more susceptible to semantic interference than MCI non-progressors, and further establishes the utility of SIT indices for clinical purposes. Unsurprisingly, the sensitivity, specificity, overall accuracy, and AUC tended to be lower for predicting MCI progression in the clinical sample than previously reported values for discrimination between clinically diagnosed aMCI and cognitively normal older adults in a clinical sample (Loewenstein et al., Reference Loewenstein, Acevedo, Luis, Crum, Barker and Duara2004). However, overall accuracy for the population-based sample was higher than previously reported in the case of Bag B Recall (81.3% vs. 84.8% in the present study) and Bag A Recall (76.2% vs. 77.0% in the present study), possibly due to the high specificity of these thresholds resulting from the lower incidence of dementia in the population-based sample.
The finding that the optimal MCI progression threshold for Bag B Recall score (vulnerable to PSI) was one point higher in the clinical sample than the threshold found to best differentiate aMCI from cognitively normal adults contrasts with a previous study conducted by Loewenstein et al. (Reference Loewenstein, Acevedo, Agron and Duara2007): In a sample of 76 predominantly clinically diagnosed MCI subjects, 35.5% progressed to dementia over an average 21 month period of follow-up. Bag B Recall was the neuropsychological measure most predictive of progression, and a threshold of 4.5 on Bag B Recall of the SIT best distinguished those who progressed to dementia. The resulting (leave-one-out cross-validated) sensitivity was 70.4% while specificity was 73.5% (AUC = 0.775), which were higher than the present study's sensitivity of 66.7% and specificity of 59.9% (AUC = 0.666) for the clinical sample. It should be noted that over 85% of individuals in the Loewenstein et al. (Reference Loewenstein, Acevedo, Agron and Duara2007) study were diagnosed with an underlying neurological condition (AD, cerebral infarctions, diffuse Lewy body disease), and this group had lower mean Bag B Recall scores at baseline than the present study's clinical sample.
We also hypothesized that optimal SIT thresholds would discriminate between MCI progressors and non-progressors better in the clinical ADRC sample due to its likely greater proportion of AD patients than the population cohort. We did find that more than double the proportion of MCI participants progressed to dementia in the clinical versus the population sample over a four year period. However, there were no consistent differences in the discrimination performance of the SIT subtests as measured by AUC and overall classification accuracy (for thresholds found using Youden's J criterion). Moreover, the effect of SIT thresholds were similar in both cohorts, despite the differences between the two groups, and even after covariate adjustment for differences in initial demographic characteristics.
Yet, when sensitivity was fixed at a minimum of 70%, PPV for all optimal thresholds established in the clinical sample was greater than for the corresponding thresholds in the population-based cohort (which tended to have higher NPV values). Since predictive value is a function of underlying prevalence, the higher PPV and lower NPV in the clinical group likely reflected a greater underlying prevalence of AD and other dementia-causing diseases. Specificity and accuracy were also consistently higher for the clinical sample under this minimum sensitivity criterion. Although it was revealing of differences between the two samples in the present study, we do not recommend setting sensitivity at a minimum of 70% to identify those at risk of MCI progression in the population-based sample, given the resulting low PPV.
Our aim of comparing the performance of a cognitive stress paradigm across clinical and population samples was primarily motivated by the inherent differences in the characteristics of participants in the two samples: patients and volunteers at a memory disorders clinic versus randomly selected older adults in the community at large. The former represents a sample enriched for AD, with its inherent selection bias, while the latter has a much lower prevalence of AD but is representative of and therefore generalizable to the population from which it is drawn. It is therefore particularly remarkable that we found comparable performance of SIT subtests in predicting progression from MCI to dementia in the two samples.
However, the validity of our conclusions depends upon the comparability of the MCI and dementia diagnoses in both study settings. Even though the CDR was used to classify participants in both studies, clinic participants and their required informants underwent in-depth assessments by experienced clinicians, while population study participants, mostly without informants, had systematic protocol assessments by trained research interviewers. To assess the comparability of diagnoses across studies, we examined CDR Sum of Boxes and neuropsychological test scores for progressors to dementia in both samples at baseline and at the time of dementia diagnosis. Progressors in the clinical sample were slightly more impaired than those in the population sample at baseline based on CDR Sum of Boxes, but less impaired according to the neuropsychological test composite score. At the time of dementia diagnosis, the population sample progressors were more impaired according to both measures, and showed a significantly greater increase in CDR Sum of Boxes. While these between-sample differences were significant, their magnitudes were not large and were smaller than the magnitude of within-subject change from baseline to dementia diagnosis, which itself was not significantly different according to what may be considered the more objective measure of the two – the neuropsychological test composite. Nonetheless, the incorporation of neuropsychological measures explicitly into the MCI and dementia diagnoses may be a better approach to control for diagnostic methodological differences.
While the SIT-paradigm has advantages of being easy to administer, is more culture and language-fair, has minimum educational bias, and translates well from clinic versus population-based studies, it is only one measure, and future studies should determine if incremental predictive power in both population and clinical samples can be obtained by combining multiple cognitive measures tapping different domains. Newer cognitive stress tests such as the Loewenstein–Acevedo Scales of Semantic Interference and Learning (LASSI-L; analogous to an exercise electrocardiogram in cardiology) may be more sensitive to early disease and correlates more strongly with biological markers (Loewenstein et al., Reference Loewenstein2016; Loewenstein et al., Reference Loewenstein, Curiel, Duara and Buschke2017).
The results of this investigation demonstrates the importance of establishing the utility of both established and novel cognitive instruments in diverse samples. The target population and underlying prevalence of expected disease will make an important difference in establishing ideal thresholds. Different research questions will determine the need to opt for different balances between sensitivity and specificity, particularly as they relate to different study populations. Our study also highlights the varied uses of neuropsychological assessment: (a) differentiating normal from abnormal performance; (b) differentiating between different diagnostic groups; and (c) delineating those individuals at most risk for disease progression.
Conflict of interest
None.
Description of authors’ roles
J. C. Beer was responsible for statistical design and analyses and contributed to writing the manuscript including writing the first draft. B. E. Snitz and C.-C. H. Chang contributed to writing the manuscript. D. A. Loewenstein was responsible for design of the clinical study, is the developer of the SIT, and contributed to writing the manuscript. M. Ganguli was responsible for design of the population-based study and contributed to writing the manuscript.
Acknowledgments
We thank Dr. Duara Ranjan and the Wien Center for AD and Memory Disorders at Mount Sinai Medical Center for collecting the clinical sample data. The work reported here was supported in part by the following grants: R01AG023651, K07AG044395, 1P50AG025711-05, and R01AG047649-01A1 from the National Institute on Aging, United States Department of Health and Human Services.
Supplementary material
To view supplementary material for this article, please visit https://doi.org/10.1017/S1041610217002666