Rising income inequality has been a defining trend of the past generation, yet we know little about its impact on social policy formation. The American Political Science Association's recent Task Force on Inequality and American Democracy emphasized the importance of this question in its summary report and subsequent book. That report captured well what we know about enduring attitudes toward inequality, opportunity, and government redistribution. However, because of gaps in existing research, the report could not document whether these had changed in any significant respect in response to the rise in income inequality over the past several decades.Footnote 1 We address this question directly by examining changes in attitudes about income inequality, changes in social policy preferences, and the link between them during the 1980s and 1990s.
Although the APSA Task Force report identified data limitations as the primary reason for our lack of progress on this question—a claim with which we agree and will discuss further—we think there are theoretical limitations at play as well. There is a rich and nuanced literature on American views about inequality, opportunity, and government redistribution, but only two views are on display in the discussion of public opinion on rising inequality, and both have led to dead ends. One is that Americans do not care much about inequality of outcomes (as opposed to inequality of opportunity), and hence rising inequality should not produce a change in preferences for government policy. The other, identified with median-voter models of the political process, is that a rise in inequality will lead to an increase in demand for government redistribution. Our examination of the best available evidence in the 1980s and 1990s suggests little support for these views, at least for this particular period of rising inequality. Instead, Americans do object to inequality and increasingly believe government should act to redress it, but not necessarily via traditional redistributive programs. We examine several alternative possibilities and discuss others that ought to be considered in future research but that cannot be evaluated at this time with available data.
We begin by presenting a broad analytical framework for understanding how Americans think about income inequality and about how to address it. The breadth of our framework is necessitated by new social conditions—the era of rising inequality—as well as the need to bring theoretical perspectives on beliefs about inequality into conversation with more recent research on social policy preference formation. Our framework encompasses social policies that scholars typically associate with direct reductions in income inequality (e.g., transfers of income from the rich to the poor) as well as social policies that they do not (e.g., education, health care, and social security). In addition to organizing our analysis and discussion here, this framework should prove useful in guiding future data collection and research on the political dimensions of rising income inequality. Next, we describe the data sources we use in assessing public opinion and briefly document the rise in inequality in recent decades. We then proceed to empirically investigate the various paths specified by our framework.
Analytical Framework
Figure 1 outlines our analytical framework, consisting of a series of possible responses to an increase in income inequality (the theoretical rationale for each response is discussed later when we evaluate the evidence for or against it). The first possible response is one we have already alluded to: that Americans do not care about rising inequality and therefore do not alter their policy preferences in the presence of rising inequality (path 1.0). The second response is that they are concerned about it (path 2.0), in which case we suggest three potential reactions. One is a rise in support for traditional redistributive policies (2.1), such as greater transfers to the poor (2.1.1) and higher tax rates for the rich (2.1.2). A second possibility is that there is no change in desire for government action; rising inequality is worrisome to Americans, but they do not think government should or can attempt to address it (2.2). A third is that Americans object to rising inequality and want government to do something about it, but not (or not mainly or only) via traditional redistributive strategies (2.3).
Possible reactions to rising inequality

If Americans do not favor direct redistributive transfers of income, what type of government action do they favor? Here we distinguish five potential reactions. First, people may interpret rising inequality of outcomes as an indication of excessively unequal opportunities (2.3.1). This may elicit support for government action to expand opportunity, for example through greater spending on education. The second and third possible reactions follow from trends in earnings and employer-provided benefits during the era of rising inequality. For most Americans without a college degree, earnings and benefits have declined, stagnated, or grown only modestly. To keep up with the costs of living, Americans may desire greater assistance from government, either through increased spending on services such as medical care or child care (2.3.2) or via increased generosity of social insurance programs such as social security and unemployment compensation (2.3.3). Since these programs benefit people in need but are not targeted to the poor and do not involve transfers of income without contributions, they are not typically viewed as redistribution even though in practice they have a strong redistributive component.
Fourth, rather than programs that involve government expenditures, Americans may prefer that government impose or heighten regulations on employers that help to ameliorate market inequality (2.3.4). Examples include increasing the statutory minimum wage, protecting and expanding compensation and employment bargaining rights, reducing immigrant employment, and limiting CEO pay (or penalizing “excessive” pay). Finally, Americans may be concerned about a rise in inequality but at a loss as to what government should do in response (2.3.5). As a result, they may gravitate toward whatever seemingly-relevant policy solution is currently at the forefront of political or media discussion.
Public Opinion Data
To explore these possibilities, we use data from the General Social Survey (GSS) and the International Social Survey Programme (ISSP). These data are the best available to assess the responses of Americans to rising income inequality, for three reasons. First, they are the only data that contains questions on multiple dimensions of income inequality (see appendix table A1 for a list of all questions). The American National Election Study (ANES) contains a battery of questions on attitudes about equality, but those questions do not reference income differences explicitly.Footnote 2 This is problematic because responses might reflect attitudes about racial or gender inequality, which in most respects have been declining in recent decades, rather than income inequality. This is a concrete instance of the kind of data limitations that the APSA Task Force encountered, and an enduring legacy of the 1970s and early 1980s when many survey items were first developed and yet income inequality was not considered a social problem (income inequality decreased between World War II and the mid-1970s). Second, the GSS/ISSP data include questions on social policy preferences as well as attitudes about income inequality. And third, questions on both income inequality and social policy preferences have been replicated over the time period in which income inequality was rising.Footnote 3
While these three features of the GSS/ISSP data are necessary to draw inferences about the relationship over time between American views of income inequality and social policy preferences, these data do have limitations. They suffer, in fact, from the same lack of attention to the issue of income inequality among survey designers in the 1970s and 1980s that we discussed above. Because replication of questions is (justifiably) prized above the introduction of new questions, questions on income inequality were not introduced into the GSS/ISSP until 1987, when they were included as a special module. They were then replicated in three additional years—1992, 1996, and 2000—as an initiative of the ISSP. Among these four years of data on attitudes about inequality, we have at least three years of data for all of the relevant social policy questions in the GSS/ISSP. Fortunately, every social policy question was asked in 1987 and all but one was asked in 1996, spanning a key period of rising inequality (as we will discuss further). However, several of the social policies that we identify as potentially associated with reducing inequality by the American public—such as the minimum wage, protection of wage bargaining rights, trade and immigration policy, and unemployment insurance—are not represented in the GSS/ISSP time series at all. Nonetheless, for theoretical completeness, we maintain them in our framework and include them in our discussion.
Although our central concern and contribution is to analyze the mechanism by which rising income inequality is transformed into policy preferences—via attitudes toward income inequality—we supplement our core analyses with a longer time series of descriptive data on our social policy questions. Several of these have been asked in every year of the GSS as part of its core modules. We also utilize public opinion surveys on social policy preferences from polling organizations, such as Pew and Gallup, to obtain trends over a longer time period. Finally, we report (in the notes) corroborating evidence from the ANES time series of questions on social policy preferences. Although we would prefer additional years of data, more detailed coverage of each policy domain, and coverage of a wider array of policy domains, the volume of data we analyze is substantial, and the overall patterns we observe allow us to draw several important conclusions about the consequences of rising inequality for public policy preferences.
The Rise in Inequality
To document the trend in actual income inequality, we use data from the March Current Population Survey (CPS). The survey asks approximately 50,000 American households about their earnings and income during the previous year. The Census Bureau uses these data to calculate the degree of income inequality among households, which is by far the most widely referenced measure in political discussion and debate and by journalists and scholars.Footnote 4 Since our aim is to examine the American public's response to changes in inequality and this is the measure they are most likely to be aware of during the period of our analysis, we focus on it here.Footnote 5Figure 2 shows the trend in income inequality from the early 1970s to the most recent year of data in 2006. Inequality is measured by the Gini coefficient, which is the portion of total household income that would need to be redistributed from high-income households to low-income ones in order to have a completely equal distribution. The diamond markers highlight the years for which we have attitudinal data: 1987, 1992, 1996, and 2000.
Income inequality
Note: Vertical axis is truncated. Years for which data on attitudes toward inequality are available—1987, 1992, 1996, and 2000—are highlighted with the diamond markers. The unit is households. The income measure is posttransfer-pretax. The Gini coefficient ranges from zero to one, with larger numbers indicating greater inequality.
Source: U.S. Census Bureau, www.census.gov/hhes/www/income/histinc/h04.html.

Inequality according to this measure increased between the late 1970s and the early 1990s, jumped between 1992 and 1993 because of a change in the Census Bureau's data collection methods, and then continued to increase through the end of the 1990s. Although not immediately apparent from the figure, the rate of increase was greater in the 1980s than in the 1990s. This is true for other measures of inequality as well, which all began to rise in the 1970s or 1980s and continued to rise for some part of the early to mid-1990s.Footnote 6 Developments in the second half of the 1990s are less straightforward, as different measures followed different trajectories. The Census Bureau's Gini measure increased moderately, but the share of income going to the top 1 percent of taxpayers grew sharply while the 90th/10th percentile ratio of individual hourly earnings declined.Footnote 7 Moreover, due at least in some part to these shifts in the actual trend, media coverage of inequality dropped off in the latter part of the 1990s after a marked increase in the early and middle part of the decade.Footnote 8
Because of this complexity, we make a few simplifying assumptions to guide our analytic approach in this paper. First, the general trend toward rising inequality was, according to all measures, well underway by the first year of GSS/ISSP public opinion data in 1987. But, second, public awareness of the trend most likely grew over the 1990s as income inequality continued to increase beyond a temporary blip, and the issue became more widely acknowledged by experts and discussed by the media and politicians.Footnote 9 Accordingly, we expect the first year of data on attitudes about income inequality, 1987, to be a reasonable baseline year against which to measure shifts in attitudes about inequality and related social policy preferences during the early and mid-1990s (1992 and 1996). Given the ambiguity in the trend in inequality in the second half of the 1990s coupled with a decline in media coverage during these years, we are open regarding the likely trajectory of attitudes and preferences over the late 1990s (2000).
Impact on Concerns about Inequality and Preferences for Government Action
No Change in Dissatisfaction with the Level of Inequality?
Perhaps the most commonly held view regarding American beliefs about inequality is that they do not care about it, or at least do not care about it very deeply. This view is often depicted in the media but is also held by a wide variety of public opinion experts and scholars. In a 2006 cover story on American inequality in The Economist, for example, the lead paragraph declared that “Americans do not go in for envy …. The gap between the rich and poor is bigger than in any other advanced country, but most people are unconcerned.”Footnote 10 This comparative perspective is often cited by scholars as well, who see Americans as accepting of “considerable disparities of income and wealth—much more than their European counterparts do,” and concerned more with equality of opportunity than equality of outcomes.Footnote 11 Regarding the particular issue of rising inequality, we see the same conclusions. For example, the co-author of a nuanced study of American attitudes about inequality found “little evidence that rising income inequality ever captured the public's imagination.”Footnote 12 Scholars have also expressed doubts based on the prima facie evidence that “no popular movement has arisen to challenge inegalitarian trends.”Footnote 13
Over-time changes in attitudes about inequality in the United States, however, do not square with this hypothesis. Figure 3 shows trends in the share of GSS/ISSP respondents agreeing with the statement that “differences in income are too large.” Respondents were allowed five choices: strongly agree, agree, neither agree nor disagree, disagree, and strongly disagree. The lower line in the chart shows the share choosing strongly agree; the upper line shows the share responding either strongly agree or agree. Both suggest a substantial rise in the share of Americans feeling income differences are too large between the late 1980s and the early 1990s and then a slight decline, though they differ regarding the timing of the decline (note also the high absolute level of agreement across time, ranging from 58 to 77 percent). The peak of concern is either in 1992 or 1996, followed in order by 2000 and 1987.
Public opinion: Income differences in America are too large
Note: For data definitions, see appendix table A1.

The GSS and ISSP include two other items that help to tap Americans' attitudes regarding income inequality: “Large differences in income are unnecessary for America's prosperity” and “Inequality continues to exist because it benefits the rich and powerful.”Footnote 14 Both show even stronger trends toward increasingly intense dissatisfaction with inequality in the mid-1990s, with strong agreement and total agreement both peaking in 1996 and then returning to near 1987 levels in 2000. During the high point of intense opposition in 1996, more than half of Americans strongly agreed or agreed to each of the three questions (from 58 percent to 67 percent, as compared to a range of 38 to 58 percent in 1987). The magnitude of these shifts is unusually large when compared to many other public opinion shifts.Footnote 15
We have combined responses to the three questions into a single index to facilitate the main purpose of our analysis, which is to determine whether this shift in concern about inequality affected policy preferences.Footnote 16 To confirm that the trend for this index is robust to changes over time in compositional shifts in the population, figure 4 shows the full distribution of the “attitudes about inequality index” adjusted for a variety of sociodemographic factors and political attitudes. The full set of variables used to control for compositional shifts over time are described in appendix table A2; they include age, gender, race, region of the country, size of place, employment status, marital status, household size, presence of children, years of education, family income, subjective class position, subjective chances for upward mobility, political ideology, and political party identification. The predicted values of the index adjusted for these factors suggest once again that dissatisfaction with inequality increased significantly between the late 1980s and the early-to-mid-1990s. It then declined in 2000 but remained higher than in 1987.

Based on these trends, we use three criteria in assessing whether rising concerns about income inequality had an impact on social policy preferences over the same time period. First, consistent with trends in concerns about inequality, support for the particular social policy (e.g., spending on welfare, redistribution from rich to poor) should have increased in the 1990s relative to 1987. Second, attitudes about income inequality, as measured by the index, ought to have a positive effect on support for the social policy. Third, the shift in attitudes toward inequality—either in terms of the growing number of dissatisfied individuals (a compositional shift) or a change in their policy preferences (a behavioral shift)—should account for some of the trend toward increasing support among the general public for the social policy in the 1990s.Footnote 17
We have two additional expectations regarding these analyses. First, all of these patterns we expect to occur net of the sociodemographic and political controls mentioned above. That is, given the shift in mass public opinion that we observe in attitudes toward inequality, our objective is to gauge shifts in mass public opinion in policy preferences. Although there is growing interest in the extent to which public opinion is shaped by economic status or political ideology, our contribution is to introduce variation in policy preferences across attitudes toward inequality, controlling for other factors that are more commonly singled out for subgroup analysis.Footnote 18 We leave further extensions of this kind to future research.
Second, based on the greater spread and intensity of opposition to inequality in 1992 and 1996 than in 2000 and the divergence of trends in income inequality in the late 1990s, we have higher expectations for a policy preference response to rising inequality in 1992 and 1996 than in 2000. We also explored the role of a number of potentially confounding factors—including the recession of the early 1990s, the boom of the late 1990s, the anti-welfare reform campaign of the mid-1990s, three presidential elections, and the actual trend in income inequality—and we concluded that the ground was most fertile in 1992 and 1996. Thus given the replication of all but one of the policy preference questions in both 1987 and 1996, the 1987-to-1996 shift will be the most critical yardstick for assessing the public's policy orientation in addressing excessively high levels of income inequality. The 1987-to-1992 and 1987-to-2000 shifts will provide additional leverage.
Increase in Desire for Government Redistribution?
With inequality on the rise, and concerns about inequality on the rise, we might expect support for redistribution to have increased among Americans. A long line of research considers egalitarianism to be “the value dimension that is most relevant to policy debates over social welfare.”Footnote 19 Individuals with egalitarian sentiments are more likely to support government intervention in redistributive matters,Footnote 20 and it is frequently implied that support for social welfare programs is itself an indicator of the degree or depth of egalitarian sentiment in a society.Footnote 21 In addition, median-voter models predict this type of response.Footnote 22 A higher level of market inequality implies a greater distance between mean and median (pretransfer-pretax) income, with the latter further below the former. The lower the median relative to the mean, the more the median income person or household is likely to benefit from government redistribution, in the sense that the transfers she receives will exceed her share of the tax burden. Hence the greater the amount of redistribution she will favor. This hypothesis implies that increases in egalitarian sentiments should result in increases in support for redistributive policies. Yet we know of no research that has analyzed these relationships over time.
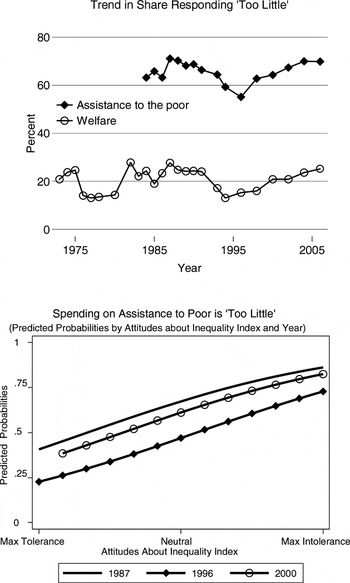
The two main redistributive policies that we examine involve direct transfers of income that reduce posttransfer-posttax inequality: transfers to the poor and taxation of the rich. Figures 5 and 6 show trends in public opinion toward these two redistributive strategies using data from the GSS/ISSP and the Gallup Poll. We begin with preferences regarding transfers to the poor, the type of program that is perhaps most widely associated with the U.S. welfare state. The GSS has regularly asked whether government assistance to the poor and spending on welfare are too little, about right, or too much. Trends in the share responding too little are shown in the first chart in figure 5. Here there is no indication of an increase in support for redistribution during the period of rising inequality. The over-time correlation between the Census Bureau's Gini coefficient in figure 2 and the question about welfare is just 0.02. A similar trend (not shown here) is evident in responses to a question asked by the Pew Research Center since 1987: “The government should help more needy people even if it means going deeper in debt.”Footnote 23 A more extensive analysis of over time trends in support for welfare policies also shows no increase in support over the course of several decades.Footnote 24
Public opinion: Government assistance to the poor and government spending on welfare
Note: Probabilities are calculated from appendix table A3, panel I.D, Model 3 for the question on whether to spend more on assistance to the poor with all control variables held constant at their cross-year mean. Outcome categories include too little” spending, “about right” spending, and “too much” spending. Only probabilities for the “too little” spending category are shown here. The effect of the inequality index is not significantly different across years (i.e., the year-by-inequality index terms are not significant).

Public opinion: Taxes for those with high incomes
Note: Probabilities are calculated from the same model as in appendix table A3, panel II.A, Model 4 for the question on taxes on high incomes, except that the outcomes were collapsed from five to three to be consistent with other figures. Outcome categories include “much too low”/“too low”, “about right”, and “too high”/“much too high”. Only probabilities for the combined “much too low” and “too low” categories are shown here. All control variables are held constant at their cross-year mean. The effect of the inequality index is significantly lower in 1996 at p < .10 and higher in 1992 at p < .05.

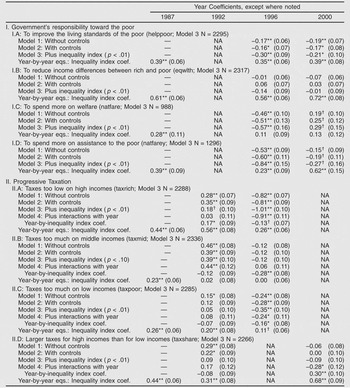
The second chart in figure 5 explores the relationship between dissatisfaction with inequality and transfers to the poor. Since it is well known that Americans are peculiarly hostile to welfare,Footnote 25 we focus on the question that asks about assistance to the poor and does not mention welfare. In the chart, the “attitudes about inequality” index is on the horizontal axis, and the lines in the chart represent predicted probabilities that a person at a particular point on the attitudes about inequality index will respond that spending on assistance to the poor is too little, controlling for the various sociodemographic and political attitudinal factors noted earlier (see appendix table A2). There is one line for each of the three years for which GSS/ISSP data are available for questions on both attitudes toward inequality and assistance to the poor: 1987, 1996, and 2000. The positively sloped lines indicate that those who are dissatisfied with the level of inequality are more likely to say that government assistance is too low (p < .01 in all years),Footnote 26 but at all points along the index, this likelihood was lower in 1996 and 2000 than in 1987. We therefore see no evidence that the population at large became more likely to support transfers to the poor, or that those most concerned about inequality increased their support for these policies. We observe this same pattern for other questions about helping the poor and redistributing income from the rich to the poor (see appendix table A3, panel I for further details).Footnote 27
Patterns of support for progressive taxation fluctuate over the 1990s, and therefore our conclusions, are more mixed. Our evaluation is based on questions that ask whether taxes are too low for high income groups and whether taxes should be larger on high income groups than on low income groups. (We also see similar patterns in questions that ask about whether taxes are too high for middle and low income groups; see appendix table A3, panel 2.) The data begin only in the late 1980s and are available for a limited number of years, but even so, they suggest no sustained rise in support over time for heavier taxes on the well-to-do (the correlation with the Gini coefficient is negative). As shown in the first chart of figure 6, support is heightened in 1992 but then plummets later in the decade, including in 1996, one of the peaks of dissatisfaction with inequality.
The second chart in figure 6 explores the relationship over time between dissatisfaction with inequality and attitudes toward heavier taxation on high incomes. In each year people less tolerant of inequality were more likely to favor higher taxes on the well-to-do, as indicated by the positive slope of the lines (p < .01 in each year). However, both the slope and the level of the line are lower in 1996 than in 1987 or 1992. This suggests a significant reduction in the degree to which those dissatisfied with inequality were inclined to favor stiffer taxation of the affluent as a policy response (p < .10 for the interaction term), as well as a more general decline in support for taxing high incomes among all Americans in 1996. On the other hand, the reverse is true for 1992 (p < .05 for the interaction term), a year when dissatisfaction with inequality was also high. The increasing share of individuals concerned about inequality, coupled with their increasing likelihood to support higher taxation on high incomes, accounts for some of the higher level of support among the general public in 1992.
There is an additional question on progressive taxation that offers some corroborating evidence for these patterns. The question asks whether taxes on high incomes should be larger than on low incomes. Responses to this question show the same pattern of increased support in 1992. This question was not asked in 1996, so we cannot confirm the results for that year. In 2000, overall public support was neither greater nor lesser, but support increased among those concerned about income inequality (p < .01 for the interaction term). Although not consistent across years, these data do indicate that concerns about inequality can be expressed as demands for higher progressive taxation to such an extent that they shift population-level preferences in a significantly positive direction. However, as Larry Bartels shows in his analysis of the 2002 tax cuts, this may not necessarily result in support for a particular tax policy.Footnote 28
No Change in Desire for Government Action?
If Americans have noticed the rise in inequality and are concerned about it but do not unequivocally favor expansion of traditional redistributive measures, perhaps they are unsure of whether government should or can do anything in response to the rise. This would be consistent with a well-known countertendency to the egalitarian/or pragmatic strain in American culture that we examined in the previous section, as well as the self-interested behavior predicted by the median-voter model. This countertendency involves both a preference for limited government and an expectation that individuals will be responsible for supporting themselves and their families. Americans look to the market system rather than to the government to deliver opportunity for upward mobility, and they believe that inequality plays a crucial role in rewarding (handsomely but appropriately) private contributions to the public good of economic growth and prosperity. This perspective goes by many names—the American Dream, economic individualism, meritocracy, liberalism—and has been found to be more deeply held than the norm of egalitarianism.Footnote 29
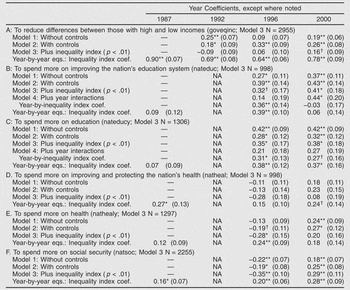
We test this hypothesis about support for government intervention with a simply-worded question about government's responsibility to “reduce differences in income between people with high incomes and those with low incomes.” This question does not mention taxation, welfare, or the poor (as does a similarly worded question that we examined in the previous section) and therefore avoids associations with these traditional redistributive policies. Given such a low bar, this question should provide a sense of whether Americans support any redistributive role for government at all. The first chart in figure 7 shows over-time trends in the share of GSS/ISSP respondents strongly agreeing and/or agreeing with the statement for all four years. Consistent with the trends in inequality and in dissatisfaction with inequality, the shares increase over time. When we control for compositional shifts in the population, we find this increase to be statistically significant (see appendix table A4, panel A).
Public opinion: It is the responsibility of government to reduce differences in income between people with high incomes and those with low incomes
Note: Probabilities are calculated from appendix table A4, panel A, Model 3 for the question on whether to redistribute income between high and low income groups with all control variables held constant at their cross-year mean. Outcome categories include five categories from “strong agreement” to “strong disagreement”. In this graph, strong agreement and agreement are combined. Only probabilities for total agreement are shown here. The effect of the inequality index is not significantly different across years (i.e., the year-by-inequality index term is not significant). This graph does not indicate differences across years in the mean value of the inequality index. When mean changes are taken into consideration (and all other variables are held constant at their means), the predicted probability of agreeing to this question is highest in 1996 (.335), followed by 2000 (.311), 1992 (.282), and 1987 (.236).

As shown in the second chart in figure 7, this increase over time is virtually eliminated once we add the index of attitudes about inequality to the equation (i.e., the curves are overlapping). This means that increasing support for redistribution between income groups among the general public is accounted for by the increase in individuals who are dissatisfied with levels of inequality, since these individuals are more likely to support a government hand in reducing disparities (p < .01 in all years). The second chart in figure 7 also shows the strong relationship between attitudes about inequality and preference for government action to reduce income differences. In all four years those opposed to high inequality are much more likely to believe it is government's responsibility to reduce such differences. The over-time pattern in the first chart in figure 7 is thus largely a function of changes in concern about inequality.
According to these results, all three criteria for establishing a relationship between growing concerns about inequality and social policy preferences have been met: support for inequality reduction between income groups increased over time, those who were concerned about inequality were more likely to support inequality reduction, and the increase in concerns about inequality accounts for the over-time trend. Thus rising inequality did appear to produce an increase in desire for some kind of government response to reduce income differences. In subsequent sections we examine whether increasing inequality and dissatisfaction with inequality may have prompted changes in preferences for specific kinds of government action other than direct transfers of income from rich to poor.
Increase in Desire to Reduce Inequality of Opportunity?
Although Americans tend to be ideologically conservative, in the sense that at a general level they prefer solutions that do not involve government, they also tend to be operationally liberal. If particular programs seem likely to work, Americans are happy to endorse increased spending on them.Footnote 30 One such program is education. Education has an ambiguous status in the menu of policy tools aimed at reducing income inequality, however. On the one hand, historically education has been viewed as a key social leveler, and it occupied a central place in Lyndon Johnson's Great Society programs.Footnote 31 Education is commonly thought to help equalize opportunity, and Americans strongly endorse equality of opportunity. For instance, polls conducted by the Pew Research Center since the mid-1980s have consistently found more than 90 percent agreeing that “our society should do what is necessary to make sure that everyone has an equal opportunity to succeed.”Footnote 32
On the other hand, since the “Coleman Report” released in the mid-1960s, many scholars and policy makers have been skeptical about the capacity of schools and school reform to make much of a difference in the life chances of children from disadvantaged families and neighborhoods.Footnote 33 And scholars of the welfare state virtually never include education as a component of social policy or redistributive effort.Footnote 34 As Harold Wilensky put it in 1975:
A nation's health and welfare effort is clearly and directly a contribution to absolute equality, the reduction of differences between rich and poor, young and old, minority groups and majorities; it is only a secondary contribution to equality of opportunity. In contrast, a nation's educational effort, especially at the higher levels, is chiefly a contribution to equality of opportunity—enhanced mobility for those judged to be potentially able or skilled; it is only a peripheral contribution to absolute equality.Footnote 35
Education enhances meritocracy, but meritocracy produces inequalities in outcomes.
During the era of rising inequality, however, inequality of opportunity and inequality of outcomes may be more closely intertwined than we are accustomed to thinking. Working backward from the idea that Americans “accept economic inequalities only when they are sure that everyone has an equal chance to get ahead,”Footnote 36 it may be that concerns about income inequality arose in the 1990s because of growing concerns about opportunity for upward mobility.Footnote 37 More specifically, when Americans observe rising inequality of outcomes, they may infer from this that opportunity is excessively unequal. As a consequence, they may simultaneously express heightened dissatisfaction with inequality of outcomes and favor government action to expand economic opportunity. Moreover, analyses of growing U.S. earnings and income inequality often stress education as a key axis of division; since the late 1970s those with a four-year college degree or better have experienced rising real earnings, while those with less schooling have faced stagnation or decline. Americans seem to be aware of this “college divide.”Footnote 38 Based on focus groups conducted in the mid-1990s (at the same time as we observe a peak in dissatisfaction with inequality), Stanley Greenberg argued that “it is hard to overestimate how important education and skills training are to these noncollege voters—perhaps the most important strategy for people to gain an advantage in this stagnant economy.”Footnote 39
The first chart in figure 8 shows over-time developments in public opinion about government expenditures on education. There are two relevant GSS questions. One asks about spending on “improving the nation's education system” and the other about spending on “education.” The trends for the two are similar. They indicate a sharp increase in support for greater spending from the late 1970s through the end of the 1980s, followed by a smaller increase in the 1990s. This trend in preferences for government action on schooling correlates very closely (r = 0.90) with the trend in income inequality shown in figure 2. This is consistent with the hypothesis that rising inequality has prompted growing support for measures to address unequal opportunity.
Public opinion: Government spending on education
Note: Probabilities are calculated from appendix table A4, panel B, Model 4 for the question on whether to spend more on improving the nation's education system with all control variables held constant at their cross-year mean. Outcome categories include “too little” spending, “about right” spending, and “too much” spending. Only probabilities for the “too little” spending category are shown here. The effect of the inequality index is significantly greater in 1996 at p = .014.

In some respects the second chart in figure 8 supports this interpretation, while in other respects it suggests reason to be more cautious. The chart shows predicted probabilities of support for increased spending on education at various levels of dissatisfaction with inequality, once again controlling for sociodemographic and political attitudinal factors. We are able to do this for three years: 1987, 1996, and 2000. In 1987 and again in 2000 there is no association between attitudes toward inequality and desire for more education spending; the lines are flat (though levels are significantly higher among the public at large in 2000 than in 1987, as shown in appendix table A4, panels B and C). Only in 1996 do we observe a positive slope indicating that those more dissatisfied with inequality are more likely to favor increased government spending on “improving the nation's education system.”Footnote 40 But this shift in preferences among those concerned about inequality is influential: it accounts for the lion's share of increased support for education spending among the general public in 1996. Moreover, the second question on education spending shows some evidence that this pattern continued into 2000 (when we graph this version of the question, the curve for 2000 overlaps the curve for 1996 almost exactly).
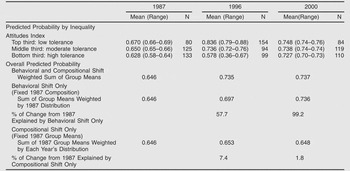
Table 1 uses the results from figure 8 to illustrate this relationship between growing concern about inequality and support for education spending. It presents the average predicted probability of supporting increased spending on education if the respondent scores in the top third of the inequality attitudes index (expressing the lowest tolerance for inequality), middle third (moderate tolerance), or bottom third (highest tolerance). In 1987, roughly two-thirds of each group supported increased spending, exhibiting little differentiation across the spectrum of views about inequality. But in 1996, support for increased spending on education grew by 17 percentage points among those most concerned about inequality and 9 percentage points among those with moderate concern, whereas it fell by 5 percentage points among those with the least concern. This polarization in views gave way to consensus once again in 2000, when support for increased spending was 8 to 10 percentage points higher for all three groups than in 1987. Little of this change over time was due simply to compositional shifts; rather it was a function of uneven changes in policy preferences groups in 1996 and uniform changes in 2000.
Education spending “too little” by inequality attitudes index, predicted probabilities from ordered logistic regression model

Source: The General Social Survey for 1987, 1996, and 2000, and the International Social Survey Program for 1992.
Notes: Predicted probabilities are calculated from appendix table A4, panel B, Model 4. This is the same model shown in figure 8. All control variables are held constant at their cross-year means while year and the inequality attitudes index varies. Distribution of inequality attitudes index is broken into thirds based on cross-year distribution of values. The index is coded from −3.0 to +3.0, from high tolerance to low tolerance, based on a sum of the individual items, which are coded −1.0 (strongly disagree), −0.5, 0.0, +0.5, +1.0 (strongly agree). The top third includes values from 1.5 to 3.0; the middle third includes values from 0.5 to 1.0; the bottom third includes values from −3.0 to 0.0. N refers to the number of observations in the analysis.
According to these results, all three criteria have been met for 1996 and, with less certainty, for 2000: support for education spending increased over time, those who were concerned about inequality became more likely to support educational spending over time, and this shift accounts for much of the general trend. It may be, however, that the hypothesized causal path of rising inequality → heightened dissatisfaction with inequality → heightened desire for government action to equalize opportunity was either temporary (applying only to the mid-1990s) or simply more redolent during the mid-1990s than in later years. Unfortunately, in the absence of further information on the differences in results in 2000 from the two different education questions, we cannot draw firm conclusions about these longer-term trends.
Increase in Desire for Other Government Programs?
An important component of the rise in earnings and income inequality over the past two decades has consisted of those at the very top of the distribution pulling away from everyone else.Footnote 41 If Americans view this as the defining characteristic of inequality, they may favor an increase in government transfers on programs that tend to benefit not only the poor but also the middle class. Alternatively, or in addition, Americans may have seen their real earnings and compensation fall, stagnate, or grow at a slow pace and view this as the defining characteristic of the age of rising inequality. This too could lead to a desire for government to provide a wide range of services that assist low-income and middle-income Americans alike.Footnote 42 We therefore consider whether the rise in support for education spending actually reflects a more general increase in support for broad-based government assistance of many kinds.
The most visible of such programs are social insurance programs such as social security (old-age pensions), health insurance, and unemployment compensation. Heightened spending on these programs also might be favored because recipients are viewed as more deserving, since they must pay into the system while working. (Unemployment insurance contributions are paid by employers, but it is widely assumed that this indirectly taxes employees in the sense that their wages would otherwise be higher.) On the other hand, we should note that, according to Karl Ove Moene and Michael Wallerstein, median-voter logic could predict that an increase in inequality will reduce support for social insurance spending.Footnote 43 Citizens are likely to conceive of public pensions and unemployment insurance as government pooling of risk rather than redistribution from rich to poor, and as programs for which they themselves have a nontrivial likelihood of becoming a beneficiary. The demand for insurance rises with income: those with more income tend to be willing to pay more to safeguard their living standards in the event of job loss, illness, old age, and so on. Hence, the higher the level of inequality, and therefore the lower the earnings or income of the median voter, the less the median voter will favor expenditures on these types of programs.
We first consider health care. The first chart in figure 9 shows trends in public support for more government spending on “health” as measured by two questions in the GSS/ISSP. The over-time trend is up, yet the timing does not correlate particularly well with the trend in inequality in parts of the 1980s and 1990s (though the long-term correlation with the Gini coefficient is 0.73). Support for heightened government spending on health jumped sharply in the late 1980s and increased steadily in the early 2000s, but for much of the 1980s and the 1990s it was flat.
Public opinion: Government spending on health
Note: Probabilities are calculated from appendix table A4, panel E, Model 3 for the question on whether to spend more on health with all control variables held constant at their cross-year mean. Outcome categories include “too little” spending, “about right” spending, and “too much” spending. Only probabilities for the “too little” spending category are shown here. The effect of the inequality index is not significantly different across years (i.e., the year-by-inequality index terms are not significant).

In the second chart of figure 9, we assess the relationship between dissatisfaction with inequality and support for a larger dose of spending on health. In each of the three years the lines are positively sloped, indicating a greater likelihood of support for more government expenditures among those who are dissatisfied with the existing level of inequality (p < .01). The increase in the share of individuals who are concerned about inequality and prefer more spending on health also accounts for some of the trend over time in support for more spending on health.Footnote 44 However, these relationships are weak and inconsistent across the two questions. Moreover, there is a slightly lower level of support for spending on health across the board in 1996 (but not in 2000). As the first chart in figure 9 indicates, that year marked the low point in a slight dip that occurred in the early and mid-1990s. While suggestive, these data do not allow us to conclude that heightened concern about inequality in the mid-1990s led to greater demands for government to alleviate the costs of health care.
The GSS/ISSP does not have a question on attitudes about unemployment insurance, but since 1984 it has asked whether government expenditures on social security are too little, about right, or too much. The first chart in figure 10 shows the share responding “too little”. The trend does not match particularly well with that of inequality, at least at some points. Most noticeably, the share saying too little fell in the late 1980s and early 1990s before rising in the mid-1990s. By 2000 the share was no higher than it had been in 1987. The year-by-year correlation with the Gini coefficient is positive but not strong: r = 0.32. The second chart shows that those more concerned about inequality were more likely to favor more government spending on social security in each year (p < .01). Yet at all levels of dissatisfaction with inequality, this view was less common in 1996 than in 1987 and 2000. While support for greater spending on health and social security is generally very high (from half to three-quarters of Americans, as shown in appendix table A1, panel IV), it does not appear that Americans were looking for assistance of this kind—and thus for government services more generally (beyond education)—as a remedy for their growing dissatisfaction with the level of inequality in American society in the 1990s.Footnote 45
Public opinion: Government spending on social security
Note: Probabilities are calculated from appendix table A4, panel F, Model 3 for the question on whether to spend more on social security with all control variables held constant at their cross-year mean. Outcome categories include “too little” spending, “about right” spending, and “too much” spending. Only probabilities for the “too little” spending category are shown here. The effect of the inequality index is not significantly different across years (i.e., the year-by-inequality index terms are not significant).

Increase in Desire for Regulation of Employer Pay Practices?
Rather than action that involves higher taxes or greater government spending, Americans may want government to respond to rising inequality by changing what it mandates of private employers or by intervening in the private economy in other ways that they think will ultimately reduce market inequality. There may, for example, be increased support for raising the statutory minimum wage, protecting wage bargaining agreements and institutions, or restricting the pay of those at the top of the distribution. Research has found that the decline in the real value of the minimum wage and the fall in union membership have contributed to reductions in real wages in the bottom and middle of the distribution.Footnote 46 At the same time, soaring executive pay has increased earnings at the top.Footnote 47 Moreover, during the time frame of our study, we find periods of heightened media scrutiny of executive pay, particularly during the recession and slow recovery of the early and mid-1990s.Footnote 48 As earlier studies of inequality have noted, then, Americans may favor regulation rather than redistribution in rectifying earnings disparities that are viewed as unfair.Footnote 49
The GSS/ISSP does not have questions that can be used to carefully assess the impact of rising concern about inequality on public attitudes toward regulation of employer pay practices. Regarding the minimum wage, Gallup has asked a semi-regular question since the late 1980s on whether Congress and the president should raise the minimum wage. The choices are favor or oppose, and figure 11 shows the trend over time. The share supporting a higher minimum wage increased between the late 1980s and the mid-to-late 1990s. The amount of the increase was small, but the level of support was already so high in the late 1980s, at around 78 percent, that a ceiling effect may have constrained the degree of increase. Americans also tend to think that corporate chief executive officers (CEOs) are overpaid,Footnote 50 but to our knowledge there are no over-time data on attitudes about policies that would restrict maximum compensation levels for CEOs or others at the high end of the earnings distribution. Similarly, while Americans are more supportive of worker associations than many would think,Footnote 51 we do not have over-time data on whether this support has shifted during the period of rising inequality. The very limited data that is available on these topics suggests that the degree to which unskilled and skilled workers were considered underpaid grew in the 1990s but the degree to which CEOs were considered overpaid did not.Footnote 52
Public opinion: Should the minimum wage be increased?

In terms of other kinds of interventions in the private economy, much attention has focused on immigration and international trade. There is a large volume of research on this subject by economists showing that increasing immigration and international trade have reduced the relative wages of unskilled workers, but these factors are generally agreed to have “not been the major force driving wage [inequality] movements.”Footnote 53 Kenneth Scheve and Matthew Slaughter have examined public opinion on these matters in detail. They find that “though people acknowledge benefits, both economic and otherwise, they appear to worry more about costs—especially labor market costs—such that they opt for policies of less immigration [and less trade].”Footnote 54 Low-skilled workers are especially opposed to immigration and trade, implying that they are aware of their unique exposure to the costs of economic integration in lost jobs and lower wages. Scheve and Slaughter suggest that this should lead to greater support for social insurance and redistributive spending (though they do not analyze this issue). We do not find such an increase over the time period of our study among the general public, but there may have been one among individuals concerned about immigration and trade (these questions are not available over time in the GSS/ISSP). Based on our findings, we find it more plausible that concerned Americans would support targeted protections for dislocated workers (e.g., retraining grants) rather than traditional social insurance and redistribution.Footnote 55
Increase in Desire for Not-Sure-What?
A final possibility worth considering is that Americans have grown increasingly dissatisfied with the level of inequality and would like government to do something about it, but they are not sure what type of action they favor. In this view there is limited desire for traditional redistributive methods as the response, but preferences for other options that may alleviate this new set of concerns are not yet well developed. Analyses of public opinion have accumulated considerable evidence that, aside from a minority of individuals who are politically knowledgeable and consistent in their ideological views, Americans' policy preferences tend to be weakly formed and based on limited information and misconstrued interests.Footnote 56 This may be especially true for those who are most likely to benefit from redistributive policies—less educated and lower income Americans.Footnote 57
On the other side of the ledger from the mass public, the larger political culture—politicians, parties, the media, social organizations, and so on—has not helped matters. It has failed to transmit a coherent, consistent, or highly visible message about rising income inequality and what should be done about it. A thorough discourse analysis is beyond the scope of this article, but our hypothesis is that to the extent that income inequality has been politicized, the populist solutions put forward have been defined in primarily two ways: first, as the need for higher education and technical skills to compete successfully in the new “knowledge” economy, and second, as the need for greater protections from foreign competition, in the form of trade barriers and curbs on immigration, as we discussed above.Footnote 58 This represents a relatively narrow rendering of the solutions that could potentially come into play in reducing inequality, crowding out other possibilities that might enjoy some measure of popular support. Progressive taxation, for example, is a contentious subject not because the majority of Americans oppose it, but because it tends to be upstaged by anti-government rhetoric against higher taxes tout court, for which there is sympathy.Footnote 59 Thus, the menu of policy options available to the public is both highly circumscribed and underdeveloped, which fosters inconsistencies in policy preferences.Footnote 60
As a consequence of this vacuum in political culture, the responses we have catalogued could reflect localized reactions to current events, a tendency that can be more pronounced among the large share of Americans with weak ideological leanings and little information.Footnote 61 This interpretation is consistent with the dip in support for more government spending on health that coincided with controversies over health care reform in the mid-1990s. It could also help account for patterns of support for government assistance to the poor and spending on welfare, which also declined in the mid-1990s. Arguably, this development was heavily influenced by the aggressive and highly visible campaign by Republicans prior to and after their success in the 1994 congressional elections to prioritize welfare reform and hold President Clinton to his 1992 campaign pledge to “end welfare as we know it.”Footnote 62 Finally, anti-tax rhetoric appears to have risen over the course of the 1990s, which coincides with the decline in support for high taxes on the rich that we observe in 1996.Footnote 63
That the intensity of dissatisfaction with income inequality peaked at this same time—when anti-welfare, anti-tax, and anti-government rhetoric of all kinds (e.g., on health care and social security) was reaching a crescendo—reassures us not only that concerns about inequality are real, but that they are (or at least can be) distinct from preferences for a core group of social welfare policies traditionally associated with egalitarian, humanitarian, and pragmatic norms, or with self interest. We are less sure whether the strong but temporary support in 1996 for more education spending among those dissatisfied with inequality, which may have carried into 2000, is a genuinely new, if inchoate, response to concerns about income inequality. This could reflect a historically novel coupling of inequality of outcomes (the problem) with equality of opportunities (the solution). Alternatively, it could reflect the policy preferences of visible and vocal elites at that time for solutions emphasizing individual initiative and educational achievement. These elite preferences may have trickled down to the general public—or the general public may have been more receptive to them—at a time of heightened anxiety over rising inequality during the mid-1990s. Which of these two explanations is the more accurate one is a critical question for future researchers to examine.
Conclusion
Rising inequality is a signature characteristic of the past generation.Footnote 64 What effect, if any, this has had on Americans' policy preferences is a key question for scholars and policy makers. Data limitations have impeded our understanding of this question, but to push forward, we have taken advantage of a unique combination of data on attitudes toward income inequality and social policy preferences at multiple time points during the recent era of rising inequality. We have identified a wide range of conventional and unconventional perspectives on American views of inequality and tested as many as possible with the available data. We draw two conclusions from our analysis and then discuss two potential implications of our findings for future research on the politics of rising income inequality.
Our two conclusions address the two views that currently dominate thinking about responses to rising inequality. The first view is that rising income inequality is likely to have no impact at all because Americans are tolerant of income inequality in general and of rising income inequality in particular. In our examination of questions that ask directly about income inequality, we found that Americans did become increasingly concerned about income disparities over the 1990s, with a peak in concern occurring during the early and mid-1990s. Our time series ends in 2000, but based on data collected in the 2002 ANES, Bartels also finds evidence of opposition to rising inequality (41 percent said that “differences in income between rich people and poor people” were larger than 20 years ago and that this was a “bad thing”).Footnote 65 Although we cannot compare these ANES responses to any other year, the message from both studies taken together is clear: There is a high degree of dissatisfaction with inequality at any given point in time, and this dissatisfaction can fluctuate significantly over time. Our understanding of this process in the future will depend crucially on the availability of more and better time-series data on views specifically about income inequality.
The second view that dominates thinking about responses to rising inequality is that it is likely to produce an increase in support for traditional redistributive policies that transfer income from the rich to the poor, making the posttransfer-posttax income distribution more equal. While we find that Americans have become increasingly concerned about inequality, and that their support for government action to address it has risen, the action they have tended to favor is not traditional redistributive programs. For a variety of reasons explored by other scholars, dissatisfaction with assistance to the poor and with higher taxes on the rich was especially strong in the mid-1990s (less so in the early 1990s). Increasing concerns about income inequality had little impact relative to the strength of anti-welfare and anti-tax sentiments. While those who are concerned about income inequality are more likely to support progressive taxation and assistance to the poor at any given point in time—something we think important to keep in mind with respect to progressive taxation in particular, which has received limited scholarly attention—this is not a formula that seems to have had strong political traction in the era of rising inequality that we study.Footnote 66
If the GSS/ISSP data suggest that neither of the dominant views is correct for the contemporary United States, what do they suggest as an alternative? We see two possibilities that ought to be pursued in future research. The first is that rising income inequality has prompted greater concern about inequality of opportunity, which in turn has prompted greater demand for increased spending on education. In contrast to the widespread anti-spending sentiment we observed in the mid-1990s, Americans who were concerned about inequality became more likely to support education spending. This increased likelihood accounted for most of the increasing support among Americans in general for spending on education (in 1996 for both questions on education and in 2000 for one of the questions). This shift is all the more notable given the lack of any connection between views on income inequality and education spending in 1987, our baseline year, a pattern that is consistent with the longstanding absence of education in political models of social welfare spending. Furthermore, we observe similar increases in support for spending on education in the mid-1990s in the ANES (in contrast to spending on child care, social security, and health), and a strong correlation between the trend in actual inequality and support for education spending over the longer term. These shifts suggest the need for new research that bridges the study of inequality of opportunity and inequality of outcomes, both in terms of how Americans perceive the connection between the two and in terms of how policies that are meant to expand opportunities—in education as well as potentially in the labor market—operate to foster or mitigate actual inequalities.
The second possibility raised by our findings is that Americans favor some sort of government action but are uncertain about exactly what that action should be (as opposed to what it should not be). One reason for this uncertainty may be that the issues involved are complicated: even many scholars and policy makers are uncertain as to how to best address the increase in income inequality. Indeed, researchers are sharply divided about the causes of this development. As a relatively new “social problem,” then, and one that receives only episodic media and political attention, it is not surprising that both attitudes toward inequality and corresponding policy preferences would be weakly developed and sensitive to contemporaneous debates, including those that may have emphasized education instead of traditional redistributive policies as a cure. This possibility is all the more likely given the ambivalence and uncertainty that characterizes public attitudes about inequality and a wide array of other political issues.
Having said this, however, we do not think our findings imply that the complexities are insurmountable, leaving no room whatsoever for Americans to make rational connections between income inequality and the social policies that might address it. In fact, at any given point in time, dissatisfaction with inequality is almost uniformly associated with significantly greater support for all of the equalizing social policies that we examined, after controlling for sociodemographic characteristics and political partisanship and ideology. And while broad-based support for a wide array of spending programs was down in 1996 (except for education), it was up in 2000 for government services that were not targeted to the poor—education, health, and social security. If our surveys contained questions about other kinds of policies that would make a dent in market inequality, such as government regulation of employer pay practices (e.g., via the minimum wage or limits on executive pay) or trade (e.g., to keep “good” jobs in America), we might have found additional avenues of redress favored by Americans. But until the collection of data on opinion about policies related to inequality catches up with the reality of inequality, we will not know. The highest priority for future research, then, is to take American public opinion about inequality seriously enough to find out exactly what it is.
We conclude with a few general principles, rather than detailed suggestions, to guide the collection of new data. Our analysis suggests a need to analytically and empirically divorce the study of public opinion on inequality from that of poverty and poverty-reducing social programs. This is not to say that there is no relationship between views of inequality and poverty, or that public opinion research on inequality should assume a higher priority than public opinion research on poverty. It is only to say that the relationship between inequality and poverty needs to be understood as a social phenomenon in need of empirical examination in its own right (again, as a public opinion issue). We should fashion surveys and studies that are as in-depth as the now classic studies of income inequality in the 1970s and 1980s—by Kluegal and Smith (Reference Kluegal and Smith1986), Hochschild (Reference Hochschild1981), Verba and Orren (Reference Verba and Orren1985), and McCloskey and Zaller (Reference McCloskey and Zaller1984)—and that also take into account new economic (e.g., rising pay at the top and falling minimum wages), demographic (e.g., rising immigration), and political (e.g., declining faith in government action) conditions. Finally, given the complexity of the issue, replication of questions and experimentation with question wording is imperative. Only then can we fully test the validity and durability of the new patterns we have described here.
Appendix
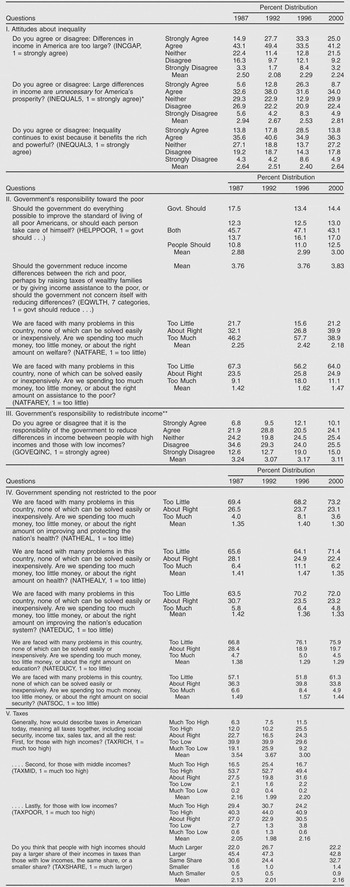
Table A1: Questions in the GSS/ISSP on inequality and support for redistributive policies and government spending

Source: The General Social Survey for 1987, 1996, and 2000, and the International Social Survey Program for 1992.
* The original wording was “are large differences in income necessary for America's prosperity” so that strong agreement was an expression of tolerance of inequality.
** Since this question was not asked in 1996, a similarly worded question was substituted for the missing value in this year. The question is: What is your opinion of the following statement? It is the responsibility of the government to reduce differences in income between people with high incomes and those with low incomes. (EQINCOME, 5 categories, 1 = strongly agree)
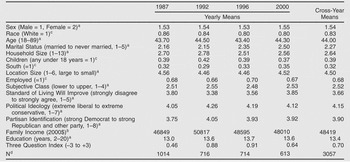
Table A2: Descriptive statistics for three question index and all control variables

Source: The General Social Survey for 1987, 1996, and 2000, and the International Social Survey Program for 1992.
Notes: aOriginal values. bValues converted to midpoint of category. cCoded as dummy variables for analysis. dObservations included in the pooled cross-year regression with the three question index as the outcome. In-sample means will vary slightly depending on policy outcome variables.
Table A3: Trends in support for transfers to poor and progressive taxation, ordered logistic regression coefficients

Source: The General Social Survey for 1987, 1996, and 2000, and the International Social Survey Program for 1992.
Notes: All outcomes are coded so that a positive effect indicates greater support for redistributive programs and social policies. Models 1, 2, 3, and 4 are pooled regressions (across years). Models 2, 3, and 4 include the following variables: gender, race, region, employment status, children, size of place, marital status, age, household size, education, family income, subjective class location, subjective chances for mobility, political ideology, and political party identification. Model 3 provides the probability level of the inequality index coefficient in parentheses. Interactions of inequality index and year are only included when significant. Probability levels are indicated by **, p ≦ .01; *, p ≦ .05; †, p ≦ .10.
Table A4: Trends in support for social policies not targeted to the poor or rich, ordered logistic regression coefficients

Source: The General Social Survey for 1987, 1996, and 2000, and the International Social Survey Program for 1992.
Notes: All outcomes are coded so that a positive effect indicates greater support for redistributive programs and social policies. Models 1, 2, 3, and 4 are pooled regressions (across years). Models 2, 3, and 4 include the following variables: gender, race, region, employment status, and children, size of place, marital status, age, household size, education, family income, subjective class location, subjective chances for mobility, political ideology, and political party identification. Model 3 provides the probability level of the inequality index coefficient in parentheses. Interactions of inequality index and year are only included when significant. Probability levels are indicated by **, p ≦ .01; *, p ≦ .05; †, p ≦ .10. Standard errors are in parentheses.