1. Introduction
Bubble nucleation triggered on the solid–liquid interface is a common phenomenon in industrial processes, such as on ship hulls during navigation, the inner walls of petroleum transport pipelines and the electrode surfaces in water electrolysis systems (Lohse & Zhang Reference Lohse and Zhang2015; Lohse Reference Lohse2018; Mathai, Lohse & Sun Reference Mathai, Lohse and Sun2020; Pfeiffer et al. Reference Pfeiffer, Shahrooz, Tortora, Casciola, Holman, Salomir, Meloni and Ohl2022; Kempler, Coridan & Luo Reference Kempler, Coridan and Luo2024; Gao et al. Reference Gao, Chen, Wang, Li and Sun2025; Legendre & Zenit Reference Legendre and Zenit2025). Studying the threshold of bubble nucleation at the solid–liquid interface helps regulate the positive or negative impacts induced by the presence of bubbles (Sepahi et al. Reference Sepahi, Verzicco, Lohse and Krug2024; Guo et al. Reference Guo2025). Especially in the electrolysis process, bubble nucleation at the electrode interface contributes to enhancing the efficiency of gas mass transfer and energy conversion (Park et al. Reference Park, Liu, Demirkır, van der Heijden, Lohse, Krug and Koper2023; Zhang & Lohse Reference Zhang and Lohse2023; Bashkatov et al. Reference Bashkatov, Park, Demirkır, Wood, Koper, Lohse and Krug2024; Zhang et al. Reference Zhang, Guo, Frenkel, Dobnikar and Zhang2024c ). Recent advances in microelectrode design demonstrate that optimised surface nanostructures can substantially improve electrochemical reaction efficiency through two synergistic mechanisms: (i) increasing the density of catalytically active sites and (ii) controlling the bubble nucleation dynamics to facilitate gas release (Xu et al. Reference Xu, Lu, Sun, Jiang and Duan2018; Angulo et al. Reference Angulo, van der Linde, Gardeniers, Modestino and Rivas2020; Yu et al. Reference Yu2023). Redesigning the nano/micro-structures on the electrode to obtain a higher electrolysis efficiency requires a fundamental understanding of the microscopic mechanism of bubble nucleation on a rough solid surface (Van Der Linde et al. Reference Van Der Linde, Penas-Lopez, Soto, Van Der Meer, Lohse, Gardeniers and Rivas2018; Ma et al. Reference Ma, Guo, Chen and Zhang2021; Deng et al. Reference Deng, Shan, Meng, Yu, Lu, Ma, Zhao, Qiu, Zhang and Liu2022).
In practical electrolysis systems, tin catalyst particles with hierarchical nanostructures are typically deposited on electrode surfaces. Such structural complexity leads to the heterogeneous physicochemical properties at the electrode–electrolyte interface in aqueous environments (Edwards, White & Ren Reference Edwards, White and Ren2019; Chen et al. Reference Chen, Liu, Edwards, Liu and White2020; Wang et al. Reference Wang, Li, Velázquez-Palenzuela, Bai, Dong, Bai and Zhang2023a , Reference Wang, Li, Velázquez-Palenzuela, Bai, Dong, Bai and Zhangb ). Therefore, investigating bubble nucleation on rough electrodes with nanoscale defects or wells (nanowells) is more essential and challenging than on smooth electrodes (Van Der Linde et al. Reference Van Der Linde, Penas-Lopez, Soto, Van Der Meer, Lohse, Gardeniers and Rivas2018; Xu et al. Reference Xu, Lu, Sun, Jiang and Duan2018; Angulo et al. Reference Angulo, van der Linde, Gardeniers, Modestino and Rivas2020). Both the microscopic non-uniformity of the solid surface and the presence of pre-entrapped nanometre-sized bubbles (nanobubbles) in nanowells can significantly affect the onset of bubble nucleation at the electrode–electrolyte interface (Lohse & Zhang Reference Lohse and Zhang2015; Bussonnière et al. Reference Bussonnière, Liu and Tsai2020; Xiao et al. Reference Xiao, Liu, Guo, Liu and Zhang2017). This also leads to a large discrepancy in the bubble nucleation threshold between experimental measurements and theoretical predictions (Lohse & Prosperetti Reference Lohse and Prosperetti2016). Despite extensive research, the underlying mechanisms governing bubble nucleation on rough electrodes at the nanoscale still remain unclear, particularly regarding the dynamic coupling between local gas supersaturation and surface defects.
In this work, given the great challenges in in situ observation of sub-nanometre surface bubble nucleation in experiments, we performed molecular dynamics (MD) simulations to investigate how nanoscale surface defects influence bubble nucleation thresholds. The defects can be simplified as nanowells that trap gas or liquid, as shown in figure 1(a,b). We found that bubble nucleation has a critical transition with the width of the nanowell varying in both cases. Based on classical nucleation theory, van der Waals fluid theory and statistical mechanics, we theoretically analyse the physical principles for the effect of nanowell width on bubble nucleation threshold and propose a multiscale model to predict the threshold of surface bubble nucleation. Our findings extend the classical nucleation theory to the sub-nanometre scale, providing new insights into the optimisation of nano/micro-electrodes for water electrodialysis.
Schematics of a submerged solid with a nanowell entrapped with (a) gas and (b) liquid. Black and orange dashed lines in (a) indicate the expansion (supersaturation) and recession (undersaturation) states of the surface nanobubble, respectively. Here,
 $p_g$
and
 $p_v$
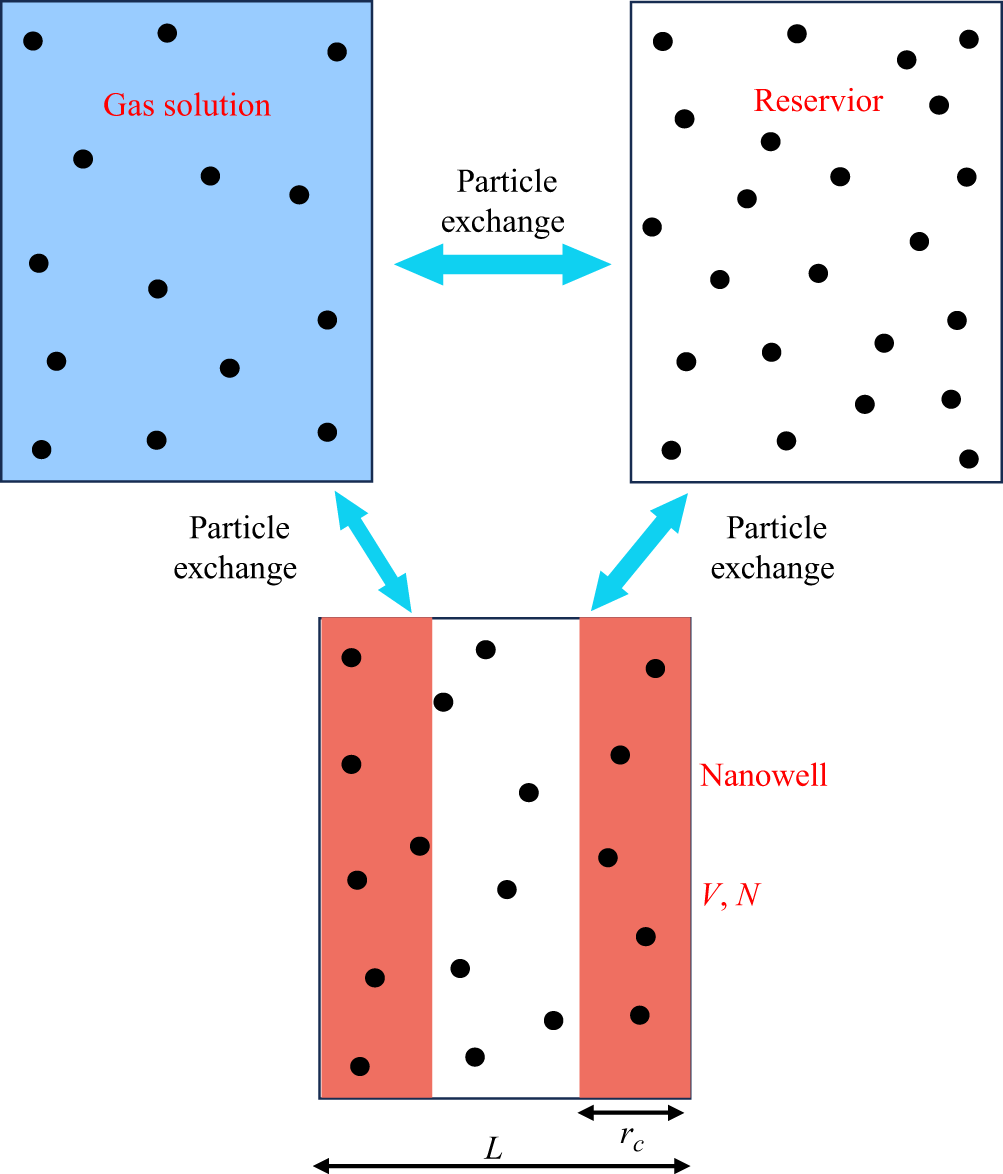
are the partial pressures of gas and vapour. (c) Molecular dynamics set-up of a gas-filled nanowell system with a fixed bulk gas concentration
 $c_g$
. Yellow particles: gas molecules; blue particles: solvent; red substrate: platinum surface. The nanowell width
 $L$
is systematically varied from 0 to 30
 $\sigma_0$
, in which
 $\sigma_0$
is the diameter of the Lennard–Jones molecule. (d) With the variation of
 $L$
, bubble nucleation driven by
 $\Delta p$
is observed for gas-filled nanowell (red dots) and liquid-filled nanowell (blue dots). The position of blue and red points has a slight deviation from each other to avoid data overlap.

2. Molecular dynamics simulation methods
Previous studies reported by Harvey et al. (Reference Harvey, Barnes, McElroy, Whiteley, Pease and Cooper1944) and Borkent et al. (Reference Borkent, Gekle, Prosperetti and Lohse2009) have shown that surface cavitation and bubble nucleation occur preferentially at microscale defects (typically
 $\gt$
50 nm) due to reduced nucleation energy barriers. However, the effect of nanowells, particularly those of a few nanometres, on surface bubble nucleation remains largely unexplored. In this work, we focus on the nanowells width
 $L$
within 10 nm and explore the bubble nucleation at the rough solid interface by analysing the bubble nucleation threshold. For simplicity, we developed a model featuring a liquid–solid interface with a cylindrical nanowell, as illustrated in figure 1(a,b). To optimise computational efficiency, the two-dimensional MD model is employed, as shown in figure 1(c). Simulations were performed using the large-scale atomic/molecular massively parallel simulator (LAMMPS) package (Plimpton Reference Plimpton1995) (see Appendix A for details).
In order to simulate the bubble nucleation at the real electrode interface induced by gas supersaturation, we used the gas concentration
 $c_{g}$
(or the chemical potential of the gas
 $\mu _{g}$
) in solution as a control variable, where the subscript
 $g$
denotes gas in this work. Each run of MD simulation is conducted under fixed external pressure
 $p_{ext}$
and gas chemical potential
 $\mu _{g}$
. Here, the constant gas chemical potential
 $\mu _{g}$
is achieved by fixing gas concentration
 $c_{g}$
in the reservoir (red dashed rectangle in figure 1
c). The nanowell width
 $L$
is varied within 10 nm, i.e.
 $0 \leqslant L\leqslant 30\sigma _0$
, in which
 $\sigma _0=3.4$
Å is the diameter of the Lennard–Jones molecule. Then we investigate the effect of the nanowell width on bubble nucleation. Furthermore, to systematically compare bubble nucleation pathways at rough interfaces, we investigate two distinct initial nanowell configurations: (a) gas-filled nucleation (GFN): bubble nucleation initiates from gas-filled nanowell (figure 1
a). (b) Liquid-filled nucleation (LFN): bubble nucleation occurs in liquid-filled nanowells (figure 1
b). Guo et al. (Reference Guo, Liu, Xiao and Zhang2016) found that surface nanobubbles hidden in solid interface gaps are ubiquitous and can stabilise for a long time through simulations. Therefore, our assumption for GFN, i.e. pre-entrapped gas in a nanowell, is reasonable and acceptable.
Fixing the nanowell width (
 $L$
), we gradually increase the concentration of gas
 $c_g$
in the reservoir. Then we run the simulation for a certain time period (
 $\tau = 200\,$
ns) to determine whether nucleation occurs or not. The corresponding results are shown in figure 1(d), which demonstrates that the bubble nucleation goes from non-occurring to occurring with increasing gas concentration
 $c_g$
(or equivalently pressure difference
 $\Delta p$
), where the hollow symbols indicate that nucleation occurs and the forked symbols indicate that nucleation does not occur. This is true for both GFN (red dots) and LFN (blue dots). Notably, the nucleation driven by
 $\Delta p$
shows an opposite dependence on
 $L$
for GFN and LFN. We thoroughly elucidate each case, then finally establish the entire phase diagram for bubble nucleation on rough solid interfaces.
(a) Schematic of pre-entrapped gas in a nanowell. (b) Snapshots of MD at different nanowell widths
 $L$
: top: GFN at
 $L=20\sigma _0$
; middle: surface bubble nucleation at
 $L=3\sigma _0$
; bottom: surface bubble nucleation on smooth surface (
 $L=0$
). (c) Normalised nucleation threshold
 $\Delta p^\ast /p_{ext}$
versus
 $L/\sigma _0$
. The red circles indicate the results of MD. The error bar represents the standard deviation. The green dashed line is calculated by classical nucleation theory. The orange solid line is the fitting line of MD data points, i.e.
 $\Delta p^\ast /p_{ext}=3.96$
. The green solid line is calculated by modified classical nucleation theory. (d) Free energy profile for nucleation on the smooth surface (
 $\xi =5$
). The parameter
 $\Delta G^\ast$
indicated by the blue arrow is the nucleation energy barrier. (e) The GFN free energy profile at
 $L=20\sigma _0$
(
 $\xi =5$
). (f) Density distribution of the gas in a nanowell (
 $L = 10\sigma _0$
), where
 $\rho _{liq}=0.71 \sigma _0^{-3}$
(pure liquid phase density).

3. Results and discussion
3.1. Gas-filled nucleation
For the case of pre-entrapped gas in the nanowell (figure 2
a), the MD snapshots of the GFN occurrence are shown in the top row of figure 2(b) when
 $L=20\sigma _0$
. Meanwhile, the MD snapshots for
 $L=3\sigma _0$
and
 $L=0$
(smooth surface) are presented in the middle and bottom rows of figure 2(b). By scanning the parameters of nanowell width
 $L$
and gas concentration
 $c_g$
, we obtain the nucleation threshold
 $\Delta {p}^\ast (L)$
, quantified by the red circles in figure 2(c). Notably, the nucleation threshold
 $\Delta {p}^\ast /p_{ext}$
asymptotically approaches a plateau value of 3.96 at
 $L = 3\sigma _0$
(orange line in figure 2
c). This converged value coincides with the nucleation threshold on atomically smooth surfaces, as determined by MD under identical conditions. Molecular dynamics indeed shows that bubble nucleation occurs at smooth surface rather than nanowell at
 $L\leqslant 3\sigma _0$
, i.e. the middle row of figure 2(b).
To further understand the results of MD, a theoretical model, i.e. classical nucleation theory, is used to interpret them. The free energy
 $\Delta G$
governing bubble nucleation is described by the thermodynamic differential
 \begin{equation} {\rm d}(\Delta G) = -\Delta p {\textrm d}V_b +\gamma {\textrm d}A_b, \end{equation}
where
 $V_b$
and
 $A_b$
are the volume and area of the bubble, the subscript
 $b$
indicates bubble and
 $\gamma$
is the surface tension of the gas–liquid interface. The pressure difference
 $\Delta p$
across the gas–liquid interface is derived as
 \begin{equation} \Delta {p}=p_g+p_v-p_{ext}=\textit{Hc}_{g}+p_v-\big(p_v+p_g^{sat}\big)=\xi p_g^{sat} ,\end{equation}
where Henry’s law gives
 $p_{g}=\textit{Hc}_g$
, where
 $H$
is the Henry coefficient,
 $\xi =c_{g}/c_{g}^{sat}-1$
defines the gas supersaturation,
 $c_{g}^{sat}$
and
 $p_{g}^{sat}$
are the saturation concentration and partial pressure of gas at ambient pressure
 $p_{ext}$
,
 $p_{g}^{sat}=\textit{Hc}_{g}^{sat}$
, the subscript
 $v$
indicates vapour and the superscript
 $sat$
indicates saturation state.
For the smooth surface without a nanowell (
 $L=0$
) and the solid–liquid interface with a nanowell (
 $L=20\sigma _0$
), the free energy profiles during bubble nucleation are plotted as shown in figure 2(d,e). Accordingly, the nucleation energy barriers
 $\Delta {G}^{\ast }$
, i.e. the difference between the maximum and minimum values of the free energy (as indicated by the blue arrow in figure 2
d,e), are derived respectively as
 \begin{align}&\qquad\quad\,\, \Delta {G_{smooth}^{\ast }}=\frac {\gamma ^2D}{\Delta {p}^{\ast }}(\theta _Y+\cos \theta _Y\sin {\theta _Y}), \end{align}
 \begin{align}& \Delta {G_{well}^{\ast }}=\frac {\gamma ^2D}{\Delta {p}^{\ast }}\left(\theta _Y+\cos \theta _Y\sin {\theta _Y}-\theta _1-\frac {1}{2}\sin 2\theta _1\right), \end{align}
where
 $D$
is the thickness in the Y-direction,
 $\theta _Y$
is Young’s contact angle,
 $\theta _1$
is the metastable contact angle at the local free energy minimum as shown in the inset in figure 2
e),
 $\sin \theta _1=L\Delta p/(2\gamma )$
, the subscripts
 $smooth$
and
 $well$
indicate the smooth surface and the one with a nanowell and the superscript
 $\ast$
indicates the value at which bubble nucleation occurs. The detailed deviation processes of (3.1), (3.3) and (3.4) are provided in Appendix A. Note that the volume and area of the bubbles we calculated here are based on a two-dimensional cylindrical system for the purpose of benchmarking the MD results. This assumption also applies to all subsequent theoretical calculations.
Based on (3.1)–(3.4), the plotted free energy curves in figure 2(d,e) show that the nucleation energy barrier for the smooth surface, i.e.
 $\Delta {G_{smooth}^{\ast }}=50.1k_BT$
(
 $k_B$
is the Boltzmann constant and
 $T$
is the absolute temperature), is larger than that for the surface with a nanowell (width
 $L=20\sigma _0$
), i.e.
 $\Delta {G_{well}^{\ast }}=9.52k_BT$
. This suggests that bubble nucleation is more likely to occur at the interface with a nanowell, which is consistent with the MD results in figure 2(c). The red circles in figure 2(c) show that the nucleation threshold
 $\Delta p^\ast$
for the interface with nanowells of width
 $L\gt 3\sigma _0$
is lower than that for the smooth surface (
 $L=0$
). This means that it is more difficult to nucleate bubbles on the smooth surface.
To establish the scaling relationship between the nucleation threshold
 $\Delta p^\ast$
and the nanowell width
 $L$
, we choose the probability of nucleation
 $\Sigma =1-\exp (-JV\tau )\gt 0.5$
as the criterion for nucleation occurrence (Bossert et al. Reference Bossert, Trimaille, Cagnon, Chabaud, Gueneau, Spathis, Wolf and Rolley2023; Chen et al. Reference Chen, Zhang, Guo, Pagonabarraga and Zhang2024), where
 $V$
is the volume of the system (
 $V=1.23\times 10^5\sigma _0^3$
) and
 $\tau = 200$
ns is the characteristic time in our MD simulations. The nucleation rate
 $J$
of bubbles per unit volume and unit time is computed via classical nucleation theory as
 $J=J_0\exp (-\Delta G^\ast /k_B T)$
(Debenedetti Reference Debenedetti2020; Bossert et al. Reference Bossert, Trimaille, Cagnon, Chabaud, Gueneau, Spathis, Wolf and Rolley2023; Chen et al. Reference Chen, Zhang, Guo, Pagonabarraga and Zhang2024), where the kinetic pre-factor
 $J_0$
is fitted from the MD results for the smooth surface as a reference. In MD simulations, bubble nucleation on the smooth surface occurs exactly when
 $\xi =7.6$
and
 $\Delta G^\ast =32.93k_B T$
. Using (3.4), we calculate the theoretical nucleation threshold
 $\Delta p^\ast$
(when
 $\Sigma =0.5$
) as a function of
 $L$
, as indicated by the green dashed line in figure 2(c). The results indicate that classical nucleation theory predictions and MD results are in good agreement for large widths (
 $L\gt 12\sigma _0$
) but deviate increasingly for small widths (
 $L\lt 12\sigma _0$
).
To elucidate the origin of this deviation, we try to analyse the real state of the gas in the nanowell. Figure 2( f) quantifies the gas density profile
 $\rho$
at
 $L=10\sigma _0$
, revealing that the gas density near the inner walls is significantly higher than that in the middle of the nanowell. The wall adsorption phenomenon induces a reduction in the effective width
 $L_{\textit{eff}}$
of the nanowell. According to the statistical results (details in Appendix A, figure 7), the difference between the effective width
 $L_{\textit{eff}}$
and the real width
 $L$
is found to be almost constant, i.e.
 $\delta =L-L_{\textit{eff}} \approx 3\sigma _0$
. This difference
 $\delta$
corresponds to the critical transition value of
 $\Delta p^\ast$
in figure 2(c). Specifically, when
 $L \leqslant 3\sigma _0$
, the effective width of the nanowell with pre-entrapped gas is smaller than zero, i.e.
 $L_{\textit{eff}} \leqslant 0$
. Under this condition, the nucleation threshold
 $\Delta p^\ast$
at the rough interfaces converges to the smooth surface value, i.e. the orange solid line in figure 2(c). Furthermore, replacing
 $L$
– which describes
 $\theta _1$
in classical nucleation theory (3.4) – with
 $L_{\textit{eff}}$
significantly improves the agreement between theoretical predictions and MD results. This modified classical nucleation theory, represented by the green solid line in figure 2(c), provides a more accurate description of the nucleation behaviour for the gas-entrapped nanowell.
(a) Schematic of pre-filled liquid in the nanowell. (b) Two stages of bubble nucleation for the liquid-filled nanowell: stage 1 (left): LFN; stage 2 (right): GFN. (c) The MD snapshots of bubble nucleation for
 $L=20\sigma _0$
(top) and
 $L=6\sigma _0$
(bottom). (d) Normalised nucleation threshold
 $\Delta p^\ast /p_{ext}$
versus
 $L/\sigma _0$
. The blue squares are data points from MD simulation. The light green solid line is calculated by the classical nucleation theory when
 $L\gt 15\sigma _0$
. The pink dashed line is calculated from the classical nucleation theory when
 $L\lt 15\sigma _0$
. The pink solid line is calculated by using the van der Waals fluid-statistical mechanics theory. (e) Free energy profile during bubble nucleation calculated from (3.1) with
 $L=20\sigma _0 ( \xi =5$
). The first nucleation energy barrier corresponds to LFN; the second nucleation energy barrier corresponds to GFN. The higher energy barrier of the two determines the final nucleation process of the surface bubbles. (f) Free energy profile during bubble nucleation calculated from (3.5) with different
 $L$
(
 $L\lt 15\sigma _0$
). The parameters
 $\Delta G^\ast$
and
 $\varDelta\Omega ^\ast$
indicated by the blue arrow are the nucleation energy barriers.

3.2. Liquid-filled nucleation
The overall bubble nucleation process in the liquid-filled nanowell (figure 3
a) is more complicated than the gas-filled nanowell since the former involves two consecutive stages: LFN, followed by GFN, as illustrated in figure 3(b). In this section, we focus primarily on the first stage (LFN) because GFN has already been explored in § 3.1. To investigate the LFN process, we perform MD for nanowells of different widths (
 $L=20\sigma _0$
and
 $L=6\sigma _0$
), with the evolution of bubble nucleation in these systems shown in figure 3(c). For different widths
 $L$
, the nucleation thresholds
 $\Delta p^\ast$
obtained by MD are quantified as blue squares in figure 3(d). These results indicate that the threshold for LFN is approximated as a constant for relatively large
 $L$
(
 $L\gt 15\sigma _0$
) but decreases for smaller
 $L$
(
 $L\lt 15\sigma _0$
).
For large nanowell, i.e.
 $L=20\sigma _0$
, the MD configuration in figure 3(c) (top row) shows bubble nucleation occurring at the corner, with a corresponding schematic inset in figure 3(e). The free energy
 $\Delta G$
for this process, calculated using (3.1), is plotted in figure 3(e), where
 $\Delta G^\ast$
is the nucleation energy barrier. Furthermore, the nucleation thresholds
 $\Delta p^\ast$
(associated with
 $\Delta G^\ast$
) predicted by the classical nucleation theory at
 $L\gt 15\sigma _0$
are represented by the light green solid line in figure 3(d), demonstrating good agreement with MD results. Here, the calculated nucleation threshold
 $\Delta p^\ast$
remains constant because the critical nucleus size
 $H^\ast$
(figure 3
e), which determines the nucleation energy barrier
 $\Delta G^\ast$
(or the nucleation threshold
 $\Delta p^\ast$
), is smaller than the nanowell size
 $L$
. This implies that
 $L$
no longer affects
 $\Delta G^\ast$
(or
 $\Delta p^\ast$
) through
 $H^\ast$
when
 $L\gt H^\ast$
. However, classical nucleation theory fails to predict the dependence of the nucleation threshold on the small nanowell sizes (
 $L\lt 15\sigma _0$
), as shown by the pink dashed line in figure 3(d). This discrepancy arises because the bubble shape exhibits significant fluctuations during nucleation at small scales (Menzl et al. Reference Menzl, Gonzalez, Geiger, Caupin, Abascal, Valeriani and Dellago2016), preventing accurate geometric approximations (e.g. spheres/cylinders). Consequently, classical nucleation theory faces challenges in explaining the decreasing threshold trend at smaller
 $L$
values, especially for
 $L\lt 10\sigma _0$
.
To elucidate the microscopic mechanism underlying the decrease of
 $\Delta p^\ast$
with reduced
 $L$
for small nanowells, we model the filled gas or liquid as van der Waals fluids. This modelling approach is validated for the Lennard–Jones fluid in our MD (Johnston Reference Johnston2014; Auti et al. Reference Auti, Paul, Hsu, Chiashi, Maruyama and Daiguji2024). Within the van der Waals theoretical framework, the total free energy of the fluid in the nanowell is expressed as the grand potential
 $\Omega$
in the isochemical potential system
 \begin{equation} \begin{aligned} \Omega &=F-N\mu +F_{\textit{surf}}\\ &=-\frac {k_BTN}{V\rho b}-N\rho a+F_{\textit{surf}}, \end{aligned} \end{equation}
where
 $F$
denotes the Helmholtz free energy of the nanowell-confined fluid,
 $N$
denotes the number of molecules within the nanowell,
 $\mu$
denotes the system’s chemical potential,
 $\rho$
denotes the fluid density and
 $a$
and
 $b$
are van der Waals constants. The subscript
 $\textit{surf}$
denotes the surface. The first two terms in (3.5) quantify the free energy of bulk fluid.
 $F_{\textit{surf}}$
represents the interfacial energy. For the van der Waals fluid, the detailed calculations on
 $F$
and
 $\mu$
are shown in Appendix A.
For the fluids confined in sub-nanometre scale wells, the influence of the solid inner wall on the fluid becomes increasingly significant as the width
 $L$
decreases (Hill Reference Hill1962, Reference Hill1994; Qian Reference Qian2012). This influence is manifested primarily in interfacial energy
 $F_{\textit{surf}}$
. For such systems, statistical mechanics provides a rigorous framework to describe fluid–wall interfacial energy. Based on previous studies (Dong Reference Dong2021, Reference Dong2023), we assume that the interaction potential between fluid molecules and inner walls is approximated by a simplified square-well potential. Consequently, the interfacial energy
 $F_{\textit{surf}}$
is derived as follows (see Appendix A for detailed calculations):
 \begin{equation} F_{\textit{surf}}=\begin{cases} -\frac {2A r_c e^{\beta \mu }(e^{\beta \epsilon }-1)}{\beta \lambda ^3} +\gamma LD\left(1-\frac {\rho }{\rho _{liq}}\right) & L\gt 2r_c, \\[5pt] -\frac {Ve^{\beta \mu }(e^{\beta \epsilon }-1)}{\beta \lambda ^3} \left[1+\left(\frac {2r_c }{L}-1\right)e^{\beta \epsilon }\right]+\gamma LD\left(1-\frac {\rho }{\rho _{liq}}\right) & r_c\lt L\lt 2r_c. \end{cases} \end{equation}
where
 $A$
is the area of the inner wall on one side,
 $\beta =1/k_BT$
,
 $\lambda$
is the thermal wavelength,
 $\rho _{liq}=0.71 \sigma _0^{-3}$
is bulk liquid phase density and
 $r_c$
and
 $\epsilon$
are the fluid–wall interaction range and magnitude. The first term quantifies the solid–fluid interfacial energy
 $F_{\textit{surf}}^{f-w}$
, whose weight on the total free energy increases rapidly as
 $L$
decreases (Dong Reference Dong2021, Reference Dong2023; Zhang et al. Reference Zhang, Guo, Frenkel, Dobnikar and Zhang2024a
). The second term corresponds to the fluid–liquid interfacial energy
 $F_{\textit{surf}}^{f-l}$
, which arises from the density difference across the nanowell’s gas–liquid (or liquid–liquid) boundary.
By substituting (3.6) into (3.5), we calculate the total free energy
 $\Omega$
during bubble nucleation (or liquid–gas phase transition) inside the nanowell, as shown in figure 3(f). From the energy curves, we observe the decrease of energy barrier
 $\varDelta \Omega ^\ast$
as decreasing
 $L$
, which stems from the amplified wall–fluid interactions at small scales, i.e.
 $L \lt 15\sigma _0$
. Decreasing
 $L$
enhances the contribution of interfacial energy
 $F_{\textit{surf}}$
while suppressing the bulk free energy
 $\Omega _{bulk}=-{k_BTN}/{V\rho b}-N\rho a$
. The bulk free energy
 $\Omega _{bulk}(\rho )$
dominates the nucleation energy barrier
 $\varDelta\Omega^\ast$
during bubble nucleation, whereas the interfacial energy
 $F_{\textit{surf}}$
exhibits negligible density dependence because the magnitude of
 $F_{\textit{surf}}$
is much smaller than that of
 $\Omega _{bulk}$
. Consequently, the reduced contribution of
 $\Omega _{bulk}$
directly lowers
 $\varDelta\Omega ^\ast$
as decreasing
 $L$
(associated with
 $N$
and
 $V$
). Furthermore, by selecting the reference energy barrier
 $\varDelta \Omega ^*=18.95k_BT$
(corresponding to corner bubble nucleation at
 $L \gt 15\sigma _0$
), the nucleation threshold
 $\Delta p^\ast$
for different
 $L$
is obtained, as shown by the pink solid line in figure 3(d). In the calculations, the chemical potential
 $\mu$
is converted to gas concentration
 $c_g$
(or
 $\Delta p$
) as the control parameter. Our theoretical model successfully predicts the
 $\Delta p^\ast (L)$
scaling for
 $L\lt 15\sigma _0$
, demonstrating the breakdown of the classical nucleation theory and the validity of van der Waals fluid-statistical mechanics theory for bubble nucleation in small nanowells.
The failure of classical nucleation theory originates from thermal fluctuations of bubbles at small scales (Menzl et al. Reference Menzl, Gonzalez, Geiger, Caupin, Abascal, Valeriani and Dellago2016). In small nanowells, significant thermal fluctuations in bubble volume
 $V_b$
introduce substantial deviations between MD and classical nucleation theory. The van der Waals fluid-statistical mechanics theory circumvents this issue by adopting the average density
 $\rho$
of the fluid within the nanowell – rather than the inaccurate
 $V_b$
– as the control parameter, which aligns with MD observations showing rapid bubble percolation across the entire nanowell (figure 3
c, bottom row). In contrast, in large nanowells, localised critical nuclei form preferentially at corners (figure 3
c, upper row), where suppressed thermal fluctuations restore the validity of classical nucleation theory via quasi-static nucleation pathways with definable
 $V_b$
. However, at smaller scales, i.e.
 $L\leqslant 3\sigma _0$
, real molecules may exhibit significant quantum effects that are not captured by the current Lennard–Jones (LJ) model.
3.3. Optimal structure design for bubble nucleation
Molecular dynamics simulations and theoretical analyses elucidate the bubble nucleation mechanisms in nanowells filled with gas or liquid. These findings are significant for electrochemical applications. Comparative analysis of GFN and LFN reveals a critical effective width
 $L_{\textit{eff}}^{crit}$
that delimits opposing nucleation regimes (figure 4): (i) the LFN-dominated regime (
 $L_{\textit{eff}}\lt L_{\textit{eff}}^{crit}$
): the nucleation threshold for LFN is lower than that for GFN. (ii) The GFN-dominated regime (
 $L_{\textit{eff}}\gt L_{\textit{eff}}^{crit}$
): the GFN–LFN relationship is reversed. This opposite dependence of
 $\Delta p^\ast$
on
 $L$
suggests distinct physical mechanisms governing GFN and LFN. For the GFN system, as
 $L$
decreases, the amount of gas entrapped within the nanowell decreases, whereas a larger amount of entrapped gas favours bubble nucleation, as gas and bubbles share the same phase. Thus, less entrapped gas makes GFN more difficult, i.e. the nucleation threshold increases. For the LFN system, as
 $L$
decreases, the amount of the filled liquid decreases, whereas a larger amount of filled liquid is unfavourable for bubble nucleation due to two distinct phases. Thus, less filled liquid facilitates LFN, i.e. the nucleation threshold decreases.
The nucleation threshold
 $\Delta p^\ast$
versus
 $L_{\textit{eff}}$
for all cases, including GFN and LFN.

The phase diagram of bubble nucleation is plotted as a function of
 $\Delta p^\ast$
and
 $L$
. No nucleation: neither GFN nor LFN occurs. Only LFN: LFN occurs, but GFN is suppressed. Only GFN: GFN occurs, but LFN is suppressed. Gas-filled nucleation or LFN
 $\xrightarrow {}$
GFN: GFN occurs or emerges following LFN.

In practice, the electrode interfaces often exhibit complex configurations where nanowells contain mixed gas and liquid. To establish theoretical baselines, we construct the unified phase diagram (figure 5) and analyse separately two idealised scenarios: (i) gas-filled nanowells: the nucleation threshold
 $\Delta p^\ast$
decreases monotonically with
 $L$
. (ii) Liquid-filled nanowells: the minimum nucleation threshold occurs at
 $L_{\textit{eff}}=6\sigma _0$
, corresponding to an actual size
 $L \approx 9\sigma _0$
. Additionally, we want to note that the present optimal parameter
 $L \approx 9\sigma _0$
is somewhat close to the findings on flat electrodes by Gadea et al. (Reference Gadea, Perez Sirkin, Molinero and Scherlis2024), where they found an optimal size for the nanoelectrodes of
 ${\sim}3$
nm. Although we are dealing with different targets, these findings are important for guiding electrode fabrication to improve electrolysis efficiency.
4. Conclusions
In conclusion, we systematically investigate GFN and LFN at solid interfaces with nanowells (
 $L\lt 30\sigma _0$
) using MD simulations and theoretical analysis. For GFN, the nucleation threshold increases with decreasing nanowell width
 $L$
and converges to a plateau at
 $L \leqslant 3\sigma _0$
, which cannot be fully explained by classical nucleation theory. By incorporating the thickness of the gas–solid interfacial layer within the nanowell, we propose a modified classical nucleation theory model, which agrees well with the MD results. This relationship between the threshold
 $\Delta p^\ast$
and the width
 $L$
arises from a decrease in the amount of filled gas that promotes bubble nucleation, and the filled gas eventually becomes confined within the interfacial layer as
 $L$
decreases. For LFN, as
 $L$
decreases, the nucleation threshold is first kept constant, which is consistent with classical nucleation theory, but subsequently decreases, which conforms to van der Waals fluid-statistical mechanics theory rather than classical nucleation theory. This dependence of the threshold
 $\Delta p^\ast$
on
 $L$
originates from a decrease in the amount of filled liquid that inhibits bubble nucleation and from the enhanced confinement effect of the inner wall on the filled liquid as
 $ L$
decreases. The confinement here is mainly reflected in the intrusion of solid–liquid interfaces into the bulk liquid in the nanowell, i.e. as the nanowell width decreases, the proportion of the low-density solid–liquid interfacial layer to the total liquid in the nanowell increases, leading to a decrease in the total liquid number density, which in turn facilitates bubble nucleation. Finally, combining the MD results and the theoretical model, we establish a unified phase diagram and identify an optimal nanowell size (
 $L \approx 9\sigma _0$
) that minimises the nucleation threshold for liquid-filled nanowells. These findings provide in-depth understanding of bubble nucleation mechanisms at sub-nanometre-scale rough interfaces and offer fundamental insights into optimising nano/micro-electrode design.
Funding
We thank F. Yang for insightful discussions. This work is supported by NSFC Excellence Research Group Program for ‘Multiscale Problems in Nonlinear Mechanics’ (No. 12588201), the National Natural Science Foundation of China under Grant No. 52406254, the National Key R&D Program of China under Grant No. 2021YFA0716201, the New Cornerstone Science Foundation through the New Cornerstone Investigator Program and the XPLORER PRIZE, the Postdoctoral Fellowship Program of CPSF under Grant No. GZC20231217 and the China Postdoctoral Science Foundation under Grant No. 2024M751663.
Declaration of interests
The author reports no conflict of interest.
Appendix A.
A.1. Molecular dynamics simulations
The MD simulations were performed using the LAMMPS package (Plimpton Reference Plimpton1995) to investigate bubble nucleation at the solid–liquid interface with a nanowell structure. The simulation model consists of LJ particles representing liquid (L), gas (G) and solid substrate (S). To optimise computational efficiency, each molecule segment was modelled as a single LJ bead. This representation allowed adjustment of interaction parameters between LJ beads to accurately reflect the intrinsic properties of L, G and S.
The non-bonded interaction
 $U_{ij}(r)$
between any two beads of types
 $i$
and
 $j$
is represented by the LJ potential, which is given by
 \begin{equation} U_{ij}=4\epsilon _{ij} \left (\left [\left (\frac {\sigma _{ij}}{r}\right )^{12}-\left (\frac {\sigma _{ij}}{r}\right )^{6} \right ]-\left [\left (\frac {\sigma _{ij}}{r_c}\right )^{12}-\left (\frac {\sigma _{ij}}{r_c}\right )^{6} \right ]\right ),\quad r\lt r_c \end{equation}
where
 $r$
is the distance between the particles,
 $r_c$
is the truncation distance,
 $\sigma _{ij}$
is the size parameter and
 $\epsilon _{ij}$
is the energy parameter. For the LJ potential, the cutoff distance
 $r_c$
was set to 3.2
 $\sigma _0$
. All variables, unless specified, are expressed in reduced units, with length and energy scales set by the LJ parameters of the solvent–solvent interaction (denoted as
 $\sigma _0$
and
 $\epsilon _0$
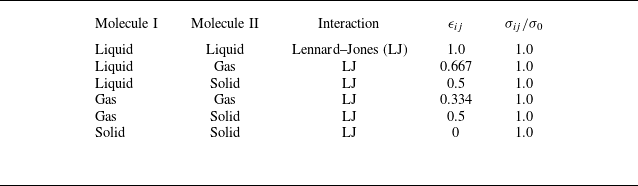
, respectively). The interaction parameters used are listed in table 1. To convert reduced units to real units, the solvent particles are modelled as argon atoms.
The parameters for the interaction between different molecules.

To save computational cost, a quasi-two-dimensional (2-D) simulation box having a size of
 $160 \times 4 \times Z$
in unit
 $\sigma _0$
was used, as illustrated in figure 1(c) of the main text. At the top and bottom of the simulation box, we placed two solid substrates composed of frozen solid atoms. Periodic boundary conditions were used in the X and Y directions. We carried out the constant number of molecules, pressure, and temperature (NPT) ensemble simulations for the system containing L, G and S molecules. The equation of motion was integrated using the classic velocity-Verlet algorithm with a time step of
 $0.0023\tau$
. Here,
 $\tau =\sigma _0\sqrt {m_0/\epsilon _0}$
and
 $m_0$
is the mass of the solvent atom. The fluid temperature
 $T$
was maintained at
 $k_BT= 0.804\epsilon _0$
, where
 $k_B$
is the Boltzmann constant, via the Nose–Hoover thermostat with a constant time of
 $0.23\tau$
.
Taking the nanowell width
 $L=20\sigma _0$
as an example, we perform the simulation as follows: to form an initial gas-filled nanowell configuration, we randomly filled 79 360 liquid molecules into the region enclosed by two solid substrates and placed 200 gas molecules into the nanowell region. Then, the configuration of the pre-encaptured gas nanowell was generated by a 2 ns NVT simulation. Further, to assess surface bubble nucleation, a continuous NPT simulation was performed at a given pressure. During the NPT simulation, a gas reservoir (the red dashed rectangle in the main text figure 1
c) (Liu & Zhang Reference Liu and Zhang2014; Guo & Zhang Reference Guo and Zhang2019) was introduced to give the target gas concentration
 $c_g$
, defined as the ratio of gas molecules to solvent molecules. Here,
 $c_g$
was maintained by performing the move of identity exchange between the liquid and gas molecules in the reservoir every 0.01 ns. Adjusting
 $c_g$
established the nucleation threshold for surface bubbles. The same MD protocol was applied to nanowells of other sizes.
In all MD simulations, we set
 $p_{ext}=0.0122\epsilon _0\sigma _0^{-3}$
. Through a separate MD simulation of a liquid slab in contact with a gas, the saturated gas concentration
 $c_g^{sat}$
at
 $p_{ext}=0.0122\epsilon _0\sigma _0^{-3}$
was determined, yielding
 $c_g^{sat}=0.016\pm 0.03$
and
 $p_g^{sat}=0.52p_{ext}$
. The gas–liquid interfacial tension of the planar system was calculated as
 $\gamma =0.047\pm 0.05\epsilon _0\sigma _0^{-2}$
. The equilibrium solid–liquid contact angle
 $\theta _Y$
was counted as
 $\theta _Y\approx 90^\circ$
, as shown in figure 6. Moreover, although 2-D MD simulation has been widely adopted in studying surface nanobubble systems with relatively large scales (Liu & Zhang Reference Liu and Zhang2014, Reference Liu and Zhang2017; Maheshwari et al. Reference Maheshwari, Van Der Hoef, Zhang and Lohse2016; Xiao et al. Reference Xiao, Liu, Guo, Liu and Zhang2017; Chen, Zhang & Zhang Reference Chen, Zhang and Zhang2023), 3-D MD simulation, which requires many more calculation sources, is desirable to validate the applicability of present findings, since different mechanisms would be applied when considering 3-D effects (Binder et al. Reference Binder, Block, Virnau and Tröster2012; Li et al. Reference Li, Li, Zhang and Wang2024).
(a) Snapshot of solid–liquid contact angle in equilibrium. (b) Distribution of measured contact angles
 $\theta _Y\approx 90^\circ$
.

A.2. Classical nucleation theory
In our surface bubble nucleation cases, there are three phases: the gas phase (bubble), the surrounding liquid and the solid substrate, as shown in the main text figure 1(a–c). The whole system can be described in terms of the extensive variables of internal energy, entropy, volume and number of molecules, i.e.
 $U$
,
 $S$
,
 $V$
and
 $N$
. Since our simulation system is at constant temperature
 $T$
, pressure
 $p$
and number of molecules
 $N$
, the corresponding thermodynamic potential is Gibbs free energy
 $G=U+pV-TS$
. The differential variation of
 $G$
at constant
 $N, p, T$
is given by (Reguera et al. Reference Reguera, Bowles, Djikaev and Reiss2003)
 \begin{equation} {\textrm d}G = {\textrm d}U + p{\textrm d}V_t - T{\textrm d}S , \end{equation}
where
 $U=U_1+U_2$
is the total internal energy,
 $S=S_1+S_2$
is the total entropy,
 $V_t=V_1+V_2$
is the total volume and the subscripts 1 and 2 denote the liquid and gas phases, respectively. The differential of the internal energy of each phase is given by (Zhang et al. Reference Zhang, Guo, Frenkel, Dobnikar and Zhang2024
b)
 \begin{align}&\,\, {\textrm d}U_1 = T{\textrm d}S_1 - p_1 {\textrm d}V_1 + \mu _{{v,1}} {\textrm d}N_{{v,1}} + \mu _{{g,1}} {\textrm d}N_{{g,1}}, \end{align}
 \begin{align}& {\textrm d}U_2 = T{\textrm d}S_2 - \Sigma {p_i {\textrm d}V_2} + \Sigma \mu _{{i,2}} {\textrm d}N_{{i,2}} + \Sigma \gamma _{\alpha } {\textrm d}A_{\alpha }, \end{align}
where the subscripts `v,1’, `g,1’, `v,2’ and `g,2’ are used to denote solvent in the liquid phase, gas in the liquid phase, vapour in the gas phase and gas in the gas phase, respectively. The intensive variables of chemical potential and surface tension of the gas–liquid surface are represented by
 $\mu$
and
 $\gamma$
. The last term in (A4) represents the contribution of interfacial energy, where
 $\alpha$
represents liquid–gas, liquid–solid or gas–solid. The surface area
 $A_b$
of a cylindrical bubble with a curvature radius of
 $R_c$
and thickness
 $D$
(Y direction in figure 1
c) is
 $A_b = DR_c\theta$
, and the relationship between
 $A_b$
and
 $V_2$
is
 ${\textrm d}A_b={\textrm d}V_2/R_c$
. In an isolated system, the conservation of particle number results in the relationship
 $ {\textrm d}N_{{v,1}} = -{\textrm d}N_{{v,2}}$
and
 $ {\textrm d}N_{{g,1}} = -{\textrm d}N_{{g,2}}$
.
Substituting all the above conditions into (A2), we get
 \begin{align} {\textrm d}G &= - p_1 {\textrm d}V_1 - p_2 {\textrm d}V_2 + p{\textrm d}V_t + (\mu _{{v,2}} - \mu _{{v,1}}) {\textrm d}N_{{v,2}} + (\mu _{{g,2}} - \mu _{{g,1}}) {\textrm d}N_{{g,2}} \nonumber\\&\quad +\gamma {\textrm d}A_b\left(1+\cos \theta _Y\frac {{\textrm d}A_S}{{\textrm d}A_b}\right), \end{align}
where
 $\cos \theta _Y= (\gamma _{SG}-\gamma _{SL})/\gamma$
,
 $A_S$
is the contact area between the bubble base and the substrate. We can simplify the analysis of high curvature bubble by assuming negligible water vapour migration, as the chemical equilibrium between solvent molecules, i.e. water, in the gas phase and liquid phase is always satisfied. This simplification assumes that
 $\mu _{{v,2}}$
is approximately equal to
 $\mu _{{v,1}}$
. Therefore, in this approach, we primarily examine the movement of gas molecules in both the gas phase and liquid phase, disregarding the migration of solvent molecules. For incompressible liquid solvent, the volume change (
 ${\textrm d}V_1$
) is negligible, and we can approximate it as equal to zero, leading to
 ${\textrm d}V_t\approx {\textrm d}V_2$
. Based on ensemble theory, the equality condition
 $p=p_1$
holds, enabling us to assume
 $p{\textrm d}V_t \approx p_1{\textrm d}V_2$
. Taking these factors into account, we simplify (A5) as
 \begin{equation} {\textrm d}G = (p_1 - p_2) {\textrm d}V_2 + (\mu _{{g,2}} - \mu _{{g,1}}) {\textrm d}N_{{g,2}}+\gamma {\textrm d}A_b\left(1+{\rm cos}\theta _Y\frac {{\textrm d}A_S}{{\textrm d}A_b}\right), \end{equation}
where
 $p_1$
is the liquid phase pressure,
 $p_2=p_{g,2}+p_{v,2}$
is the gas phase pressure. Here,
 $p_{g,2}$
and
 $p_{v,2}$
are the partial pressures of the gas and the vapour in the bubble. Equation (A6) serves as the foundation for the subsequent thermodynamic analysis that we will conduct. In the context of the small bubble system, the state of thermodynamic equilibrium is determined by the conditions
 ${\textrm d}G/{\textrm d}N_{g,2}=0$
,
 ${\textrm d}G/{\textrm d}R_c=0$
and
 ${\textrm d}G/{\textrm d}l=0$
(
 $l$
is the base radius of the bubble), which leads to the well-known requirements of chemical equilibrium (
 $\mu _{{g,1}} = \mu _{{g,2}}$
) and mechanical equilibrium (
 $p_1 + \gamma /R_c = p_2$
,
 $\cos \theta _Y=(\gamma _{SL}-\gamma _{SG})/\gamma$
) for co-existence. These conditions that govern the interplay between a bubble with a curvature radius
 $R_c$
and the surrounding liquid. The equilibrium state can be determined by considering the free energy landscape. In our analysis, we evaluated the free energy of the system as a function of the bubble size (A6), denoted by
 $N_{{g,2}}$
or
 $R_c$
.
For our isochemical potential ensemble, the chemical potentials of the gas are always equal throughout the system. Thus, it follows that
 $\mu _{{g,1}} = \mu _{{g,2}}$
and (A6) can be given a simplification as
 \begin{equation} {\textrm d}G = -\Delta p {\textrm d}V_2 +\gamma {\textrm d}A_b, \end{equation}
where the pressure difference between the inside and outside of the bubble
 $\Delta {p}=p_2-p_1=p_g+p_v-p_{ext}=\textit{Hc}_g+p_v-(p_v+p_g^{sat}) =\textit{Hc}_g-p_g^{sat}=\xi p_g^{sat}$
. Here,
 $\xi$
is the gas supersaturation,
 $\xi =c_g/c_g^{sat}-1$
,
 $c_g^{sat}$
and
 $p_g^{sat}$
are the saturation concentration and the partial pressure of gas at
 $p_{ext}$
. Also,
 $p_{g}^{sat}=\textit{Hc}_g^{sat}$
, where
 $H$
is the Henry coefficient. Here,
 $\cos \theta _Y$
is eliminated, originating from a contact angle of 90 degrees.
To further construct the free energy landscape for the evolution of the surface bubble nucleation, (A7) can be integrated. By integrating (A7), we can obtain the free energy
 $\Delta {G}$
during the bubble nucleation process for the smooth surface and the gas-filled nanowell, as shown in figure 2(d,e). The drop in free energy before the local minimum in figure 2(e) is due to the fact that the gas in solution is supersaturated (
 $\xi =5$
). This local minimum also corresponds to the thermodynamically metastable surface nanobubble. Furthermore, the nucleation barrier
 $\Delta {G}^{\ast }$
(as indicated by the blue arrow in figure 2
d,e) for smooth surface and pre-captured gas in the nanowell can be derived as
 \begin{align}&\qquad\quad\,\, \Delta {G_{smooth}^{\ast }}=\frac {\gamma ^2D}{\Delta {p}^{\ast }}(\theta _Y+\cos \theta _Y\sin {\theta _Y}), \end{align}
 \begin{align}& \Delta {G_{well}^{\ast }}=\frac {\gamma ^2D}{\Delta {p}^{\ast }}\left(\theta _Y+\cos \theta _Y\sin {\theta _Y}-\theta _1-\frac {1}{2}\sin 2\theta _1\right), \end{align}
where
 $D$
is the thickness in the Y direction,
 $D = 4\sigma _0$
. The parameter
 $\theta _1$
is the connect angle of the bubble at the minimum of free energy as shown in figure 2(e) in the main text,
 $\sin \theta _1=L/2R_c=\xi p_g^{sat}L/2\gamma$
.
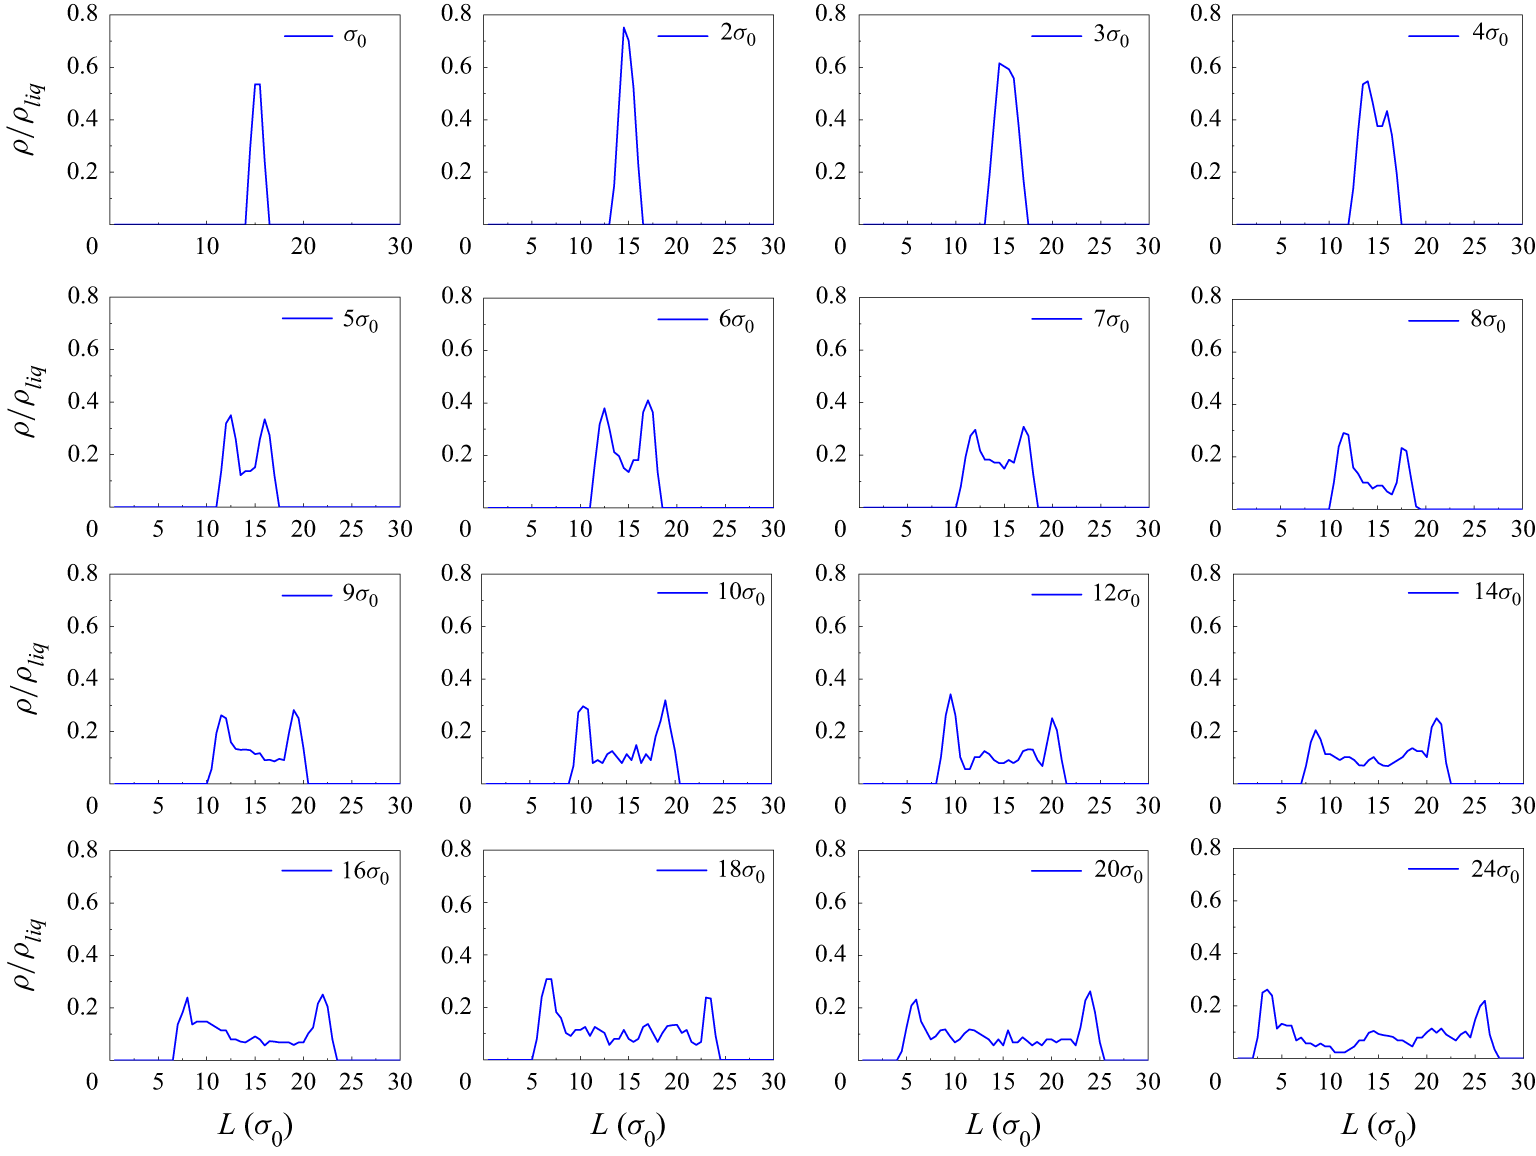
Statistical results of gas density
 $\rho$
in nanowells with variable widths
 $L$
.

Figure 7 shows the statistical results of the gas density in the nanowell with variable widths
 $L$
. The results show that the internal fluid is in a high-density state when
 $L \lt 4\sigma _0$
. In contrast, the density near the inner wall surface is greater than the density in the middle of the nanowell at
 $L \gt 4\sigma _0$
. The effective thickness of the interfacial layer,
 $\delta \approx 3\sigma _0$
, was statistically calculated from the peak width at half-height of the density distribution at the solid–gas interface.
A.3. Van der Waals fluid theory
To analyse the properties of the fluid in a small nanowell, we model it as a van der Waals (vdW) fluid, and this assumption is reasonable for the LJ fluid in our MD (Johnston Reference Johnston2014; Auti et al. Reference Auti, Paul, Hsu, Chiashi, Maruyama and Daiguji2024). In this way, the Helmholtz free energy of the fluid in the nanowell can be written as
 \begin{align}F&=F_{bulk}+F_{\textit{surf}}\nonumber\\&=-k_BT{\rm ln}Z_{bulk}+F_{\textit{surf}}\\ &=-Nk_BT\left[{\rm ln}\left(\frac {V-Nb}{\lambda ^3N}\right)+1\right]-\frac {N^2a}{V}+F_{\textit{surf}}, \nonumber\end{align}
where
 $Z_{bulk}$
is the canonical partition function; for a vdW fluid,
 $Z_{bulk}={1}/{N!}({V-Nb}/{\lambda ^3}\exp({-aN^2}/{Vk_BT}))$
(Auti et al. Reference Auti, Paul, Hsu, Chiashi, Maruyama and Daiguji2024),
 $\lambda$
is the thermal wavelength,
 $\lambda =({h^2}/{2\pi mk_BT})^{1/2}$
(
 $h$
is Planck’s constant and
 $m$
is the molecular mass),
 $a$
and
 $b$
are the vdW coefficients, which can be expressed as
 $a=({20\pi r_0^{3}\epsilon _{ij}}/{9\sqrt {2}})$
and
 $b=\sqrt {2}\sigma _0^3$
for LJ fluids (Johnston Reference Johnston2014). Here,
 $F_{\textit{surf}}$
represents the interface energy, including the interfacial energy between the inner wall and the fluid in the nanowell and the interfacial energy of the gas–liquid interfaces of fluids inside and outside the nanowell,
 $N$
is the number of molecules in the nanowell and
 $V$
is the volume of the nanowell. According to the definition of chemical potential, the chemical potential of bulk fluids can be written as
 \begin{equation} \mu _{bulk}=\left(\frac {\partial {F}_{bulk}}{\partial {N}}\right)_{V,T}=-k_BT\left[{\rm ln}\left(\frac {V-Nb}{\lambda ^3N}\right)+1\right]+\frac {NVk_BT}{V-Nb}-\frac {2Na}{V} .\end{equation}
Correspondingly, the grand potential
 $\Omega$
of fluid inside the nanowell can be calculated as
 \begin{equation} \Omega =F-N\mu _{bulk}+F_{\textit{surf}}=-\frac {k_BTN}{V\rho b}-N\rho a+F_{\textit{surf}}, \end{equation}
where
 $\rho =N/V$
is the density of fluid in nanowell.
A.4. Statistical mechanics for small systems
Statistical mechanics is applicable for analysing the interfacial energy
 $F_{\textit{surf}}$
. For the small system, the influence of the solid wall on the fluid inside the nanowell becomes increasingly significant as
 $L$
decreases (Hill Reference Hill1962, Reference Hill1994; Qian Reference Qian2012). Based on previous studies (Dong Reference Dong2021, Reference Dong2023), statistical mechanic calculations are performed for an ideal fluid confined in a small nanowell. This assumption of an ideal gas is made not only to simplify the calculations but also because the free energy of the bulk phase fluid has already been considered in (3.5). So, only the interaction energy needs to be considered here. The interaction potential between the fluid particle and nanowell walls is equated through a simplified square-well potential, i.e.
 \begin{equation} V(r_i)=\begin{cases} \infty & r_i\lt 0, \\ -\epsilon & 0\lt r_i\lt r_c, \\ 0 & r_i\gt r_c, \end{cases} \end{equation}
where
 $\epsilon$
and
 $r_c$
are, respectively, the depth and the interaction range of the potential well, and
 $r_i$
is the z-coordinate of the
 $i$
th fluid particle. The value of
 $\epsilon$
can be positive (attractive fluid–solid interaction) or negative (repulsive fluid–solid interaction). In the calculation,
 $\epsilon$
is averaged over the thickness of the interface
 $r_c$
,
 $\epsilon =({1}/{r_c})\int\epsilon(r) dr$
. Depending on the relative sizes of
 $r_c$
and
 $L$
, the calculation can be presented below in two parts: (i) weakly confined situations, i.e.
 $L\gt 2r_c$
; (ii) strongly confined situations, i.e.
 $L\lt r_c$
.
A.4.1. Weakly confined situation (
 $L\gt 2r_c$
)

Schematic presentation of a model with a nanowell of volume
 $V$
(surface regions in red) and an explicit particle reservoir of volume
 $V_R$
. The fluid particles in the red zones interact with the nanowell walls through a square-well potential of range
 $r_c$
.

We consider a composed system depicted in figure 8, which is at a given temperature
 $T$
with a fixed volume
 $V_R$
for the reservoir and fixed
 $V$
for the nanowell (
 $V_T=V+V_R$
is obviously fixed). Due to the exchange of particles (molecular) between the nanowell and the reservoir, the gas molecular numbers in them fluctuate (
 $N$
: fluid molecular number in the nanowell;
 $N_R$
: fluid molecular number in the reservoir) while
 $N_T=N+N_R$
is fixed. So, the composed system should be described with a canonical ensemble, and its partition function is given by Dong (Reference Dong2021)
 \begin{equation} Z_T=\frac {1}{\lambda ^{3N_T}N_T!}\Sigma \frac {N_T}{N!N_R!}\int _V {\textrm d}r\big(e^{-\beta V(r)}\big)^N\int _{V_R}{\textrm d}r\big(e^{-\beta V(r)}\big)^{N_R} ,\end{equation}
where
 $\lambda$
is the thermal wavelength,
 $\beta =1/k_BT$
(
 $k_B$
: Boltzmann constant),
 ${\textrm d}r$
denotes collectively the integration elements for the confined-fluid molecules and
 ${\textrm d}r\ldots ^{N_R}$
denotes the integration elements for the fluid particles in the reservoir. The nanowell–reservoir fluid molecular exchange is taken into account in (A14) by the summation over
 $N$
. The integration and the summation on the right-hand side of (A14) can be carried out exactly, and we obtain the following analytical result:
 \begin{equation} Z_T=\frac {1}{\lambda ^{3N_T}N_T!}\left[V+V_R+2r_cA(e^{\beta \epsilon }-1)\right] ,\end{equation}
where
 $A$
is the area of one side nanowell surface.
Based on (A15), the average molecular number in the nanowell can be calculated as
 \begin{equation} \langle N\rangle =N_T-\langle N_R\rangle =\frac {N_T\left[V+2r_cA(e^{\beta \epsilon }-1)\right]}{V+2r_cA(e^{\beta \epsilon }-1)+V_R} .\end{equation}
Further, we readily obtain the following results for the Helmholtz free energy of the fluid in the nanowell:
 \begin{equation} \beta F=\langle N\rangle {\rm ln}\lambda ^3+\langle N\rangle {\rm ln}\langle N\rangle -\langle N\rangle -\langle N\rangle {\rm ln}\left[V+2r_cA(e^{\beta \epsilon }-1)\right] .\end{equation}
According to Stirling’s approximation,
 ${\rm ln} n!=n{\rm ln}-n$
 $( n\gg 1)$
, Helmholtz free energy
 $F$
can be obtained as the result in (A17). With a 2-D nanowell model or very deep nanowells, we aim at mimicking a rough electrode interface, e.g. some nanoporous electrode. For such an interface, the spacing between the inner walls of the nanowells is at the nanoscale, while the size in traverse or vertical directions can be much larger; hence,
 $N\gg 1$
holds when
 $\sqrt {A}\gg L$
, and under this condition we can still treat this system mathematically.
Based on (A17), the chemical potentials in the nanowell can be written as
 \begin{equation} \beta \mu=\left [\frac {\partial (\beta F)}{\partial \langle N\rangle }\right ]_ {T, V}={\rm ln}\frac {\lambda ^3N_T}{V+2r_cA(e^{\beta \epsilon }-1)+V_R} .\end{equation}
The chemical potentials everywhere in the composed system are equal due to the exchange of fluid molecules between the nanowell and the reservoir.
For the isochemical potential ensemble, the grand potentials of the system can be read as
 \begin{equation} \beta \Omega (\mu ,T,V,A)=\beta (F-\langle N\rangle \mu )=-\frac {e^{\beta \mu }}{\lambda ^3}\left[V+2r_cA(e^{\beta \epsilon }-1)\right] .\end{equation}
Similarly, the pressure is given by
 \begin{equation} \beta p=-\left [\frac {\partial (\beta \Omega )}{\partial V}\right ]_{\mu ,T,A}=\frac {e^{\beta \mu }}{\lambda ^3} ,\end{equation}
where
 $p$
is equal to the pressure of the bulk fluid in the reservoir.
So the interfacial energy
 $F_{\textit{surf}}^{f-w}$
between the fluid in the nanowell and the inner wall can be calculated as
 \begin{equation} F_{\textit{surf}}^{f-w}= \Omega - \Omega _{bulk}= \Omega -(-pV)=-\frac {2r_cAe^{\beta \mu }(e^{\beta \epsilon }-1)}{\beta \lambda ^3} .\end{equation}
A.4.2. Strongly confined situation (
$r_c\lt L\lt 2r_c)$

For strongly confined situations, i.e.
 $r_c\lt L\lt 2r_c$
, the more complicated partition function (Dong Reference Dong2021) can be expressed as
 \begin{equation} Z_T=\frac {1}{\lambda ^{3N_T}N_T!}\left \{Ve^{\beta \epsilon }\left [1+\left (\frac {2r_c}{L}-1\right )(e^{\beta \epsilon }-1)\right]+V_R\right \} .\end{equation}
The average particle number in a nanowell can be obtained
 \begin{equation} \langle N\rangle =N_T-\langle N_R\rangle =\frac {N_TVe^{\beta \epsilon }\left [1+\left (\frac {2r_c}{L}-1\right )(e^{\beta \epsilon }-1)\right ]}{Ve^{\beta \epsilon }\left [1+\left (\frac {2r_c}{L}-1\right )(e^{\beta \epsilon }-1)\right ]+V_R} .\end{equation}
We readily obtain the following results for the Helmholtz free energies of the nanowell:
 \begin{equation} \beta F=\langle N\rangle {\rm ln}\lambda ^3+\langle N\rangle {\rm ln}\langle N\rangle -\langle N\rangle -\langle N\rangle {\rm ln}\left \{Ve^{\beta \epsilon }\left [1+\left (\frac {2r_c}{L}-1\right )(e^{\beta \epsilon }-1)\right]+V_R\right \} .\end{equation}
The chemical potentials in the nanowell can be straightforward to check
 \begin{equation} \beta \mu =\left [\frac {\partial (\beta F)}{\partial \langle N\rangle }\right ]_{T,V}={\rm ln}\frac {\lambda ^3N_T}{Ve^{\beta \epsilon }\left [1+\left (\frac {2r_c}{L}-1\right )(e^{\beta \epsilon }-1)\right ]+V_R} .\end{equation}
The chemical potential will be consistent everywhere in the composed system due to the chemical equilibrium established by exchanging fluid particles between the nanowell and the reservoir.
Accordingly, for the isochemical potential ensemble, the grand potentials of the system can be read as
 \begin{equation} \beta \Omega (\mu ,T,V,A)=\beta (F-\langle N\rangle \mu )=-\frac {e^{\beta \mu }}{\lambda ^3}V\left [1+\left (\frac {2r_c}{L}-1\right )(e^{\beta \epsilon }-1)\right] .\end{equation}
The pressures are given by
 \begin{equation} \beta p=-\left [\frac {\partial (\beta \Omega )}{\partial V}\right ]_{\mu ,T,A}=\frac {e^{\beta (\mu +\epsilon )}}{\lambda ^3}(2-e^{\beta \epsilon}) .\end{equation}
It should be noted that pressure depends only on
 $\mu$
and
 $T$
.
So the interfacial energy
 $F_{\textit{surf}}^{f-w}$
between the fluid in the nanowell and the inner wall can be calculated as
 \begin{equation} F_{\textit{surf}}^{f-w}=\Omega -\Omega _{bulk}=\Omega -(-pV)=-\frac {Ve^{\beta \mu }(e^{\beta \epsilon }-1)}{\beta \lambda ^3}\left [1+\left (\frac {2r_c}{L}-1\right )e^{\beta \epsilon }\right ] .\end{equation}
For the interfacial energy
 $F_{\textit{surf}}^{f-l}$
from the density difference between the fluid inside the nanowell and the liquid outside the nanowell, assuming a linear dependence
 $\gamma _{f-l}$
on density
 $\rho$
(Abyzov, Schmelzer & Davydov Reference Abyzov, Schmelzer and Davydov2017; Zhang, Chen & Zhang Reference Zhang, Chen, Zhang and Doi2022),
 $F_{\textit{surf}}^{f-l}$
can be read as
 \begin{align} \nonumber\\[-20pt]F_{\textit{surf}}^{f-l}=L{\textrm d}\gamma \left(1-\frac {\rho }{\rho _{liq}}\right),\end{align}
where
 $\gamma$
is the surface tension of the gas–liquid interface,
 $\rho _{liq}$
is the density of the surrounding liquid phase under external pressure,
 $\rho _{liq}=0.71 \sigma _0^{-3}$
.
Based on the above results, the interfacial energy
 $F_{\textit{surf}}$
can be calculated by summing
 $F_{\textit{surf}}^{f-w}$
and
 $F_{\textit{surf}}^{f-l}$
with different chemical potentials
 $\mu$
at different
 $L$
 \begin{align} \nonumber\\[-13pt]F_{\textit{surf}}&=F_{\textit{surf}}^{f-w}+F_{\textit{surf}}^{f-l}\nonumber\\&=\begin{cases} -\frac {2Ar_ce^{\beta \mu }(e^{\beta \epsilon }-1)}{\beta \lambda ^3}+L{\textrm d}\gamma \left(1-\frac {\rho }{\rho _{liq}}\right) & L\gt 2r_c, \\[5pt] -\frac {Ve^{\beta \mu }(e^{\beta \epsilon }-1)}{\beta \lambda ^3} \left[1+\left(\frac {2r_c }{L}-1\right)e^{\beta \epsilon }\right]+L{\textrm d}\gamma \left(1-\frac {\rho }{\rho _{liq}}\right) & r_c\lt L\lt 2r_c. \end{cases}\\[-13pt]\nonumber \end{align}
The first term represents the effect of the inner wall on the fluid inside the nanowell, whose weight increases rapidly at small scales (Dong Reference Dong2021, Reference Dong2023; Zhang et al. Reference Zhang, Guo, Frenkel, Dobnikar and Zhang2024a ). The second term represents the interfacial energy of the fluid inside and outside the nanowell due to the density difference.