


Introduction
Thermal conductivity measurements in solids at low temperatures can give information about defects in the crystalline structure as shown by Reference KlemensKlemens (1958) and Reference CarruthersCarruthers (1961). In particular such measurements on single crystals of ice can tell us about the influence of ihermal or mechanical treatment on defects in the ice lattice. In this way it will be possible to standardize ice samples studied in laboratories. Such a standardization does not exist hitherto but is necessary in order to obtain more reproducible results in many domains of ice physics. Thus thermal conductivity measurements at very low temperatures can provide interesting information for glaciologists even though such temperatures are not found in natural ice sheets.
Experimental Procedure
We use single crystals grown by a modified Bridgman method as described by Reference BlicksBlicks (unpublished). A cylindrical teflon (polytetrafluorethylene) or plexiglas (polymcthyl-methacrylate) vessel is filled with water. The water we use is demineralized and double-distilled under a nitrogen atmosphere in quartz vessels. We fix a seed crystal at the bottom of the crystallization vessel and lower this device at a rate of 1.2 cm a day into a bath of cold ethanol at 248 K.
Activation analyses by Mme Echevin from the Laboratoire de Glaciologie at Grenoble showed the following concentrations of impurities present in a crystal grown in a teflon vessel:
Mg: (0.156±0.006) mg/kg,
Gl: (0.214±0.004) mg/kg,
Mn: (0.001 23±0.000 01) mg/kg,
Na: (0.027 1±0.000 3) mg/kg.
Analyses with a mass spectrometer by Mme Merlivat from the Centre d’Études Nucléaires at Saclay showed that the average concentration of deuterium in the same crystal is 142.2 ± 0.05) mg/kg.
Thermal conductivity measurements have been done using the stationary heat-flow method. A known heating power P goes through the sample. Knowing the length ΔX and the cross-section of the sample S we can determine the thermal conductivity λ using Fourier’s law:

where T 2 − T 1 is the temperature difference between the ends of the sample.
The mean temperature of the sample can be chosen by means of a thermal resistance between the sample and the cryogenic bath and a second heating device.
The main difficulties of heat-conduction measurements on ice at low temperatures are the sample mounting and cooling down to liquid-nitrogen temperature, since ice samples are very fragile, and the thermal expansion coefficient is very different for ice and copper (we used a copper sample holder). We covered our samples with a film of Apiezon C oil in order to avoid thermal cracking. In this way we were able to measure thermal conductivities between 1.7 K and 160 K. The rate of cooling from the mounting temperature (≈ 260 K) to liquid-nitrogen temperature was 0.6 K/min (exceptionally 1.2 K/min).
Experimental error on the absolute value of the thermal conductivity was lower than 15% from 1.7 to 7 K and lower than 12% for higher temperatures. As the calibration error of the thermometer was 3% the relative error between independent curves of thermal conductivity was 9 to 12%. Within one curve wc can disregard the error on the dimension of the sample so that the relative error within one curve is lower than 7%.
The sample mean temperature could be measured with an error lower than 4%, arising mainly from thermometer calibration.
When the crystallographic orientation of the sample is not mentioned the heat flux was parallel to the c-axis.
Results
Figure 1 to 5 show results on thermal conductivity measurements on samples of pure ice.
In Figure 1 we compare the heat-conduction curves of two identical ice samples cut from the centre of the same crystal grown in a teflon vessel. The results of former authors found in the literature are indicated too. Reference LeesLees (1905), Reference Jakob and ErkJakob and Erk (1929), Reference PowellPowell (1958), Reference Dean and TimmerhausDean and Timmerhaus (1962), Reference RatcliffeRatcliffe (1962), and Reference Dillard and TimmerhausDillard and Timmerhaus (1965) give little information about the crystals used, but their method of sample preparation leads to the conclusion that they measured polycrystals. Reference Landauer and PlumbLandauer and Plumb (1956) used single crystals. It is not quite clear whether Reference AshworthAshworth (unpublished) used single crystals.
Heat-conduclion curves of identical samples cut from one crystal grown in a teflon vessel [this work) compared the results of former authors. Solid curves correspond to computer fits using the following parameters: lowest curve: G d = 2.67 × 10 −30 s 2, R = 3; middle curve: G d = 2.18 × 10 −30 s 2, R = 3; “ideal” curve: G d = 0, R = 0.
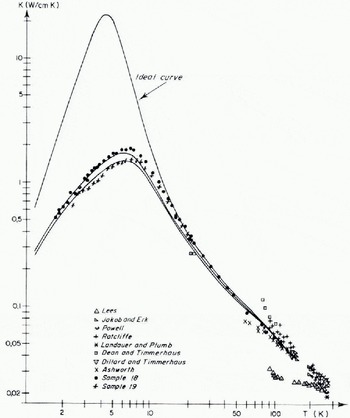
The solid curves correspond to computer fits discussed later. Near the maximum (T ≈ K) the difference between the conductivity values of sample 18 and 19 is about 15%. This difference decreases for lower temperatures. For temperatures higher than 16 K, curves 18 and 19 are identical and can be extrapolated to temperatures higher than 100 K using the points of Reference Dillard and TimmerhausDillard and Timmerhaus (1965), Reference Jakob and ErkJakob and Erk (1929), and Reference AshworthAshworth (1972).
Figure 2 shows the heat-conduction curve of a sample grown in a plexiglas vessel (sample 21, white points), compared with a sample grown in a teflon vessel (sample 18, black points). The maximum is lower for the first one. The two curves are identical for temperatures higher than 10 K.
Figure 3 shows the heat-conduction curve of a sample cut parallel to the c-axis (sample 21, white points) compared with the curves of samples cut perpendicular to the c-axis (sample 5, St Andrew’s cross; sample 6, black points; sample 7, triangles). All these samples have been grown in plexiglas vessels. To the right of the maximum there is no visible anisotropy. It is not possible to confirm or to refute the anisotropy of 5% found by Reference Landauer and PlumbLandauer and Plumb (1056) at 268 K as our measurements do not cover this temperature.
Heat-conduction curves of samples grown in different vessels. Lower curve: sample grown in a plexiglas vessel; higher curve: sample grown in a teflon vessel. Solid lines correspond to computer fits: lower line: G d = 6.4 × 10 −18 s, R = 2; “ideal” curve: G d = 0, R = 0,

Heat-conduction curves of samples with different orientations. Samples were grown in plexiglas vessels.

Influence of ageing on otherwise identical samples cut from one crystal grown in a teflon vessel. Lower curve: aged sample; higher curve: fresh sample.

Influence of cooling rate and annealing an a sample grown in a plexiglas vessel. Lowest curve: sample cooled al 1.2 K/min; middle curves: same sample after annealing and cooling at o.6 K/min; highest curve: freshly grown sample 18 grown in a teflon vessel cooled 0.6 K/min.
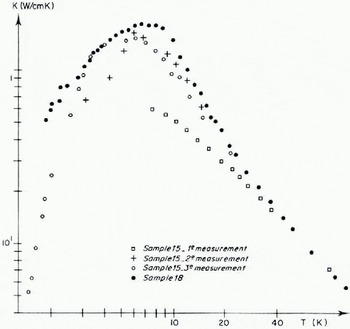
Figure 4 shows the influence of ageing: two samples cut from the centre of the same crystal grown in a teflon vessel have been measured. One has been measured immediately after growth (sample 18), the other after ageing (sample 20) during nine months at 248±5 K. Low- and high-temperature parts of the curves are identical. For temperatures close to the maximum, on the right side, the heaf conduction is lower for the aged crystal.
Superposition of the heat-conduction curves of sample 15 {third measurement annealed after rapid cooling) and sample 20 (aged). The solid curves corresponds to computer fits: lower curve: G d = 2.34 × 10 −30 s2 R = 3; “ideal” curve: G d = 0, R = 0.
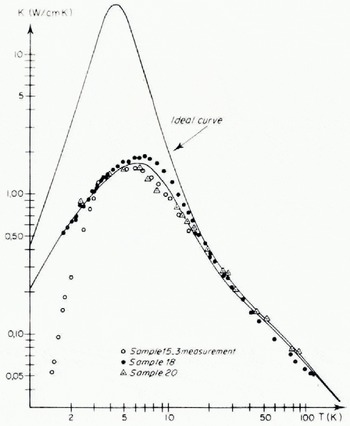
Figure 5 shows the influence of the cooling rale on a sample grown in a plexiglas vessel (sample 15). The heat conduction curve of a sample cooled with a rate of 1.2 K/min is very much lower than the curve of a fresh sample cooled at 0.6 K/min. After annealing of about one month at 271 ± 0.5 K the second conductivity curve is higher. After another annealing of one year at 248±5 K the high-temperature part of the heat-conduction curve is identical to the preceeding one. For temperatures higher than 3 K the curve is identical to these of a crystal grown in a teflon vessel and aged for nine months (sample 20, sec Figure 6). The heat conduction in the low-temperature region falls very steeply (∝ T 5).
Qualitatively we can conclude the following:
The heat conduction curves presented in this work are identical for temperatures higher than 16 K.
The heat conduction curves presented in this work have a maximum near 7 K.
For temperatures lower than 16 K each sample has its individual heat conduction curve.
We conclude that the temperature range > 16 K should be the “intrinsic” range where the thermal resistance is due to three phonon processes of the umklapp type (Reference CarruthersCarruthers, 1961). The range > 16 K should be the “extrinsic” range where interactions of phonons with lattice imperfections are the dominant resistive mechanisms.
Theory of heat conduction
If we consider the phonon gas in a crystal as an ideal gas we may describe the thermal conductivity by means of the elementary relation:

where L is the phonon mean free path, υ the mean velocity of sound, c υ the specific heat capacity and ρ the density.
If we define a relaxation time τ, this equation may be rewritten:

By using Debye’s approximation for the specific heat we obtain:

where x = ħω/kT, k is Boltzmann’s constant, 2π?? is Planck’s constant, and Θ is the Debye temperature.
The total relaxation time is calculated by using the equation

Where the τ i are the relaxation times corresponding to different phonon interaction mechanisms. Reference CallawayCallaway (1959) includes the relaxation time of normal processes in the total relaxation time τ. As the normal processes are not really resistive but contribute to resistive processes only by a redistribution of energy, we have to add a correction term to λ1 so that

Nevertheless, as Reference Klinger, Whalley, Whalley, Jones and GoldKlinger (1973) pointed out this correction can be disregarded and we can take λ = λ1. A detailed discussion of the choice for the τ i is given by Reference KlingerKlinger (unpublished).
In this work we use only the following expressions:
-
(1) For umklapp processes:
(7)
*There is an error in the paper Reference Klinger, Whalley, Whalley, Jones and GoldKlinger (1973). The coefficient before the integral should read
-
(2) For scattering on the boundaries of the sample (Reference CasimirCasimir, 1938):
where C is a constant.(8) -
(3) For scattering on point defects, dislocations and microstructures (Reference KlemensKlemens, 1958):
with R = 1, 2, 3 or 4.(9)


According to Reference KlemensKlemens (1958), R = 1 corresponds to interactions of phonons with single dislocations. If there are platelets or dislocation loops inserted in an otherwise continuous structure R = 2. In the case of interactions of phonons with long cylinders inserted into an otherwise continuous structure R = 3. The interactions of phonons with point defects are described by a term with R = 4.
Fits of the Experimental Results
We fit the intrinsic part of our experimental results by using the parameters already published by Reference Klinger, Whalley, Whalley, Jones and GoldKlinger (1973,unpublished):
υ = 2.5 × 105 cm/s,
Θ = 226 K,
β = 6.5,
B μ = 1.75 × 10⁻¹⁷ s K−1.
If we limit the phonon mean free path to the size of the macroscopic sample which corresponds to a “Casimir term”, C = 4.5 × 10⁵ 5−1, we obtain the ideal curve shown in Figures 1, 2 and 6.
In order to fit the extrinsic part of the experimental results we introduce one and only one defect term. It is obvious that it is not possible to give a detailed description of all interaction mechanisms in the real crystal by using this method, but we can see whether there exists a mechanism which is largely dominant. This should be the case when one type of defect term (one value of R) gives a fit of our experimental results within the limits of the estimated maximum error of our measurements and all the other possible types of defect terms (all the other possible values of R) do not.
As we consider as “best fit” that giving the lowest mean error, the parameters used could be slightly different from the case where all interaction mechanisms are taken into account.
This is particularly evident when a part of the experimental curve is systematically higher than the calculated curve. It is a fact that all real crystals contain some point defects (isotopic defects, voids, etc.). So a good fit with only one parameter should always be somewhat higher than the experimental points in the vicinity of the maximum. The influence of the presence of point defects is discussed by Reference KlingerKlinger (unpublished). In that paper it is also shown that it is impossible to obtain acceptable fits for our experimental results by using a point-defect term (R = 4) without using a second defect term. As it is possible to fit all experimental curves presented in this paper in the limits of the estimated maximum experimental error with only one defect term (containing ω2 or ω3) it seems meaningless to refine the model.
The heat conduction curves of samples 18 and 19 grown in a teflon vessel can be filled with ω3; nevertheless the calculated curves are slightly lower than the experimental curve near the maximum (solid curves in Figure 1).
The heat conduction curve of sample 21 grown in a plexiglas vessel can be fitted with a term proportional to ω2 (Fig. 2).
The heat conduction curve of sample 20 grown in a teflon vessel and aged for 9 months and the curve corresponding to sample 15 grown in a plexiglas vessel which had been cooled at 1.2 deg min−1 and annealed for 12 months are the same for temperatures higher than 3 K.
So we fitted the common part of them with a term in ω3. In this case the experimental curve is slightly lower than the theoretical curve (Fig. 6).
The parameters used in our fits are given in the following table:

Discussion
According to Reference KlemensKlemens (1958) we should have predominance of cylindrical defects in crystals grown in teflon vessels. In the case of crystals grown in plexiglas vessels the interaction of the phonons with cylindrical defects seems to be masked by the interaction with disc-shaped defects becoming the predominant mechanism.
In the first case the coefficient G d can be expressed as a function of the number of defects:

where N d is the number of defects per unit area in the basal plane, a the lattice constant and υ the velocity of sound.
Using our phenomenological value for G d we can determine the mean distance between defects as

we find D ≈ 200 Å.
The fact that Reference Davy and BrantonDavy and Branton (1970) saw cylindrical blocks about 300 Å in size on replicas of ice grown by a different method, indicates that such a cylindrical microstructure should exist in ice from different origins.
The case of parallel disc-shaped defects perpendicular to the heat flux has been treated by Reference KlemensKlemens (1958) and Reference Turk and KlemensTurk and Klemens (1974). For this case Reference KlemensKlemens (1958) gives an expression for G d:

where γ is Grüneisen’s constant and N s is the number of platelets per unit area; with an estimated Grüneisen constant of 0.65, a mean distance between the platelets of about 2 μm is found.
Reference TrubyTruby (1955) studied replicas of etched and nascent surfaces of single ice crystals by electron microscopy. He found a characteristic microstructure of elongated, hexagonal prisms. The small hexagonal units varied greatly in size with an expected width of the order of 3 μm and a length of 6 μm. Truby’s results have been confirmed recently by Reference OdencrantzOdencrantz (1973).
2 μm is a good order of magnitude if we suppose that platelets parallel to the basal plane are inserted between the above-mentioned microblocks. The fact that Truby gives a mean value of the length of his prisms three times larger than our distance between the platelets can be attributed to the fact that his crystals were not grown in the same conditions as ours and his mean value is deduced from a limited number of observations. Our value should be the average distance between platelets “seen” by the phonons of the crystal and in this way should be the mean value taken over the whole crystal. As the platelets are supposed to be all parallel to the basal plane, and, as Reference Turk and KlemensTurk and Klemens (1974) explain, the interaction of platelets parallel to the heat flux with the phonons should be negligible, an anisotropy of the heat conduction should occur. As Reference CarruthersKlinger (unpublished) showed, the difference between two interaction mechanisms (R = 1, 2, 3) is important only at the low-temperature side of the heat-conduction maximum (for temperatures lower than about 7 K.). Until now no measurements have been done in this temperature range on samples cut perpendicular to the c-axis.
Reference Gentile and Drost-HansenGentile and Drost-Hansen (1956) explain the formation of the microblocks seen by Reference TrubyTruby (1955) by a multiplicaton of dislocation rings by a Frank–Read mechanism followed by a polygonization of the whole crystal. If an equivalent mechanism exists for the sub-microstructure seen by Reference Davy and BrantonDavy and Branton (1970) we could explain why the fit of our experimental curves proportional to ω3 is better for an aged crystal. The polygonization of the crystal is not perfect in a fresh crystal; some dislocation loops persist. In an aged crystal the complete polygonization is achieved.
We found two possible hypotheses to explain the higher concentration of disc-shaped defects in crystals grown in plexiglas vessels:
-
(I) It could be a mechanical effect: the crystal is grown by lowering the crystallization vessel into a cooling bath of about 248 K. In this way the crystal is cooled down slowly from 273 K at the growing surface to the temperature of the bath. According to Reference Eisenberg and KauzmannEisenberg and Kauzmann (1969) the linear heat explansion coefficient of ice is 46 × 10−6 K−1. The manufacturer of the plexiglas, Röhm G.m.b.H., gives a linear heat expansion coefficient of 70 × 10−6 K−1. The manufacturer of the teflon, Pampus Fluorplast S.A. Sartrouville indicates an expansion coefficient of 123 × 10−6 K−1. Reference Zarembovitch and KahaneZarembovitch and Kahane (1964) measured the elastic stiffness C 33 of ice. They found C 33 = 1.498 × 10⁵ N/cm2 at 257 K.
The elastic stiffness of plexiglas and teflon are given by the manufacturers as 330 000 N/s cm2 and 68 000 N/cm2. Plexiglas and teflon contract more rapidly during cooling than does ice. The radial stress introduced by thermal contraction applied perpendicular to the c-axis (which is parallel to the symmetry axis of the cylindrical growth vessels and in this way to the growth direction) could explain the formation of dislocation loops or disc-shaped voids in the basal plane. An estimate of the stress introduced in this way using the constants cited above and the dimensions of our vessels (diameter 6 cm, thickness 0.4 cm for teflon vessels, diameter 8 cm, thickness 0.2 cm for plexiglas vessels) shows however that the stress is about two times higher for teflon (≈ 2 N/cm2 for teflon and ≈ 1 N/cm2 for plexiglas). So it is not possible to explain the higher concentration of disc-shaped defects in crystals grown in plexiglas vessels in this way.
-
As plexiglas and teflon are different compounds from a chemical point of view it is not impossible that in the case of plexiglas some impurities which do not fit the crystalline structure of ice are dissolved in the water and trapped in the crystal during growth where
they could form disc-shaped inclusions.
More detailed work has to be done in order to clarify this point especially as until now we have not been able to do chemical analyses on crystals grown in plexiglas vessels.
A model proposed by D. Helmreich and W. Steinicke (private communication) can explain the influence of the cooling rate. They observed that the number of Tyndall flowers was higher in crystals that had been cooled down to liquid-nitrogen temperature compared with crystals conserved at −20° C. They explain this by an increase of the number of nucleation centres by the following mechanism:
During the cooling voids can migrate and be attracted by dislocations. The voids unite themselves into cavities in order to diminish their surface energy. The decrease of the thermal conductivity after a fast cooling could proceed from such a mechanism. During the tempering big cavities should increase their volume by absorbing small cavities (in tempered crystals the number of Tyndall flower decreases). The heat conduction curve for the annealed sample is identical to the curve for a crystal grown in a teflon vessel and annealed during 9 months at temperatures higher than 3 K.
At temperatures lower than 3 K the heat-conduction curve of the sample made in a plexiglas vessel and cooled rapidly (sample 15, third measurement) falls very steeply with temperature. The existence of large cavities or precipitates of impurities may explain this as shown by Reference NeumaierNeumaier (unpublished). This could be explained by the fact that voids or, eventually, impurities present in a crystal grown in a plexiglas vessel could have concentrated in a small number of big perturbed zones. In order to estimate the mean size of those zones, measurements of tbe heat conduction at still lower temperatures are necessary.
Let us summarize our conclusions:
-
(1) A pure single crystals of ice Ih in its stable slate seems to be built up by a hexagonal microstructure some micrometres in width and a sub-microstructure of some hundred of Ångströms in width. The length of those microblocks or sub-microblocks in the direction of the c-axis should be, according to electron micrographs done by Reference TrubyTruby (1955) and Reference Davy and BrantonDavy and Branton (1970), about twice the width.
-
(2) As the length of the mentioned microblocks or sub-microblocks is about twice the width we can consider them approximately as “long cylinders” and apply the mechanism of phonon interaction with the kind of defects described by Reference KlemensKlemens (1958). If this mechanism of interaction gives rise to an anisotropy of heat conduction this effect should occur at very low temperatures (at temperatures lower than the temperature where the heat-conduction maximum occurs) where hitherto no heat-conduction data perpendicular to the c-axis are available.
-
(3) When the crystallization vessel is changed (plexiglas instead of teflon) the interaction of phonons with disc-shaped defects becomes predominant.
-
(4) If such a crystal has been cooled from 258 K to liquid-nitrogen temperature at a rate of about 1.2 K/min and then warmed up at about the same rate and annealed for several months near the freezing point, the above-mentioned disc-shaped inclusions condense into large perturbed centres. The crystal around these centres acquires the same characteristics as the crystals mentioned under (1).
A Procedure to Obtain Perfect Crystals
This work offers the possibility for the standardization of ice samples studied in laboratories. In fact the heat-conduction curve is an excellent indicator of crystal perfection. As it is difficult to make heat-conduction measurements, we propose a “quality list” for the growth and handling of artificial ice crystals. To begin with we could take as a basis the following:
-
(1) Water. Demineralized and double distilled in quartz vessels under nitrogen atmosphere, the crystallizer being filled without contact with ambient air.
-
(2) Growth. In a cylindrical teflon vessel of diameter 50 mm or larger by the Bridgman method, growth rate ≼1.2 cm/d or lower.
-
(3) Ageing. Nine months at least at a temperature between −25 and 0° C.
-
(4) Cutting. On a microtome with an advance ≼0.05 mm per layer.
-
(5) Cooling and heating rates. ≼0.6 deg/min.
We think that such a crystal represents the stable form of a pure Ih ice single crystal. This “quality list” can be modified when sufficient heat conduction data are available for other types of crystals, especially zone-refined crystals and natural crystals.
Acknowledgements
Discussions with Dr A. M. de Goer from the Service des Basses Températures du Centre d’Études Nucléaires de Grenoble and with Professor L. Lliboutry, Director of the Laboratoire de Glaciologie in Grenoble are gratefully acknowledged. The author is greatly indebted to Mme Echevin from the Laboratoire de Glaciologie for chemical analyses and to Mme Merlivat from the Centre d’Études Nucléaires de Saclay for analysis of the isotopic impurities in ice samples.



