I. INTRODUCTION
In recent years, many techniques have been developed for the bottom-up synthesis of nanoparticles and nanowires that are based either on chemical or physical processes. These nanostructures can have potential application in new nanoelectronic, nanophotonic, and nanosensor devices. Despite the progress in methods for growing these low dimensional structures, advancement concerning their controlled placement into specific substrate positions remains quite a challenging task. Any progress achieved along the above lines would enable the exploitation of these nanostructures for the realization of devices and systems using batch manufacturing of high yield technologies.
Different approaches have been followed for the precise placement of nanoparticles on exact substrate locations. KohReference Koh1 reviews in detail the strategies followed to achieve this goal. These are either based on template-assisted deposition of nanoparticles combined with block copolymer nanostructuresReference Chai, Wang, Fan and Buriak2 or on local generation of charge on the substrate using an electron beam,Reference Joo, Moon and Jacobson3 an atomic force microscope (AFM) probe,Reference Mesquida and Stemmer4 or nanoxerographyReference Barry, Steward, Lwin and Jacobs5 to attract charged nanoparticles. Other researchers exploit the self-focusing effects of charged aerosol nanoparticlesReference Kim, Kim, Yang, Suh, Kim, Han, Kim, Kim, Pikhitsk and Choi6 and dielectrophoresisReference Hermanson, Lumsdon, Williams, Kaler and Velev7 to achieve selective placement.
More recently, charge effects have also been investigated for placing individual nanoparticles at the center of a pattern that is exposed to an e-beam in its outside area.Reference Huang, Bhadrachalam, Ray and Koh8 Oates et al.Reference Oates, Keller, Noda and Facsko9 reported a method for self-organizing metallic nanoparticle and nanowire arrays from ion sputtered silicon templates, while Hsu et al.Reference Hsu, Wu, Yen, Wong, Lin and Lin10 reported an electronically self-patterned template fabrication process for the guided growth of nanomaterials or chemical molecules placed in order. Also, Krishnan et al.Reference Krishnan, Petrasek, Monch and Schwille11 introduced a method for electrostatic self-assembly of charged colloids and macromolecules at the step edges of a patterned SiO2 layer in a fluidic nanoslit.
From the techniques reported, it is concluded that for the organization of nanoparticles into ordered arrays, electrical, chemical, or physical preformed patterns on the substrate are of critical importance. In order to reach nanometer placement accuracy of nanoparticle assembly, rather expensive or complicated patterning techniques or specialized equipment are then required.
In this paper, we report a method for self-assembly of nanoparticles into nanowires. The nanoparticles were fabricated by a DC magnetron sputtering system, and most of them are negatively charged during the sputtering process.Reference Kean and Allers12–Reference Aliat, Tsai, Hung and Wu15 This nanoparticle source can be used to fabricate any metallic or semiconducting (Si or Ge) nanoparticles, while nickel was chosen here to demonstrate the principle of the method. Self-assembled templates were fabricated by a fracture-induced patterning process, which is a simple and low cost maskless lithographic technique capable of producing photoresist lines with a peak and valley pattern.Reference Chai16–Reference Tang, Kolliopoulou and Tsoukalas18 When the nanoparticles were deposited onto arrays of peak and valley structures due to surface-topography-induced local increase of the electric field, the nanoparticles were self-assembled onto the peaks of the structures to form ordered arrays of nanowires. This self-assembly process was achieved by the electric field from the charges carried on the nanoparticles themselves. Compared with previous approaches based on coulombic forces,Reference Joo, Moon and Jacobson3–Reference Oates, Keller, Noda and Facsko9 our approach does not require any additional charge pattern or electric field to be formed on the substrate to attract the nanoparticles. The method has been successfully tested on different substrate materials such as photoresist, silicon dioxide, or gold, using inexpensive patterning techniques for the formation of periodic peak and valley lines.
II. EXPERIMENTS
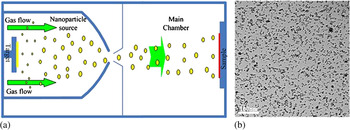
Nickel nanoparticles were deposited in our experiments. Nanoparticle formation is based on a physical vapor deposition (PVD) process. The deposition system is equipped with a DC magnetron sputtering source that can be used for nanoparticle synthesis.Reference Kean and Allers12, Reference Tang, Verreli and Tsoukalas13 Particles are generated using a high-pressure magnetron sputtering device and carried away from the target area by a discharge gas into a condensation zone where nanoparticles are grown. After being swept through this zone, the nanoparticles enter the deposition chamber through a final aperture and are soft-landed on the substrate surface, as shown in Fig. 1(a).
(a) Nanoparticle deposition system. (b) TEM image of the nanoparticles after 10 min deposition.

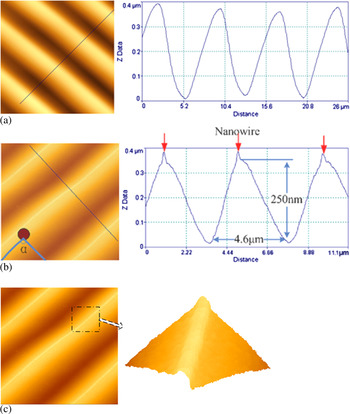
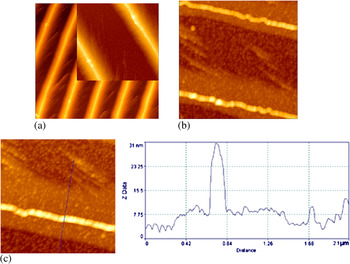
Photoresist lines were fabricated using the fracture induced patterning technique, as shown in Fig. 2. Photoresist patterns were fabricated by the fracture induced patterning technique: photoresist AZ5214E was spin-coated on a cleaned silicon substrate. PGMEA was used as the dilution solution for the photoresist to adjust the photoresist thickness. Another clean Si sample was then immediately bonded onto this photoresist layer, thus forming a silicon–photoresist–silicon sandwich structure. The structure was baked in the oven at 50 °C for 30 min. Then it was separated by a razor blade from one edge to prise the two samples apart. After this separation, as shown in Fig. 2(a), well ordered microgratings can be observed on these two samples with different feature sizes complementary to each other. Using this technique, we obtained triangular cross-section photoresist gratings with thicknesses from 40 nm to 1.5 μm and periods in the range of 1 μm to 30 μm, respectively. The detailed fabrication process and results can be seen in Tang et al.Reference Tang, Kolliopoulou and Tsoukalas18
AFM image of photoresist line array patterns from the fracture induced patterning technique (a) before and (b, c) after nanoparticles deposition.

Nanoparticle topography characterization studies were performed with an atomic force microscope (AFM, Innova from Veeco, USA). The AFM images shown in this paper present the topography as recorded in tapping mode. In addition, field emission scanning electron microscopy (FESEM, JEOL JSM-7401F, Japan) and transmission electron microscopy (TEM, Philips CM20, The Netherlands) were also used to characterize the nanoparticles.
III. RESULTS AND DISCUSSION
We have first studied the nanoparticle density and size distribution deposited over a blanket surface. The nanoparticle deposition conditions we have used were as follows: DC power: 330 V, 0.1 A; deposition chamber pressure: 4 × 10⁻⁴ mbar; deposition time: 10 min. Under this condition, the deposited nanoparticles have a mean diameter of 5 nm and a density of 5 × 10¹¹ particles/cm2, as shown in Fig. 1(b).
The nanoparticles were subsequently deposited on photoresist peak and valley patterns formed on top of a silicon substrate using the fabrication method reported above (Section II). In Fig. 2(b) we show images from AFM which compared with Fig. 2(a) clearly demonstrate that after nanoparticle deposition, continuous nanowire arrays were formed on the peak corners of the photoresist triangular patterns. We have further measured the nanowire arrays assembled from the nanoparticles, as shown in Figs. 2(c) and 2(d). The thickness of the nanoparticle layers is similar to the lateral size and is approximately 5–6 nanoparticle layers (~30 nm).
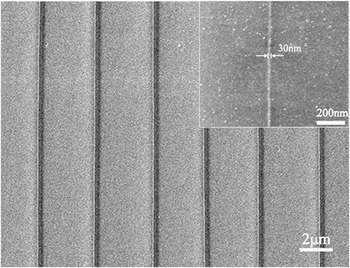
Further evidence is given by FESEM measurements, as shown in Fig. 3, where we observe that after the deposition, the nanoparticles were self-focused to form narrow nanowires of approximately 30 nm in width along the peaks of photoresist structures. On the other regions of the photoresist, there was only a relatively small density of nanoparticles as can be seen from the inset of Fig. 3.
FESEM images of nanoparticle line distribution on the photoresist patterns.

The following question then arises: What forces drive the nanoparticles toward the peaks? The electric field singularity induced by surface corners has already been well documentedReference Jackson19 and its influence on atom nucleation on dielectric materials during evaporation has also been reported.Reference Ravishankar, Shenoy and Carter20 In Ravishankar et al.,Reference Ravishankar, Shenoy and Carter20 Pt nanoparticles are formed on crests of an alumina substrate after heating the substrate together with Pt foil at 1800 °C. In that case, nanoparticle array formation is driven by competition between the surface energy which favors formation of droplets (similar to Rayleigh-Plateau instability), and the electrostatic energy which favors a continuous liquid tube so that most of the crest is covered with liquid metal. In our experiments performed at room temperature, the nanoparticles have already been formed before landing on the patterned photoresist surface and the only driving force is of an electrostatic nature.
From classical electrodynamics, we know that at the intersection of two planes (i.e., the corner), σ(ρ) the 2-dimensional surface charge density distribution on these two planes can be approximately calculated byReference Jackson19:

where a 1 is a constant, ρ is the distance from the intersection point, and β = 2π – α, where α is the angle between the two planes shown in Fig. 2(b). So if β > π(180°), the power of ρ becomes negative, the two dimensional corner becomes an edge, and the surface charge density becomes singular as ρ→0, which means that at the corner there should be an extremely high density of accumulated charge.
We explain the nanoparticle focusing effect observed in our experiments by the above classical electrostatic theory.Reference Jackson19 The charged nanoparticles are the charge transport vehicles in that case. As we see from Fig. 2(b), the photoresist pattern has a lateral size of 4600 nm and a height of 250 nm. We can then calculate the angle β = 192.4°, which is larger than 180°. So a charge density distribution that exhibits a singularity at the corners is possible according the above theoretical analysis.
In a more qualitative explanation, the charged nanoparticles spread out as much as possible on the surface and the corners are as far away as it is possible to be from most of the surface. To put it in another way, the electrostatic energy of the system is lowered when the charged nanoparticles are concentrated on the peaks. A strong nanoparticle focusing effect is thus formed. We should also note that a focusing effect is not observed at the valley points because there, the angle β = 167.6°, which is smaller than π. The charge density at these points should be decreasing in that case as ρ→0 according to Eq. (1).
In order to get an estimate of how fast this process is, we have considered values of nanoparticle diffusivity as reported in the literature which vary according their size and surrounding medium. For gold nanoparticles of medium size, 169 nm, diffusivity values around 3 μm2/s were calculated in a low viscosity medium (water) using the Stokes-Einstein relation.Reference Koening, Ong, Cortes, Moreno-Razo, de Pablo and Abbot21 For the size of nanoparticles used in our experiment, which is about 30 times smaller, the diffusivity value according the above relation should exhibit a 30-fold increase. This value is considered as a lower bound for nanoparticle diffusivity in our experiments given that nickel nanoparticles move on a free surface. Calculation of the diffusion length for nickel nanoparticles using t = 1 s gives a value around 10 μm. This length is similar to the distance that a nanoparticle travels before arriving at the peaks in our periodic structures, which affords the conclusion that the nanoparticles reach at the peaks in less than a second. However, at such a timescale, we do not have sufficient concentration of nanoparticles to form nanowires.
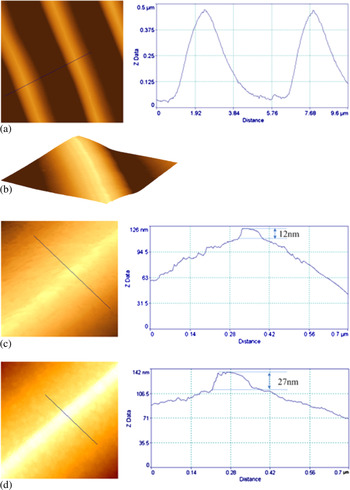
In order to investigate the dynamic self-assembly process, we have performed an additional experiment using a nanoparticle deposition time of 2 min instead of the 10 min initially used, and keeping the other deposition conditions constant. From TEM analysis, we know that the surface density of nanoparticles on a flat surface is almost proportional to deposition time.Reference Tang, Verreli and Tsoukalas13 The AFM measurements of the nanoparticle patterns after 2 min deposition are shown in Figs. 4(a), 4(b), and 4(c). From these measurements, it is concluded that the nanoparticle lines were about 12 nm thick, as shown in Fig. 4(c), whereas in the case of 10 min deposition time they were 27 nm thick, as shown in Fig. 4(d). The observed increase is not linear with time, indicating that the focusing effect becomes weaker with deposition time.
AFM images of the nanoparticle line structures on the photoresist patterns with different deposition time. (a) Plane view and cross section profile after 2 min deposition. (b) 3D view of the nanowire sitting on the photoresist peak after 2 min deposition. (c) AFM planar images and cross section profiles of nanowires obtained after 2 min deposition. (d) AFM planar images and cross section profiles of nanowires obtained after 10 min deposition.

We believe that the accumulation of nanoparticles progressively reduces the sharpness of the corners. So the electric field and its gradient gradually decrease and consequently the resulting forces and the focusing effect are reduced. In addition, as the charged nanoparticles accumulate on the photoresist patterns, negative charge is also locally accumulated. This negative charge creates an electric field that exerts a repulsive force on the later arriving nanoparticles, pushing them away from the sample surface. This caused a decrease in the focusing of the nanoparticles with increasing deposition time.
In order to study the nanoparticle focusing more clearly, we removed the photoresist. We put the sample into acetone, kept it still for 5 min, and then picked it up gently. In this way we were able to dissolve the photoresist into acetone and the nanoparticles and the formed nanowires could fall down directly to the silicon surface. The whole process is studied by AFM measurement as shown in Fig. 5. As shown in Fig. 5(a), nanoparticles were focused and formed nanowire arrays on the peak of the photoresist peaks. On the other regions, the nanoparticle density is quite small. After the photoresist removal, in Fig. 5(b), although parts of the nanowires were broken, the density contrast in different regions is still clear. From the dimension measurements in Fig. 5(c), we can draw the conclusion that the focusing effect is clearly observed and the focused lines have thicknesses of about 25–30 nm. For the other regions, the density of the nanoparticles was much smaller.
Nanowires form nanoparticles before and after photoresist removal. (a) AFM image of the nanoparticle line array on the photoresist patterns before photoresist removal (scan size: 10 μm × 10 μm and 3 μm × 3 μm for the inset). (b) AFM image of the nanoparticle nanowires after photoresist removal (scan size: 3.2 μm × 3.2 μm). (c) Section profile of the nanowires after photoresist removal.

In a set of additional experiments, we have tested the nanowire fabrication process with different substrate materials. We coated the triangular photoresist structures with a uniform 100 nm thickness SiO2 layer or Au film layer. Following the same nanoparticle deposition process we also observed the same self-assembly phenomenon in these cases.
IV. CONCLUSIONS
A method to fabricate ordered arrays of nanowires from either metallic or semiconducting nanoparticles is demonstrated in this paper which is based on the driving of nanoparticles to peak edges formed on the substrate. There are two key factors for the successful implementation of the method. The first is the fabrication of a peak and valley array structure on the substrate which allows for a singularity of the electric field distribution during the subsequent nanoparticle deposition. The second is the charging itself of the nanoparticles, which creates the electric field that drives the nanoparticles at the peaks during their deposition in vacuum.
Nanowires of 30 nm width were formed with their thickness increasing with deposition time. Our method does not require the application of any external field, thus simplifying the fabrication process. It can also be applied on either insulating or conductive substrate material, and can be used to fabricate nanowire arrays with a nanometer width without the need for advanced patterning.
ACKNOWLEDGMENTS
We acknowledge financial support from EU through the “Nanosource” IAPP Marie Curie program. One of us, TJ, also acknowledges support from IKY. We are grateful to Mr. E. Lynarakis for FESEM measurements.