Implications
The work will provide essential information about the genetic structure and uniqueness of some important Italian dog breeds. These populations play a pivotal role for the pastoral community, helping them in the management of the livestock resources on field. These data will help the improvement of the current and future breed conservation programmes.
Introduction
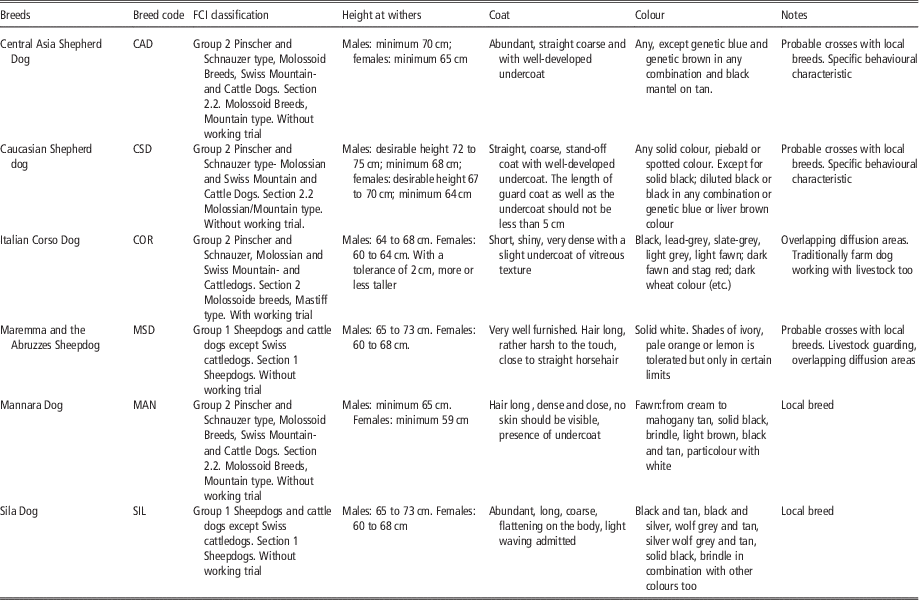
The dog was the first animal to be domesticated (Vonholdt et al., Reference Vonholdt, Pollinger, Lohmueller, Han, Parker, Quignon, Degenhardt, Boyko, Earl, Auton, Reynolds, Bryc, Brisbin, Knowles, Mosher, Spady, Elkahloun, Geffen, Pilot, Jedrzejewski, Greco, Randi, Bannasch, Wilton, Shearman, Musiani, Cargill, Jones, Qian, Huang, Ding, Zhang, Bustamante, Ostrander, Novembre and Wayne2010) and has been successfully employed as a model organism for the study of mammalian size, shape, behaviour and naturally occurring disease risk studies (Vilà et al., Reference Vilà, Savolainen, Maldonado, Amorim, Rice, Honeycutt, Crandall, Lundeberg and Wayne1997). Domestic dog breed differentiation traces back to the 19th century (Gagliardi et al., Reference Gagliardi, Llambí, García and Arruga2011), where breeds can be defined as intraspecific groups showing uniform morphological and behavioural characteristics developed by artificial selection (Irion et al., Reference Irion, Schaffer, Famula, Eggleston, Hughes and Pedersen2003). Livestock guarding dogs are an adjunct to the pastoral community, selected to fill the role of protecting agricultural flocks in the absence of direction or oversight by a human shepherd. They are traditionally dogs with a large body size, and display early juvenile motor patterns that persist longer during development than in other breeds, whereas also characterized by a weakened stereotypical behavioural sequence in adults (Coppinger and Schneider, Reference Coppinger and Schneider1995). In these breeds many regional phenotypic groups can be identified, with a primary driver of selection corresponding to coat colour (Coppinger and Schneider, Reference Coppinger and Schneider1995). Italy has a long tradition in the sheep industry and is home to many different livestock guardian dog populations devised to succeed in varied conditions. Some of these breeds are officially recognized by Fédération Cynologique Internationale (FCI), whereas others are locally identified landraces (Table 1). The long-standing practice of transhumance, the seasonal movement of agricultural flocks between grazing lands along traditional routes, allowed a continuous genetic flow of genes among and between guardian dog breeds working in overlapping areas (Ceh and Dovc, Reference Ceh and Dovc2014).
Information about the six dog breeds: Code, Fédération Cynologique Internationale (FCI) classification, height at withers according to official standard, coat type, coat colour, in the notes the links within the breeds and the inclusion in the research panel are reported

Autosomal microsatellites are a well-known effective and powerful tool to investigate genetic structure and diversity of dog breeds as already proved by many authors (Parker, Reference Parker2012; Bigi et al., Reference Bigi, Marelli, Randi and Polli2015; Sechi et al., Reference Sechi, Polli, Marelli, Talenti, Crepaldi, Fiore, Spissu, Dreger, Zedda, Dimauro, Ostrander, Di Cerbo and Cocco2016). Likewise, gene flow within breeds and detection of breed hybridization have been successfully demonstrated with microsatellites (Kopaliani et al., Reference Kopaliani, Shakarashvili, Gurielidze, Qurkhuli and Tarkhnishvili2014). The aim of this study is to analyse the population structure and genetic differentiation of Italian livestock guardian breeds (Maremma and Abruzzese Sheepdog (MSD); Mannara’s Dog (MAN); Sila’s Dog (SIL)) and selected breeds that share original regions and working areas (Cane Corso (COR)) or morphological and behavioural characteristics (Central Asian Shepherd Dog (CAD); Caucasian Shepherd Dog (CSD)).
There is an increasing worldwide interest in identifying native genetic resources to be considered as important targets for conservation projects (Lee et al., Reference Lee, Choi and Cho2014). The three Italian livestock guardian breeds in the present work should be considered genetic resources with high cultural value due to their ancient origin, strictly linked to well-established traditional sheep and goat farming practices in marginal areas, which are now disappearing in favour of highly productive farms based on intensive rearing conditions. We describe the genetic makeup of the studied breeds. Through characterizing these local flock guardian dogs as distinct regionally and culturally relevant breeds, we will provide breeders and conservationists with valuable genetic data for enhanced preservation.
Material and methods
Sampling and DNA extraction
A total of 179 blood samples from 59 MAN, 22 MSD, 36 COR, 26 SIL, 24 CAD and 12 CSD dogs were collected by Italian Kennel Club (ENCI) partner laboratories for the official pedigree certification scheme and field inspections according to European rules for animal welfare (Council of Europe, 1986). Three-generation pedigrees of dogs belonging to FCI officially recognized breeds (COR, MSD, CAD, CSD) and supplementary studbook registered breeds (MAN, SIL) were obtained from the online Italian Kennel Club studbooks. All sampled dogs were unrelated for at least two generations. DNA was extracted from whole EDTA blood or DNA sample cards (Vet Kard with FTA System®; Prion Diagnostica srl, Rho, MI, Italy), using IllustraTM blood genomicPrep Mini Spin Kit (GE Healthcare UK Limited, Amersham Place, Little Chalfont, Buckinghamshire, UK), according to the manufacturer’s protocols.
Microsatellite genotyping
Samples were genotyped using 18 microsatellite markers mapping on 17 different autosomes (AHT121 (map location on CFA13), AHT137 (CFA11), AHTH171 (CFA6), AHTH260 (CFA16), AHTK211 (CFA26), AHTK253 (CFA23), CXX279 (CFA22), FH2054 (CFA12), FH2848 (CFA2), INRA21 (CFA21), INU005 (CFA33), INU030 (CFA12), INU055 (CFA10), REN162C04 (CFA7), REN169D01 (CFA14), REN169O18 (CFA29), REN247M23 (CFA15) and REN54P11 (CFA18)). Gender was confirmed using an amelogenin marker (AMELY and AMELX) that was included in the Canine Genotypes TM Panel 1.1, F-860S/L microsatellite panel (Finnzymes Diagnostics; Finnzymes OY, Keilaranta 16 A, 02150 Espoo, Finland). These microsatellites are included in the panel of loci by Applied Genetics Committee of Companion Animals of the International Society for Animal Genetics (Budowle et al., Reference Budowle, Garofano, Hellman, Ketchum, Kanthaswamy, Parson, van Haeringen, Fain and Broad2005). Polymerase chain reaction amplification and electrophoresis (ABI Prism® 310 Genetic Analyzer; Thermo Fisher Scientific, Waltham, MA, USA) were carried out following the manufacturer’s protocols. Individual genotypes were determined using the software Genescan® 3.7 (ABI).
Data analysis
The software Arlequin v.3.5 (Excoffier and Lischer, Reference Excoffier and Lischer2010) was used to calculate the number of alleles per locus, observed heterozygosity (H O), and expected heterozygosity (H E) and test for Hardy–Weinberg equilibrium (HWE). Arlequin v.3.5 was also used to compute Wright’s F statistics, where F IS is the inbreeding coefficient of the individual relative to the breed, F IT is the inbreeding coefficient of the individual relative to the total population, and F ST is the differentiation between breeds (Weir and Cockerham, Reference Weir and Cockerham1984). In addition we, calculated the pairwise R st index, which provides more adequate measures of differentiation based on microsatellites markers (Slatkin, Reference Slatkin1995). Multiple comparisons were corrected to statistical Bonferroni significance (Rice, Reference Rice1989) and tested using 1000 permutations. To evaluate the significance of genetic differentiation between populations an analysis of molecular variance (AMOVA; Excoffier and Lischer, Reference Excoffier and Lischer2010) using the exact test implemented in ARLEQUIN software was performed. Allelic richness (AR) was computed in FSTAT to reduce the effect of a different sample size (Goudet, Reference Goudet2001).
Genetic divergence among breeds was estimated by Nei’s standard genetic distance (D) (Nei, Reference Nei1972) and Reynolds’ unweighted distances (D R) (Reynolds et al., Reference Reynolds, Weir and Cockerham1983), using Genedist (Brzustowski, Reference Brzustowski2001) software. The Phylip v.3.65 package (Felsenstein, Reference Felsenstein1989) was used to construct phenograms based on neighbour-joining analysis of Nei’s and Reynolds’s distances. Support for the tree nodes was assessed by 1000 bootstraps of gene frequencies using Seqboot and compiled with Consense, both functions of Phylip v.3.65 (Felsenstein, Reference Felsenstein1989).
Animals were clustered on the basis of their genotypes using a Bayesian approach in Structure 2.3.4 (Pritchard et al., Reference Pritchard, Stephens and Donnelly2000), using the population as prior information in the analysis. Using a model with admixture and correlated allele frequencies, we performed ten independent runs for each value of the putative number of subpopulations (K) between 1 and 10, with a burn-in period of 50 000 followed by 500 000 MCMC repetitions. The most likely number of clusters in our sample was determined using ΔK as described by Evanno et al. (Reference Evanno, Regnaut and Goudet2005). CLUMPP (Jakobsson and Rosenberg, Reference Jakobsson and Rosenberg2007) was used to match the data from the multiple runs for each K, and DISTRUCT (Rosenberg, Reference Rosenberg2003) was used to display the results. Main splits were analysed to detect the relationships among lineages.
To visualize the genetic structure of individuals, a principal components analysis (PCA) based on inter-individual genetic distance in GenAlex 6 (Peakall and Smouse, Reference Peakall and Smouse2012) was also conducted. Genetic distances were calculated as described in the GenAlex 6 guide for co-dominant data.
Results
Genetic variability
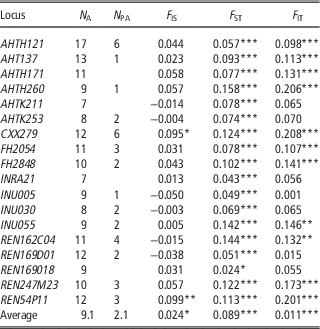
All samples were successfully genotyped with a total of 185 alleles detected across the 18 microsatellite loci analysed. All of the dog breeds were polymorphic across the microsatellite panel. The average number of alleles per locus was 9.1 and the number of alleles ranged between seven (AHTK211 and INRA21) and 17 (AHTH121) (Table 2). The private alleles observed in the studied breeds are reported in the Supplementary Table S1. The majority of the private alleles in the six breeds were below 0.05 in frequency; allele 174 of locus FH2054 in COR had a frequency of 0.157.
Characterization of the 18 analysed microsatellite loci in six dog breeds

N A=number of alleles; N PA=number of private alleles; F IS and F IT=measurements of the deviation from Hardy–Weinberg proportions within populations and in the total population, respectively; F ST is the genetic differentiation over subpopulations.
* P<0.05, ** P<0.01, *** P<0.001.
Average estimates of H O and H E over all loci and breeds were 0.72 and 0.72 (Table 3), with the lowest values detected in COR (H E=0.68; H O=0.65) and the highest in CAD (H E=0.76; H O=0.74). Among the six dog breeds considered, the lowest value of AR was found in the COR (5.11) and the highest in the CAD (6.85). The HWE exact test revealed 21 significant deviations (19.4%) between H E and H O after Bonferroni correction. HO was significantly higher than H E in three cases; in all other cases, H E was higher than H O (Table 3).
Basic information and genetic diversity parameters of six dog breeds

N PA=number of private alleles; AR=allelic richness; H E=expected heterozygosity; H O=observed heterozygosity; F Is=within-breed inbreeding coefficient; HWE deviations=number of loci departing from Hardy–Weinberg equilibrium expectations; CAD=Central Asia Shepherd Dog, CSD=Caucasian Shepherd Dog, COR=Corso, MAN=Mannara Dog, MSD=Maremma Sheep Dog, SIL=Sila Dog.
Reference Population Size: ENCI studbook entries: 2007–2016.
1 Negative and positive values indicate the number of loci showing heterozygote deficiency and excess, respectively.
**P<0.01.
The overall F IS value among all loci was significantly higher than zero after Bonferroni correction in the MSD (0.10) indicating heterozygote deficiency in this breed.
A total of 38 private alleles were recorded. All the populations, except for CSD, showed at least one private allele, with the CAD having the highest number of private alleles (N PA=16).
Relationships among breeds
Genetic differentiation among breeds was highly significant (P<0.001) for all loci, as revealed by AMOVA. The average F ST values indicate that ~9% of the total genetic variation was explained by breed differences, with the remaining 91% corresponding to differences among individuals. A significant excess of homozygotes across all breeds was found for CXX279 and REN54P11 (P CXX279 =0.018; P REN54P11 =0.006). Even if these excess of homozygosity could be also related to the microsatellites technique, we decided to keep them in the subsequent analyses.
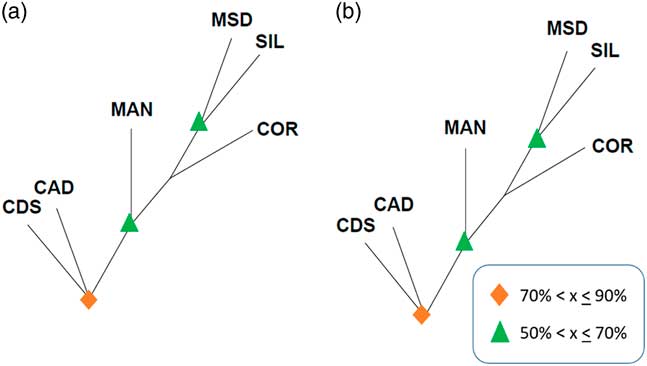
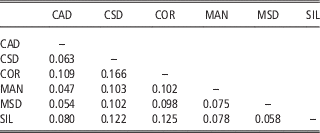
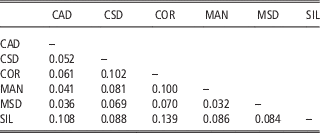
All pairwise F ST values were significantly different from zero (P<0.001), ranging from 0.058 between the MSD and the SIL to 0.166 between the COR and the CSD (Table 4). R ST statistic gave us similar average values, although ranging from 0.032 to 0.139 (Table 5). The rooted bootstrapped neighbour-joining phylogeny with Nei’s D produced a dendrogram (Figure 1a) with CAD and CSD adjacent (89% confidence).On a separate branch are the MSD and SIL monophyletic clades (61% confidence). Finally, the COR branch is outside of this primary clade with confidence levels below 50%. The DR analysis produced the same phylogenetic arrangement of breeds, with comparable confidence values (Figure 1b).
(colour online) Neighbour-joining trees of the six dog populations built from (a) Nei’s standard genetic distance (D) (b) Reynolds unweighted distances (DR). Symbols indicate the ratio of 1000 bootstrap replications across loci. CAD=Central Asia Shepherd Dog, CSD=Caucasian Shepherd Dog, COR=Corso, MAN=Mannara Dog, MSD=Maremma Sheep Dog, SIL=Sila Dog.

F ST estimatesFootnote 1 as a measure of genetic distance between dog breeds

CAD=Central Asia Shepherd Dog, CSD=Caucasian Shepherd Dog, COR=Corso, MAN=Mannara Dog, MSD=Maremma Sheep Dog, SIL=Sila Dog.
All pairwise F ST differences were significantly larger than 0 (P<0.001).
1 F ST estimates calculated as described in Weir and Cockerham (Reference Weir and Cockerham1984).
R ST estimatesFootnote 1 as a measure of genetic distance between dog breeds

CAD=Central Asia Shepherd Dog, CSD=Caucasian Shepherd Dog, COR=Corso, MAN=Mannara Dog, MSD=Maremma Sheep Dog, SIL=Sila Dog.
1 R ST estimates calculated as described in Slatkin (Reference Slatkin1995). All pairwise R ST differences were significantly larger than 0 (P<0.01).
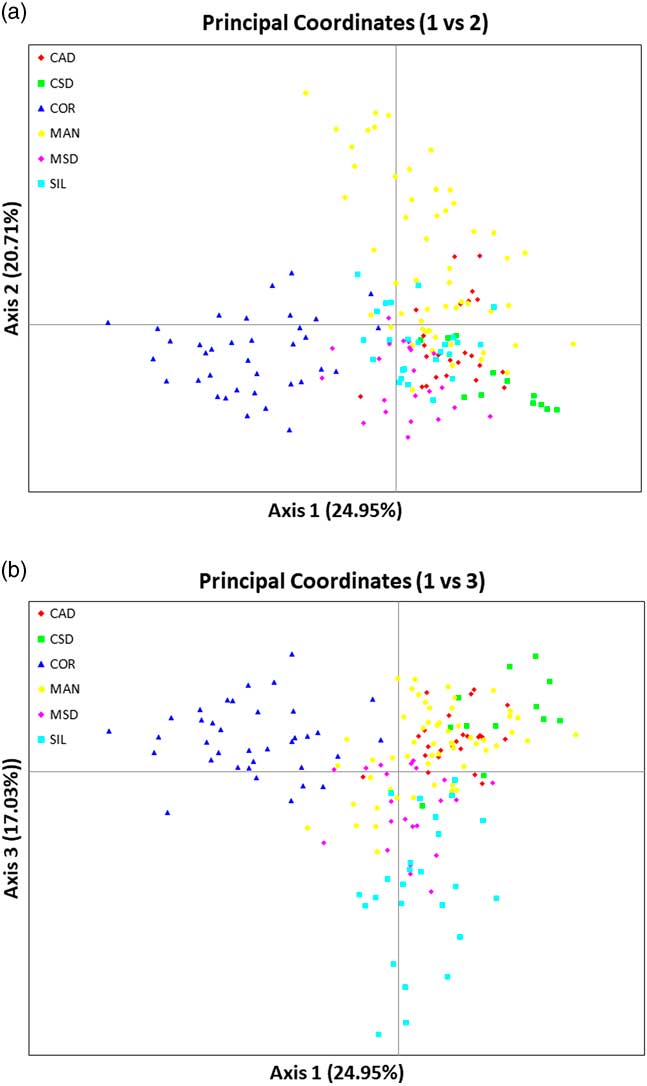
The first three axes of the principle coordinate analysis account for 62.69% of the total genetic variance between individual dogs (Figure 2). Coordinate 1 (24.95%) separates the COR from the flock guardian breeds. The second coordinate (20.71%) separates the MAN from the remaining five breeds. Coordinate 3 (17.03%) isolates the SIL from the remaining breeds.
(colour online) (a) Principal component analysis of allele frequencies for six dog populations. The projection is shown on the first two axes. (b) The same samples as in (a) were plotted using dimension coordinates 2 v. 3. CAD=Central Asia Shepherd Dog, CSD=Caucasian Shepherd Dog, COR=Corso, MAN=Mannara Dog, MSD=Maremma Sheep Dog, SIL=Sila Dog.

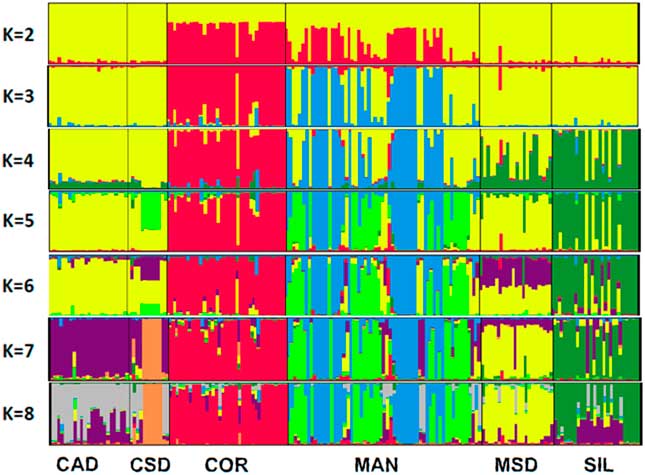
Clustering using Bayesian approaches was performed on the entire data set with an increasing number of inferred clusters from K=2 to K=10 and produced consistent results. ΔK analysis showed the primary peak when K=3, a secondary peak was obtained at K=7 (Supplementary Figure S1). Therefore, we analysed the sub-sequential splits from two to eight to identify the strict relationships among breeds (Figure 3). The initial division of K=2 identifies a signature primarily in COR but also present in MAN. The K=3 division defines a strong COR signature and a new signature in most, but not all, MAN. When K=5, the SIL presents as a unique grouping. For K=7, the CAD, COR, MSD and SIL appear to have predominantly breed-specific signatures, whereas substructure is apparent within the MAN and CSD breeds.
(colour online) Proportion of membership of 179 individuals from six dog breeds for K=2 to 8, as calculated by Structure software. Multiple runs for each K were concatenated using Clumpp, and Distruct was used to generate images. Each individual, represented as a vertical line is partitioned into coloured segments whose length is proportional to the individual’s probability of assignment (Q) to the Kth group. CAD=Central Asia Shepherd Dog, CSD=Caucasian Shepherd Dog, COR=Corso, MAN=Mannara Dog, MSD=Maremma Sheep Dog, SIL=Sila Dog.

Discussion
A clear differentiation of the six studied breeds has been shown at the nuclear DNA level, with all 18 microsatellites genotyping as polymorphic in the analysed breeds. The average number of alleles (N=9.1) corresponds to that calculated by Suárez and colleagues in a 2013 investigation of the genetic makeup of Canary Island dog breeds, both FCI recognized and local. The number of private alleles shows the difference between breeds showing similar results to those presented by Irion et al. (Reference Irion, Schaffer, Grant, Wilton and Pedersen2005) about Bali street dog originality. The F statistics of these Italian livestock dogs revealed a broad variation among loci and breeds. A high across-breed average F ST value indicates greater divergence of breeds within the selected population. A lower across-breed average F ST value would imply that the included breeds are more closely related to each other. The genetic divergence of autosomal microsatellite markers in the present Italian flock guardian breeds resulted in an across-breed average F ST of 0.09, a comparable value to that found in pointing (F ST=0.11; Parra et al. Reference Parra, Méndez, Cañón and Dunner2008), Spanish (F ST=0.10; Jordana et al. Reference Jordana, Piedrafita, Sanchez and Puig1992) and Asian (F ST=0.15; Kim et al. Reference Kim, Tanabe, Park and Ha2001) dog breeds. R ST statistics showed similar average values and patterns. A recent analysis of the genetic makeup of Italian shepherd dog breeds, of which the MSD was also included, showed higher average F ST value of 0.20 (Bigi et al., Reference Bigi, Marelli, Randi and Polli2015). Amongst the livestock guardian breeds of the present study, only the MSD showed a significant F IS (P⩽0.01), consistent with previously reported data (Bigi et al., Reference Bigi, Marelli, Randi and Polli2015). This indicates that the MSD probably represents the most uniform of the considered breeds, with the most ancient official recognition and the highest population size.
The breed-to-breed F ST values estimate pairwise genetic differentiation. In regard to the livestock guardian breeds of the present study, all pairwise F ST values were highly significant (P≤0.001). These results highlight the significant differences between the studied breeds. The lowest F ST value occurred between MAN and CAD (0.047) revealing a probable past shared genetic history. On the other hand, the highest F ST (0.166) was recorded between COR and CSD, confirming the historical expectation of these two breeds having developed independently.
The present breeds show high HO values, ranging from 0.68 to 0.75. The observed values are closer to those reported by Pedersen et al. (Reference Pedersen, Liu, Theilen and Sacks2012) for village dogs and working gundog breeds (H O=0.63 to 0.80) than for breeds selected for conformation events (H O=0.43 to 0.57). Previous studies, using comparable numbers of microsatellite markers, of working lines of CAS and CSD reported a mean H O of 0.78 (Kopaliani et al., Reference Kopaliani, Shakarashvili, Gurielidze, Qurkhuli and Tarkhnishvili2014), whereas the mean H O of 12 modern breeds was found to be 0.67 (Streitberger et al., Reference Streitberger, Schweizer, Kropatsch, Dekomien, Distl, Fischer, Epplen and Hertwig2012). The results published by Ceh and Dovc (Reference Ceh and Dovc2014) regarding flock guardian breeds from the Balkans are likewise comparable (H O 0.59 to 0.76). However, the Norwegian Lundehund, a very rare breed characterized by strong genetic erosion and high inbreeding level, has an H O of 0.05 (Pfahler and Distl, Reference Pfahler and Distl2013).
The breeds utilized in this study continue to be raised locally to fulfil their intended guardian purpose, therefore, selection has not been substantially influenced by scores obtained through canine conformation competitions. All of the study dogs were, however, registered as purebred animals with ENCI, either as a recognized breed or through preliminary studbook recording, both of which require a minimum of three purebred generations of unique individuals. However, as international recognition of breed status dates to between 1956 (MSD) and 2004 (COR) for each of the four internationally recognized breeds, admixture between similar breeds of common function and geography before those dates is likely. High heterozygosity could be considered a characterizing trait in working breeds, sheep guardians in particular, who are selected mainly for working attitude and natural morphology, limiting inbreeding coefficients and the common sire effect. Breed clubs and associations are interested in limiting inbreeding levels increase even though no specific rules have been officialised by the Italian Kennel Club, furthermore a high effective population size of the founder groups could be supposed. Even though the six breeds have very different population sizes (Table 3), they all maintain high heterozygosity levels. The CAD breed shows the highest number of private alleles and AR, consistent with previously published data (Kopaliani et al., Reference Kopaliani, Shakarashvili, Gurielidze, Qurkhuli and Tarkhnishvili2014). This reflects its ancient origin close to one of the main domestication hubs (Vonholdt et al., Reference Vonholdt, Pollinger, Lohmueller, Han, Parker, Quignon, Degenhardt, Boyko, Earl, Auton, Reynolds, Bryc, Brisbin, Knowles, Mosher, Spady, Elkahloun, Geffen, Pilot, Jedrzejewski, Greco, Randi, Bannasch, Wilton, Shearman, Musiani, Cargill, Jones, Qian, Huang, Ding, Zhang, Bustamante, Ostrander, Novembre and Wayne2010).
The genetic differentiation of the six breeds is shown in Figures 1a and b which report consistent results, a clear cluster separating the CAD and the CSD breeds of Western Asian origin from the Italian breeds, underlining their unique genetic composition (Ceh and Dovc, Reference Ceh and Dovc2014; Kopaliani et al., Reference Kopaliani, Shakarashvili, Gurielidze, Qurkhuli and Tarkhnishvili2014). The four Italian breeds considered maintain their phylogenetic differentiation regardless of analysis involving genetic distance or allele frequency.
The first coordinate of the PCA (Figure 2a and b) confirms our hypothesis that the COR is particularly divergent from the flock guardian breeds. However, coordinates two and three isolate the MAN and SIL, respectively. The CAD and the CSD, once again, consistently cluster together, connoting some shared genetic component. In similar analyses, the Perro da Presa Canario, a breed with shared morphological and behavioural phenotypes to the COR, was likewise shown to differentiate from sheepdog breeds of the Canary Islands (Suárez et al., Reference Suárez, Betancor, Fregel and Pestano2013).
The population structure analyses show clear breed differentiation that accompanies the inheritance of phenotypical traits where natural and/or artificial breed barriers are present. In this way, the similarity within a breed is higher than between breeds even if dogs belonging to different breeds were living in overlapping areas and were sharing the same function and working ability (Suárez et al., Reference Suárez, Betancor, Fregel and Pestano2013). The first breed to differentiate from the others (K=2) is the COR, again reproducing the pattern of breed relatedness reported by Suárez et al. (Reference Suárez, Betancor, Fregel and Pestano2013). The COR is an internationally recognized breed selected for conformation and working attributes. Conversely, SIL and MAN, that separate through STRUCTURE analysis at K=4 and K=5, are breeds which are still closely linked to their traditional agricultural roles and for which selection is heavily weighted for behaviour rather than appearance. The highest ΔK was calculated to be at K=3, even though at K=5 all the Italian livestock guard dog breeds are differentiated. Our results are comparable with those obtained by Ceh and Dovc (Reference Ceh and Dovc2014) in Balkan breeds underlining the strong commonalities linking together the livestock guarding dog breeds throughout Europe.
In the present study, the genetic characteristics of six livestock guardian breeds were analysed to show how all the considered breeds are genetically different. None of the considered breeds, even if characterized by small population size, seems to be victim of phenotypic selection leading to genetic drift, loss of alleles or high inbreeding values. Reported results can assist stakeholders in improving conservation programmes tailored to the specific needs and characteristics of each breed and livestock production system. The diffusion of these breeds should be strongly encouraged to prevent not only the extinction of highly historical and culturally valuable Italian livestock farming dog breeds, but also the abandoning of marginal area farming.
Acknowledgements
The authors are grateful to Elaine A. Ostrander and Dayna L. Dreger for their editing and suggestions to this manuscript. The authors are also grateful to the Italian Kennel Club (ENCI) and VETOGENE for the information provided, to the Mannara breeders club and, finally, to Isabella Biafora and the Sila breeders club.
Supplementary Material
To view supplementary material for this article, please visit https://doi.org/10.1017/S1751731117003573