I. INTRODUCTION
The compounds with ternary structures of the chalcopyrite family I-III-VI2 form an extensive group of semiconductor materials with diverse optical and electrical properties (Shay and Wernik, Reference Shay and Wernik1974). From the structural point of view, they crystallize with tetragonal symmetry in the space group I  $\overline 4 $ 2d (No 122) being isostructural with the CuFeS2 mineral (chalcopyrite) from which they take their name (Pauling and Brockway, Reference Pauling and Brockway1932). This family of compounds fulfills the rules of formation of adamantane compounds and belongs to the normal semiconductor compound families (Parthé, Reference Parthé, Westbrook and Fleischer1995). In particular, the ternary chalcopyrite semiconductor CuInSe2 has emerged as a leading material for the preparation of photovoltaic devices because of their potential applications in solar cell technology (Rincón et al., Reference Rincón, Wasim, Marin, Marquez, Nieves and Sánchez Pérez2001, Reference Rincón, Wasim, Marín and Molina2003).
In recent years, considerable attention has been focused on the detailed study of the ordered vacancy compounds (OVCs) related to the chalcopyrite compounds of the I-III-VI family, particularly CuInSe2 (CIS) (Feaeheiley, Reference Feaeheiley1986; Höenle et al., Reference Höenle, Kuehn and Boehnke1988; Knight, Reference Knight1992; Negami et al., Reference Negami, Kohara, Nishitani and Wada1994; Zhang et al., Reference Zhang, Wei and Zunger1997, Reference Zhang, Wei, Zunger and Katayama-Yoshida1998; Merino et al., Reference Merino, Mahanty, León, Díaz, Rueda and Martín de Vidales2000; Gulay et al., Reference Gulay, Ivashchenko, Zmiy and Olekseyuk2004; Paszkowicz et al., Reference Paszkowicz, Lewandowska and Bacewicz2004; Wasim et al., Reference Wasim, Rincón, Marín, Delgado and Contreras2004; among others).
In an interesting paper review, Feaeheiley (Reference Feaeheiley1986) studied the phase diagrams of the pseudobinary Cu2Se-In2Se3 system and reports the formation of ternary phases CuInSe2, Cu2In4Se7, CuIn3Se5, Cu3In5Se9, Cu5InSe4, and CuIn5Se8. Moreover, several In-rich phases of the CuInSe2 compound are reported to form on the tie-line of the (Cu2Se)X-(In2Se3)1−X pseudo binary system (Zhang et al., Reference Zhang, Wei, Zunger and Katayama-Yoshida1998). In studying the defect physics of CuInSe2, Zhang et al. (Reference Zhang, Wei, Zunger and Katayama-Yoshida1998) have suggested that the presence of the donor–acceptor defect pair (2V1−Cu + In2+Cu) could be used to explain the existence, according to Cun−3Inn+1Se2n, of CuIn5Se8 (n = 4), Cu2In6Se10 (CuIn3Se5) (n = 5), Cu3In7Se12 (n = 6), Cu2In4Se7 (n = 7), Cu5In9Se16 (n = 8), Cu3In5Se9 (n = 9) OVCs because of the repeat of a single unit of this defect pair for each n = 4, 5, 6, 7, 8, and 9 units, respectively, of CuInSe2. In addition, Gulay et al. (Reference Gulay, Ivashchenko, Zmiy and Olekseyuk2004) proposed three new phases for this system: CuIn7Se11, CuIn11Se17, and Cu7In13Se23.
From the structural point of view, several authors have reported that most of these OVC materials crystallize in chalcopyrite-related structures (Höenle et al., Reference Höenle, Kuehn and Boehnke1988; Schmid et al., Reference Schmid, Reukh, Greenwald and Schock1993; Negami et al., Reference Negami, Kohara, Nishitani and Wada1994; Marín et al., Reference Marín, Tauleigne, Wasim, Guevara, Delgado, Rincón, Mora and Sánchez Pérez1998; Merino et al., Reference Merino, Mahanty, León, Díaz, Rueda and Martín de Vidales2000).
In particular, the ternary compound Cu3In7Se12 (n = 6), or more precisely Cu3In7□2Se12, where □ denotes the cation vacancy which is included to maintain the same number of cations and anions sites, belongs to the family of OVCs I3-III7-□2-VI12. For this ternary compound, to the best of our knowledge, there are no data on its crystal structure based on single-crystal or powder X-ray diffraction measurements.
However, a search performed with the Powder Diffraction File (ICDD, Reference Kabekkodu2017) possibly found 15 entries with Cu-In-Se compounds, different compositions, and space group P  $\overline 4 $ 2c. Among these are the phases CuIn3Se5 (PDF 51–1221) (Marín et al., Reference Marín, Tauleigne, Wasim, Guevara, Delgado, Rincón, Mora and Sánchez Pérez1998), Cu0.39In1.2Se2 (PDF 42–862) and Cu0.72In2.16Se3.6 (PDF 10–954) (Höenle et al., Reference Höenle, Kuehn and Boehnke1988), and Cu0.8In2.4Se4 (PDF 16–4111) (Merino et al., Reference Merino, Di Michiel and León2003).
The chemical formula of the ternary compound reported in this paper can be written as Cu3In7□2Se12 if we take the Z value ⅔ non-integer with the space group P  $\overline 4 $ 2c (No 112) or taken the Z value integer equal to 1 in the chemical formula Cu2In14/3□4/3Se8 with the same space group. Therefore, in this work, a detailed structural analysis of the new ternary compound Cu2In14/3□4/3Se8 was performed using X-ray powder diffraction, aiming to derive a model that explains all the diffraction peaks in the powder pattern, and to refine it by means of the Rietveld method. The chemical structure was validated using the bond valence sum (BVS) calculations (Brown and Altermatt, Reference Brown and Altermatt1985; Brese and O'Keeffe, Reference Brese and O'Keeffe1991).
II. EXPERIMENTAL
A. Synthesis
The first step is to prepare the synthesis of the compound, the required masses of Cu, In, and Se of 6N of purity were sealed under vacuum in a quartz ampoule, then heated slowly (5 °C h–1) up to 1000 °C and left at that temperature for 48 h. It was slowly cooled down (10 °C h–1) to approximately 650 °C and then annealed, at this temperature, 100 h before cooling to room temperature. The resulting ingots were used to grow the single crystal by chemical vapor deposition (CVD) with small amount (5 mg cc–1) of the volatile element, such as iodine, to form volatile compounds of the synthesis element to promote transport and vapor phase mixing for subsequent condensation of single crystal of the compound. This CVD is carried out in a two-zone furnace. The crushed powder of the compound and the I2 was placed in the hotter zone (600 °C), and the crystal was grown in the lower furnace (550 °C).
B. Powder diffraction data collection
For the X-ray analysis, a small quantity of the sample, cut from the ingot, was ground mechanically in an agate mortar and pestle. The resulting fine powder was mounted on a flat zero-background holder covered with a thin layer of petroleum jelly. The X-ray powder diffraction data were collected at 293(1) K, in θ/θ reflection mode using a Siemens D5005 diffractometer equipped with an X-ray tube (CuKα1 radiation: λ = 1.54056 Å; 40 kV; 30 mA). A fixed aperture and divergence slit of 1 mm, a 1 mm monochromator slit, and a 0.1 mm detector slit were used. The specimen was scanned from 10° to 100° 2θ, with a step size of 0.02° and a counting time of 10 s. Quartz was used as an external standard. The Bruker AXS analytical software was used to establish the positions of the peaks. Further crystallographic details, including atomic coordinates, are included in the supplementary material.
III. RESULTS AND DISCUSSION
The X-ray diffractogram of Cu2In14/3□4/3Se8 shows a single phase. The 2θ positions of the 20 first peaks in the diffraction pattern were introduced into the auto-indexing program Dicvol04 (Boultif and Louër, Reference Boultif and Louër2004), and a tetragonal cell of dimensions a = 5.746(1) Å, c = 11.515(1) Å, were obtained. This cell is similar in magnitude to the parent chalcopyrite structure of CuInSe2, a = 5.781(1) Å, c = 11.642(3) Å (Knight, Reference Knight1992). The lack of systematic absence condition h + k + l in the general reflections of the type hkl indicating a P-type cell and rule out the I-type cell of the chalcopyrite structure. In addition, the conditions hhl: l = 2n and 00l: l = 2n suggest the extension symbol P  $\overline 4 $ 2c.
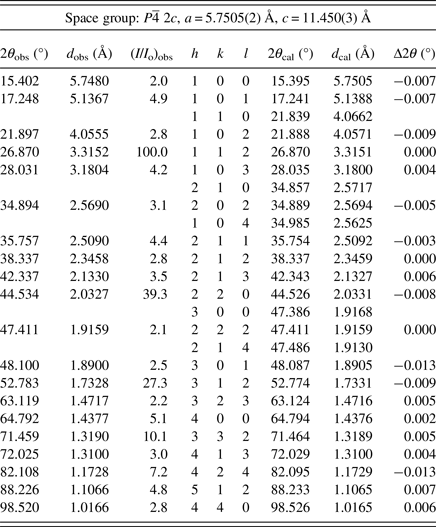
The complete powder diffraction dataset was reviewed in the tetragonal space group P  $\overline 4 $ 2c by using the program NBS*AIDS (Mighell et al., Reference Mighell, Hubbard and Stalick1981). From this analysis, the refined unit-cell parameters obtained were: a = 5.7505(2) Å and c = 11.450(3) Å, with figures of merit M 20 = 65.9 (de Wolff, Reference de Wolff1968) and F 20 = 28.6 (0.0057, 122) (Smith and Snyder, Reference Smith and Snyder1979). The resulting X-ray powder diffraction data for Cu2In14/3□4/3Se8, together with the observed and calculated 2θ, the d-spacing as well as the relative intensities of the reflections, are given in Table I.
Powder X-ray diffraction data of the ternary Cu2In14/3□4/3Se8.

A search in the ICSD Database (ICSD, 2008) showed an early report by Höenle et al. (Reference Höenle, Kuehn and Boehnke1988) of a selenium-rich phase β-Cu0.39In1.2Se2, which was solved by single crystal in the space group P  $\overline 4 $ 2c. The similarity in the space group symbol with our structure gave indications that the β-Cu0.39In1.2Se2 structure could be a good starting point to construct the initial structural model for Cu2In14/3□4/3Se8. Thus, several models were derived from Höenle's structure by permuting the cations in the available Wyckoff positions. Table II shows six models tested against the diffraction data by means of the Rietveld refinement method (Rietveld, Reference Rietveld1969), all of which have the Cu cation placed in the origin with Wyckoff position (2e): 0,0,0. Other tests were performed where the Cu cation was moved from the (2e) position or In cations placed in the (2a) or 2(c) position, and only poor quality Rietveld refinement fits were obtained, and therefore, not presented here.
Models employed in the Rietveld refinement for Cu2In14/3□4/3Se8.

In3 (cation) (foc = ⅓), □ (vacancy) (foc = ⅔), Se (anion): (x ≈ ¼, y ≈ ¼, z ≈ ⅛).
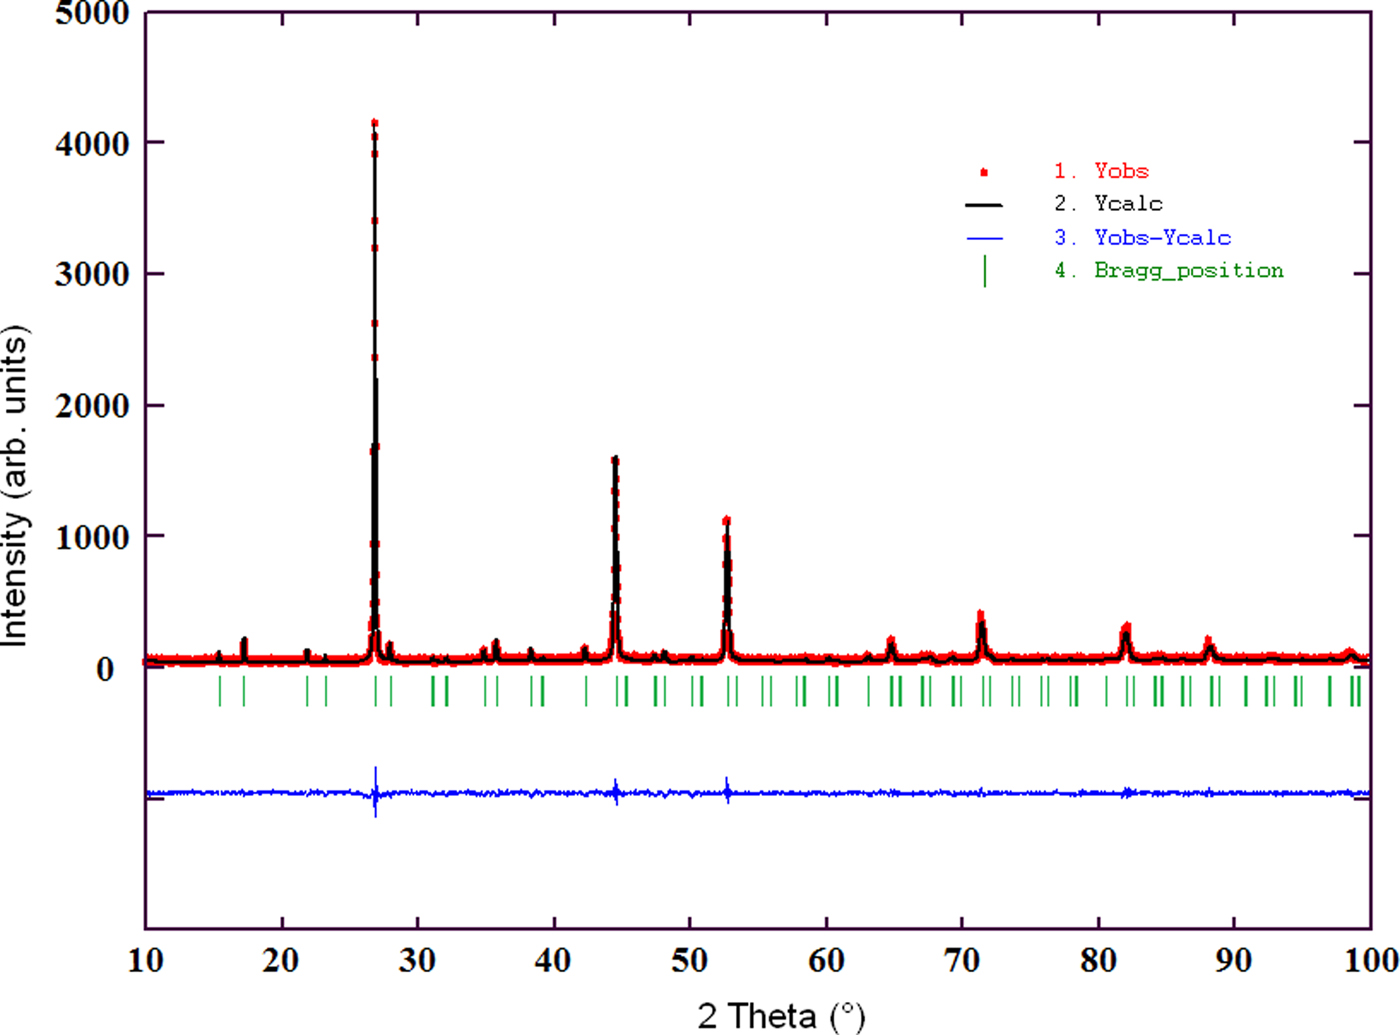
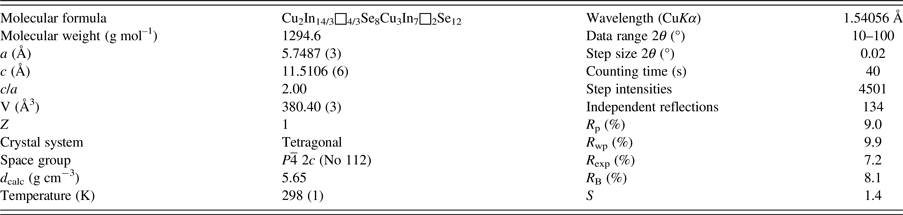
The Rietveld refinements were carried out using the Fullprof program (Rodriguez-Carvajal, Reference Rodriguez-Carvajal1993, Reference Rodriguez-Carvajal2016). The angular dependence of the peak full width at half maximum was described by the Cagliotti's formula (Cagliotti et al., Reference Cagliotti, Paoletti and Ricci1958). Peak shapes were described by the parameterized Thompson–Cox–Hastings pseudo-Voigt profile function (Thompson et al., Reference Thompson, Cox and Hastings1987). The background variation was described by a polynomial with six coefficients. The thermal motion of the atoms was described by one overall isotropic temperature factor. From the figures of merit R p, R wp, and S, it was inferred that the model that best fits the diffraction data is model 1, from Table II. The results of the Rietveld refinement for model 1 are summarized in Table III. Figure 1 shows the observed, calculated, and difference profile for the final cycle of Rietveld refinement. Atomic coordinates, isotropic temperature factor, bond distances, and angles are reported in Table IV.
(Color online) Final Rietveld refinement plot for Cu2In14/3□4/3Se8. The lower trace is the difference curve between observed and calculated patterns. The Bragg reflections are indicated by vertical bars.

Rietveld refinement results for Cu2In14/3□4/3Se8.

R exp = 100 [(N − P + C)/Σw(y obs2)]1/2 R p = 100 Σ|y obs − y calc|/Σ|y obs|.
R wp = 100 [Σw|y obs − y calc|2/Σw|y obs|2]1/2 S = [R wp/R exp].
R B = 100 Σk|I k − Ick|/Σk |I k| N − P + C is the number of degrees of freedom.
Atomic coordinates, isotropic temperature factors, and bond distances (Å) for Cu2In14/3□4/3Se8, derived from the Rietveld refinement. Bond valence sum (BVS) are also showed.

Symmetry codes: (i) y, −x, −z; (ii) 1−x, 1−y, z; (iii) x, −y, 0.5−z; (iv) −x, y, 0.5−z.
(BVS): V i = ∑j exp [(R o − R ij)/b], b = 0.37 Å, R o (Cu–Se) = 2.02 Å, R o (In–Se) = 2.47 Å.
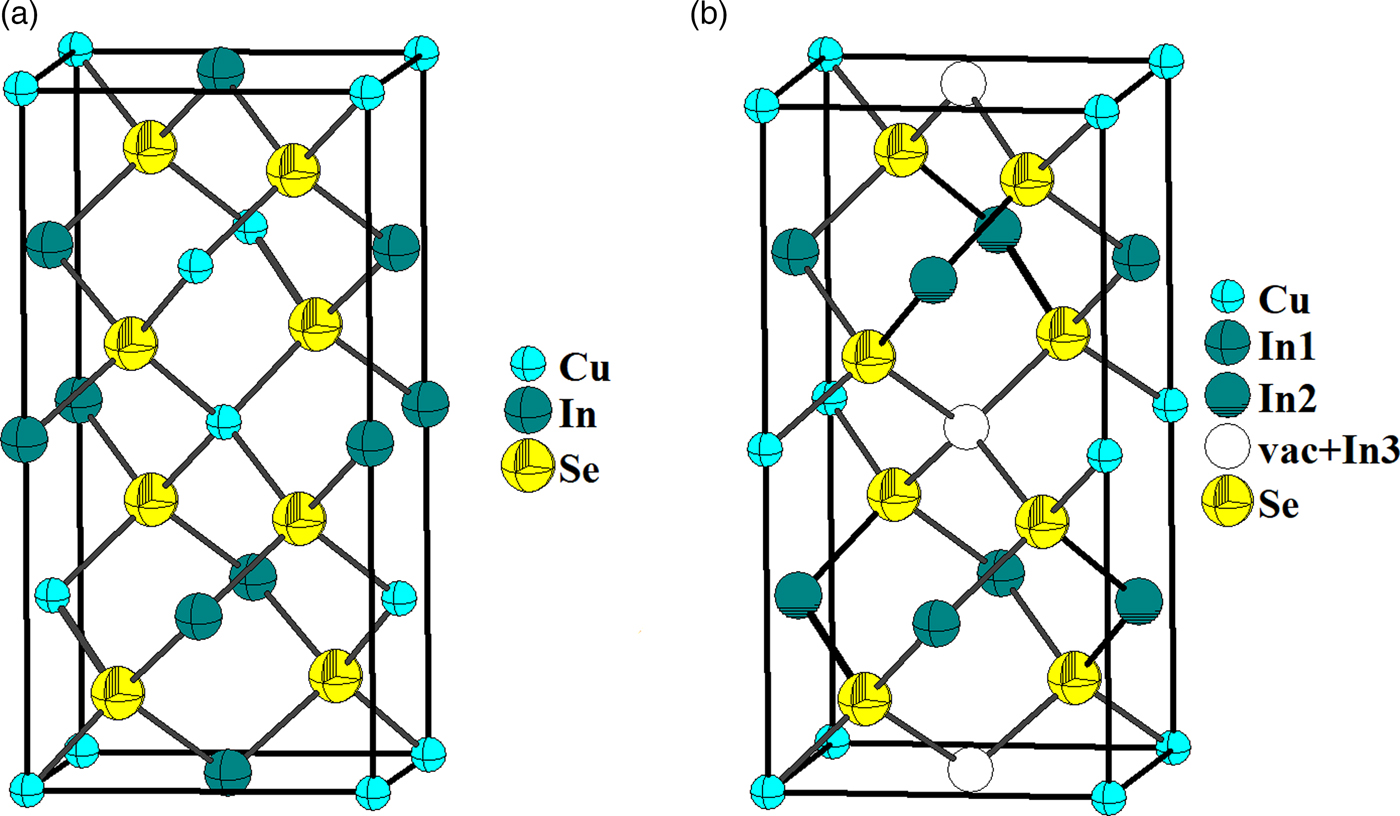
Cu2In14/3□4/3Se8 is a partial OVC (Zhang et al., Reference Zhang, Wei and Zunger1997), which crystalize in a P-chalcopyrite structure (Höenle et al., Reference Höenle, Kuehn and Boehnke1988), and consists of a three-dimensional arrangement of distorted CuSe4 and InSe4 tetrahedral connected by common faces. In this structure, each Se atom is coordinated by four cations (one Cu and three In) located at the corners of a slightly distorted tetrahedron. In the same way, each cation is tetrahedrally bonded to four anions. This array is expected for adamantane compounds (Parthé, Reference Parthé, Westbrook and Fleischer1995). Figure 2 shows the unit-cell diagram for Cu2In14/3□4/3Se8 compound compared with the chalcopyrite CuInSe2 parent, where it is possible to observe the different In cation sites and vacancy sites. In P-chalcopyrite structure, the introduction of the additional In cations produces its “dilution” in the chalcopyrite structure, which leaves the cell volume unchanged.
(Color online) Unit-cell diagram for the chalcopyrite (a) CuInSe2 compared with the new (b) P-chalcopyrite Cu2In14/3□4/3Se8.

The Cu–Se [2.419(8) Å] and In–Se [2.523(8) Å average] bond distances compare well with those observed in other adamantine structure compounds such as CuInSe2 (2.432–2.591 Å) (Knight, Reference Knight1992), Cu2FeSnSe4 (2.417 Å) (Roque-Infante et al., Reference Roque-Infante, Delgado and López-Rivera1997), Cu2SnSe3 (2.415 Å average) (Delgado et al., Reference Delgado, Mora, Marcano and Rincón2003), CuFe2(Al,Ga,In)Se4 (2.417–2.50 Å average) (Delgado et al., Reference Delgado, Mora, Grima-Gallardo and Quintero2008, Reference Delgado, Mora, Grima, Muñoz, Durán, Quintero and Briceño2015), CuFe(Al,Ga,In)Se3 (2.421–2.520 Å average) (Mora et al., Reference Mora, Delgado and Grima-Gallardo2007; Delgado et al., Reference Delgado, Mora, Contreras, Grima-Gallardo, Durán, Muñoz and Quintero2009), CuNi(Ga,In)Se3 (2.420–2.500 Å average) (Delgado et al., Reference Delgado, Mora, Grima-Gallardo, Durán, Muñoz and Quintero2010), Cu2GeSe4 (2.42 Å) (Choi et al., Reference Choi, Donohue, Marcano, Rincón, Gedvilas, Li and Delgado2013), CuZn(Al,Ga,In)Se3 (2.427–2.530 Å average) (Delgado et al., Reference Delgado, Grima-Gallardo and Quintero2016), CuMn2InSe4 (2.447–2.594 Å) (Delgado and Sagredo, Reference Delgado and Sagredo2016).
The chemical structural model was checked by the analysis of the interatomic distances using the BVS formula based on bond-strength examination (Brown and Altermatt, Reference Brown and Altermatt1985; Brese and O'Keeffe, Reference Brese and O'Keeffe1991). The commonly adopted expression for the BVS is v ij = exp[(R o−d ij)/B, where d ij is the interatomic distance and B is a “universal” constant equal to 0.37 Å. The values for the reference distance R o for Cu–Se and In–Se are 2.02 and 2.47 Å, respectively. Table IV also shows the BVS results for Cu2In14/3□4/3Se8, indicating that the oxidation state for each ion is in good agreement with the expected formal oxidation state of Cu+, In3+, and Se2− ions.
SUPPLEMENTARY MATERIAL
The supplementary material for this article can be found at https://doi.org/10.1017/S0885715618000519.
ACKNOWLEDGEMENTS
This work was supported by FONACIT (Fondo Nacional de Investigaciones Científicas, grant LAB-97000821).