

 ] are articulatorily and acoustically similar, and thus it is unusual for a language to use them contrastively (e.g. Ladefoged

1 Introduction
Words represented in English orthography with <t> are pronounced with an alveolar stop in English, while words represented by <th> are pronounced with dental fricatives, [θ] and [ð], in most varieties of English (Wells Reference Wells1982; Ó hÚrdail Reference Ó hÚrdail and Tristram1997). (Some research has shown that these fricatives are more consistently produced with an interdental gesture in American English and more often with the tongue behind the teeth in British English (Ladefoged & Maddieson Reference Ladefoged and Maddieson1996; McGuire & Babel Reference McGuire and Babel2012). To avoid overly specific descriptions here, the term ‘dental fricative’ is employed to refer to both kinds of production.) However, in some varieties, including Irish English (henceforth, IE) these dental fricatives correspond to surface dental stops. While most dialects of IE consistently differentiate alveolar and dental stops in production and perception, impressionistic investigations indicate that native speakers of American English have difficulty perceiving the difference. Indeed, Wells (Reference Wells1982: 429) even mentions that the contrast between the alveolar and dental stop ‘is not always obvious to a non-Irish ear’. This apparent difference between the groups points to the effect of language experience on the perception of contrasts, which has been investigated from the perspective of segments (e.g. Flege Reference Flege1984; Mann Reference Mann1986; Kuhl Reference Kuhl1991; McAllister et al. Reference McAllister, Flege and Piske2002; Best & Tyler Reference Best, Tyler, Bohn and Munro2007) and suprasegmentals (e.g. Xu et al. Reference Xu, Gandour and Francis2006; Francis et al. Reference Francis, Ciocca, Ma and Fenn2008; van Dommelen & Husby Reference van Dommelen, Husby, Watkins, Rauber and Baptista2009; DiCanio Reference DiCanio2012). Work on this issue has demonstrated that speakers are generally better at perceiving contrasts that are present in their native language than speakers who do not have this particular contrast in their language. The current investigation focuses not on a difference between two languages but a difference in the phonetic instantiation of a contrast between two dialects of the same language, namely Irish English and American English. This investigation adds to the literature on the relationship between production and perception. It also informs the literature on IE phonology, particularly from the less-investigated perspective of perception of language.
The following subsection (1.1) will describe the alveolar/dental contrast in IE and the corresponding contrast in American English (henceforth, AmE). Section 1.2 describes other languages that have an alveolar/dental contrast, and section 1.3 discusses work on the relationship between language experience and perception. Sections 2 to 4 then describe the experiment and results, and section 5 provides a discussion of the findings in the context of the relevant literature.
1.1 Coronals in Irish English and American English
Descriptions of Irish English note that for most speakers across the country, the segments generally written with <th> (which are dental fricatives [θ] and [ð] in most varieties of English) are pronounced as dental stops (Wells Reference Wells1982). For instance, the word tin has an alveolar stop while the word thin has a dental stop for most speakers of IE (Ó hÚrdail Reference Ó hÚrdail and Tristram1997). Some IE speakers have a merger to an alveolar stop (Ó hÚrdail Reference Ó hÚrdail and Tristram1997), and this merger is usually associated with speakers from rural areas, as well as the south of the country, and inner-city Dublin.Footnote 2 Speakers from the west (where the participants in the current investigation are from) are known to have the alveolar/dental contrast (Hickey Reference Hickey, Schneider, Burridge, Kortmann, Mesthrie and Upton2008). Hickey (Reference Hickey, Schneider, Burridge, Kortmann, Mesthrie and Upton2008) posits that the fricatives present in British English were replaced with dental stops by native speakers of Irish when they began to use English, since this was the closest equivalent in their first language.
It should also be mentioned here that a widespread phenomenon in IE is what is known as t-lenition (Hickey Reference Hickey1984; Pandeli et al. Reference Pandeli, Eska and Rahilly1997; Kallen Reference Kallen, Auer, Hinskens and Kerswill2005; Hickey Reference Hickey, Schneider, Burridge, Kortmann, Mesthrie and Upton2008). Words in which the voiceless alveolar stop /t/ follows a stressed vowel (bat, about, butter) and in words where /t/ is the coda of a weak syllable that follows a stressed syllable (such as bucket), the alveolar stop is often lenited, and produced as what has been described as a ‘slit-fricative’ (Kallen Reference Kallen2013). This is not otherwise relevant to the current study, so in order to focus on the issue in question, it was ensured that this sound did not occur among the stimuli used in the current perception experiment. This was done by choosing stimuli that had the alveolar stop rather than the slit-fricative. (This was done on an auditory basis by the author, since the slit-fricative is highly salient.)
General American English does not generally use the dental stop for words written with <th>; instead, it has a dental fricative (usually interdental) (Aschmann Reference Aschmann2015), except for some northern dialects and AAVE (Edwards Reference Edwards and Schneider2008; Gordon Reference Gordon and Schneider2008; Nagy & Roberts Reference Nagy, Roberts and Schneider2008; Thomas Reference Thomas and Schneider2008). This fricative is sometimes produced as a dental stop in running speech (Lavoie Reference Lavoie2002). Jongman et al. (Reference Jongman, Blumstein and Lahiri1985) also note that (American) English speakers sometimes produce alveolar stops as dental stops, presumably because since AmE does not contrast these as phonemes, speakers’ productions of alveolars are freer to move into the dental space. (This is different from Malayalam, where the acoustic properties (in this case, burst amplitude) are kept consistent for either alveolar or dental stops, because they are separate phonemes in this language.) A palatographic study with speakers of AmE from the Pacific coast found that across 20 speakers’ productions of words with the alveolar stop such as tap and pat, 7.7 per cent of articulations of <t> were dental, while 2.5 per cent of articulations of <d> were dental (Dart Reference Dart1991, Reference Dart1998). As such, AmE speakers have some experience with the dental stop, but only as allophones.Footnote 3 Furthermore, their experience with the dental stop allows it to conceivably be perceived as either an alveolar stop or a dental fricative, although the perception of it as an alveolar stop could be argued to be more likely based on the small acoustic difference between an alveolar stop and a dental stop, and the apparent higher frequency with which the dental stop is used as an allophone of the alveolar stop. It therefore remains to be determined whether they will be able to consistently categorise it as one of these (the dental fricative, in this case). The current investigation examines how well they can distinguish dental vs alveolar stops when the two are being specifically contrasted.
Likely due to limited experience with the dental stop, AmE speakers appear to have difficulty distinguishing the alveolar stop from the dental stop, something that IE speakers are impressionistically found to do with a high level of accuracy. Since IE has a dental stop where AmE has a dental fricative, the difference between the dialects is not in the distribution of these two sounds but in the phonetic realisation of the same phoneme. Under this analysis, these dialects are seen as having the same underlying system, but differences in the realisation of certain phonemes. This panlectal/polylectal approach is the most straightforward analysis, given the historical development of American English, which came from varieties of English from Britain and Ireland, as well as the consequential similarities and intelligibility between the two dialects, and the fact that the distribution of dental fricatives in AmE lines up with the distribution of dental stops in IE. Essentially, the dental stop is a phoneme for IE speakers, while it is a possible allophone for AmE speakers.
1.2 Languages with an alveolar/dental contrast
Although dental and alveolar stops are articulatorily and acoustically similar, there are other languages that contrast them. Cajun English is another variety of English known to exhibit dental stops rather than fricatives (Dubois & Horvath Reference Dubois and Horvath1998). Languages other than English that have an alveolar/dental contrast include Kimvita Swahili, spoken in Mombasa (Hayward et al. Reference Hayward, Omar and Goesche1989), Dinka, spoken in South Sudan (Remijsen & Manyang Reference Remijsen and Manyang2009), some Dravidian languages, such as Malayalam (Haowen Reference Haowen2010), as well as some languages of Australia, such as Yolngu (Morphy Reference Morphy, Dixon and Blake1983), Nunggubuyu (Hughes & Leeding Reference Hughes and Leeding1971), Yanyuwa (Huttar & Kirton Reference Huttar, Kirton, Gonzalez and Thomas1981) and Ngiyambaa (Donaldson Reference Donaldson1980). Therefore, the contrast is clearly sufficiently perceptible to be used, although it is typologically unusual.
1.3 Linguistic experience and perception
Research into the effect of linguistic experience has demonstrated that speakers are generally better at distinguishing contrasts that occur in their own language than those that do not (e.g. Flege Reference Flege1984, Reference Flege and Strange1995; Polka Reference Polka1989, Reference Polka1991; Strange Reference Strange, Tohkura, Vatikiotis-Bateson and Sagisaka1992, Reference Strange and Strange1995; Best & Strange Reference Best and Strange1992; Best Reference Best, Goodman and Nusbaum1994, Reference Best and Strange1995; Best & Tyler Reference Best, Tyler, Bohn and Munro2007). Work by Werker & Tees (Reference Werker and Tees1984) and Kuhl et al. (Reference Kuhl, Williams, Lacerda, Stevens and Lindblom1992) has shown that linguistic experience affects how infants process vowels and consonants within the first year of life. This effect of linguistic experience is also found in adults. Werker & Tees (Reference Werker and Tees1984) found that native adult speakers of English had difficulty distinguishing velar stops from uvular stops, since English does not have uvular stops, while speakers of Thompson Salish, which has this contrast, had no difficulty distinguishing the sounds. Likewise, speakers of Japanese often have difficulty distinguishing English /l/ and /r/ because these are not separate phonemes in Japanese (Mann Reference Mann1986).
On the other hand, contrasts that are in one's native language can also facilitate learning of a similar contrast in another language. McAllister et al. (Reference McAllister, Flege and Piske2002) found that native speakers of Estonian were more proficient at acquiring the segment length distinction in Swedish than either English or Spanish speakers, due to the fact that Estonian also has a length distinction. Similarly, speakers of Spanish and Russian tend to use duration rather than spectral cues to distinguish English tense and lax vowels, since their native languages use duration more than spectral differences (Kondaurova & Francis Reference Kondaurova and Francis2008).
While no work appears to have examined perception of the contrast between dental and alveolar stops by listeners who do not have it in their native dialect, one study found that speakers of AmE had difficulty perceiving the contrast between Hindi dental and retroflex stops (Pruitt et al. Reference Pruitt, Jenkins and Strange2006). In their study, AmE participants identified dental and retroflex stops with only 50–60 per cent accuracy. The authors interpret this as the AmE speakers categorising both Hindi stops as alveolar stops.
Similar patterns have been found for suprasegmentals. For example, Mandarin speakers were found to categorically perceive F0 contours that were along a continuum from level to rising, while English speakers did not show categorical perception, due to the fact that Mandarin has lexical tone while English does not (Xu et al. Reference Xu, Gandour and Francis2006). The language experience of Mandarin speakers caused them to perceive the tonal contours linguistically and thus divide them into two categories. Research on the perception of pitch in Yucatec Maya has shown a correlation between what speakers use in tone production and what cues they use in perception (Frazier Reference Frazier2009).
Overall, these results show an effect of linguistic experience on the perception of sound contrasts. Based on this research, an identification experiment was set up to compare IE and AmE speakers in terms of their perception of the alveolar/dental contrast. It was hypothesised that since IE speakers have this phonemic contrast while AmE speakers do not, IE speakers would be more accurate and have a faster reaction time than AmE speakers at identifying words that differ only in whether they have an alveolar or dental stop.
2 Method
2.1 Stimuli
Stimuli were recorded by a female native speaker of Irish English, aged 30, who produced the words in isolation. All words appear in the appendix. Stimuli consisted of 24 words in total, that is, 12 minimal pairs containing the dental/alveolar contrast in either word-initial or word-final position. The breakdown of position and voicing was as follows:
• Initial voiceless stops: 3 pairs
• Final voiceless stops: 3 pairs
• Initial voiced stops: 3 pairs
• Final voiced stops: 3 pairs
Stimuli were limited to 3 pairs for each condition to ensure that there were no extra repetitions of some target words. The pairs, for example boat/both, were then manipulated when necessary so they had the same pitch, intensity and vowel duration. (A noted vowel duration difference in some pairs will be discussed in section 4.)
2.2 Participants
Participants were 10 (7 females, 3 males) adult native speakers of Irish English and 10 (1 male, 9 females) of American English, aged 18–30. The IE participants were from Galway City, on the west coast of Ireland, and the AmE participants were all speakers of General American English (that is, none had impressionistically strong Southern accents, for example), living in Austin, Texas. None was proficient in any language other than English. Participants were recruited by word of mouth. All participants completed a consent form and a language background questionnaire.
2.3 Procedure
Participants took part in a two-alternative forced choice task. The experiments were presented in PsychoPy (Peirce Reference Peirce2007). Participants were seated in a quiet room in front of the experimenter's laptop.
In the identification task, the participant heard one word at a time and was asked to choose which of two words on-screen they had heard. The word with the alveolar stop (written with <t> or <d>, such as den) always appeared on the left of the screen and that with the dental stop (<th>, such as then) always appeared on the right. Each word was repeated eight times, meaning that each condition contained 24 tokens. That is, alveolar initial voiceless had 24, dental initial voiceless had 24, and so on. These were presented in eight blocks of 24 (192 in total), so one example of each token appeared in every block. There were two initial practice trials using words that were not part of the experiment. The participant's response for one trial initiated the following trial. There was a blink of the screen to indicate that a new trial had begun. If they did not respond within 1.5 seconds after the target word, it moved to the next trial.
After completing the perception experiment, participants were asked to read out the target words while being recorded. This was to examine their productions to determine whether the IE speakers had the alveolar/dental contrast or a merger, and to ensure that the AmE participants had a contrast between an alveolar stop and a dental fricative. The target words from the perception experiment were presented in list form on three powerpoint slides. All the words appeared once per slide, in different orders. Participants read out the words while being recorded through the program Audacity. In total, the perception experiment took about 15 minutes and the production experiment approximately 2 minutes.
2.4 Measurements
2.4.1 Perception
Identification results were measured by accuracy. These were subjected to a logistic regression using the glmer function in R (R Development Core Team 2008), where the dependent variable was accuracy (1 or 0). Likelihood ratio tests using the anova function determined which model was a best fit for the data. Reaction times for correct responses were also analysed, using a linear regression in the lmer function in R.
2.4.2 Production
Participants’ production of the target words was examined impressionistically by two trained phoneticians to determine whether they all produced a contrast in these words and if so, what sounds they used. The AmE speakers all contrasted alveolar stops with dental fricatives, as expected. All IE speakers had the alveolar/dental contrast. (Some IE speakers produced the ‘slit-fricative’ instead of the alveolar stop in final position in some words.)
A further analysis focused on vowel duration in two of the minimal pairs. It was noted that the original stimuli (produced by the IE speaker) that contained a final voiceless dental stop and an open vowel (such as bath, path) were produced with a longer vowel than their alveolar stop counterparts (bat, pat). (The other word pairs did not reveal any such difference.) For that speaker, those stimuli with a final alveolar stop had an average vowel duration of about 100 milliseconds while those with a final dental stop were about 200 milliseconds. For this reason, these stimuli were not used in the perception experiment, but participants were asked to produce them, in order to allow for an analysis of vowel duration.
Finally, to provide further acoustic information on the difference between the dental and alveolar stops, the IE participants’ production of voiceless initial stops was examined in terms of voice onset time (VOT). Here, VOT was measured as the time (in milliseconds) from the initial burst release, marked by a sudden onset of noise in the waveform, to the onset of voicing, as described in Lisker & Abramson (Reference Lisker and Abramson1970: 9–10): ‘the interval between the release burst and the onset of laryngeal pulsing’. Previous work (Lisker & Abramson Reference Lisker and Abramson1964) has shown different amounts of VOT of initial voiceless stops based on place of articulation, thus explaining the decision to examine this measure in the current study. This work found that in English, /p t k/ had VOTs of 60, 70 and 80 milliseconds, respectively. For languages as diverse as, for example, English, Hungarian and Korean, they found that VOT increased as the place of articulation became further back in the vocal tract. Cho & Ladefoged (Reference Cho and Ladefoged1999), referring to Maddieson (Reference Maddieson, Hardcastle and Laver1997), explain that this pattern may be caused by the fact that for a velar stop, there is a larger body of air in the mouth than there is for an alveolar or bilabial stop, so this takes longer to be released. Similarly, since the space behind a velar closure is smaller than for a bilabial or alveolar stop, the air pressure behind the closure is higher, so it takes longer for this high pressure to fall. If this pattern holds, in the current study it would be expected that dental stops have a shorter VOT or less aspiration than alveolar stops. The production results will be discussed in section 4.
3 Perception results
3.1 Results: accuracy
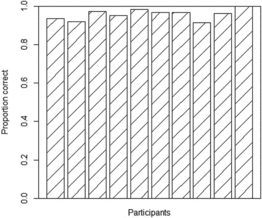
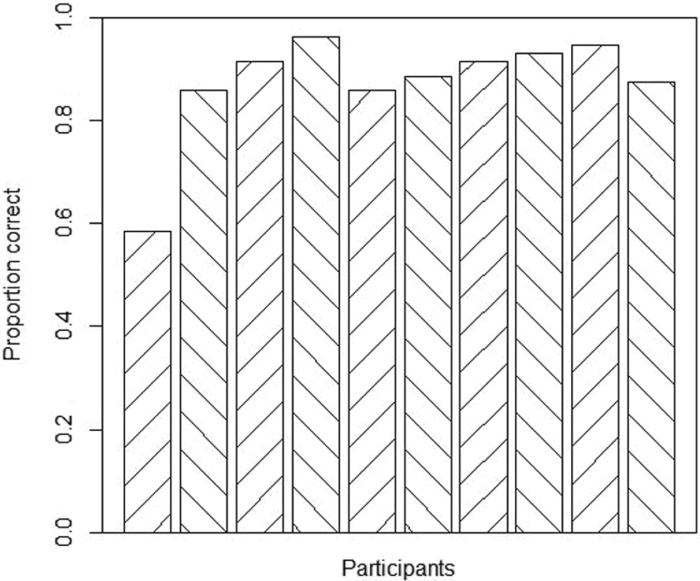
Overall correct responses by participant are shown in figures 1 and 2. A high level of accuracy can be see for both groups.
Identification results for IE speakers

Identification results for AmE speakers

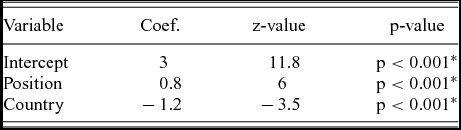
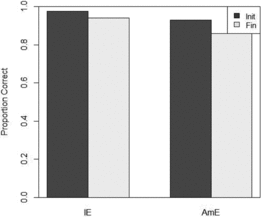
Logistic regression models were built up and compared using likelihood ratio tests. These were built by adding terms one by one and comparing models to determine which model best explained the data. Terms tested were: Country (IE or AmE), Block (to test for a training effect), Position (whether the contrast was initial or final in the word) and Voicing (/t/ vs /d/). Participant was included as a random effect. While a model including only Country as a predictor variable was better than the null model (p = 0.001), and a model including only Position was significantly better than the null model (p < 0.001), the best model to explain the data was one that included both Country and Position (p = 0.001) (table 1): glmer(accuracy ~ Country + Position + (1|Participant), family=binomial). These results showed that, as in figure 3, while both groups of participants had high accuracy when the contrast was in initial position (for example, tin vs thin), the AmE group did worse when the contrast was in final position (for example, tent vs tenth) (average accuracy 86 per cent).
Statistical results for the best model

Note: The reference level for position is ‘initial’ and country is ‘IE’.
Average results pooled across participants, by country and position

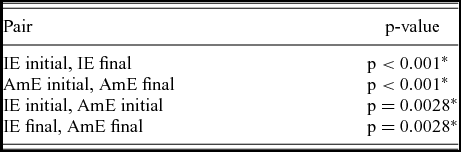
Pairwise post-hoc tests using the lsmeans package gave the results shown in table 2. It was found that both groups of participants did significantly better in the initial condition than in the final condition. The groups were significantly different from one another in both conditions also.
Pairwise statistical results by country and position

3.2 Results: reaction time
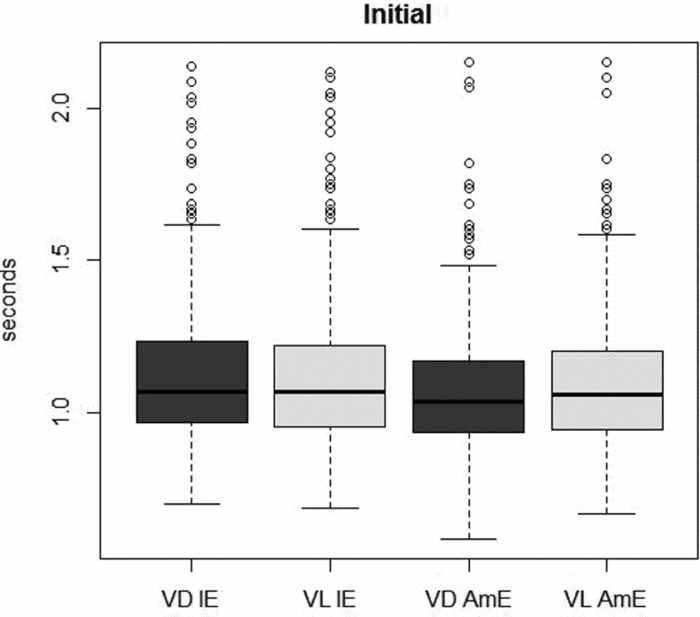
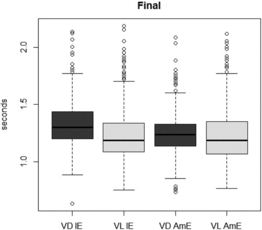
For all the correct answers, reaction time was examined. Since the listeners had to wait for the end of the word to respond when the contrast was in final position, the initial and final position conditions were examined separately. Figures 4 and 5 show the results for initial and final position, respectively.
Reaction time in initial position, for voiced (VD) and voiceless (VL) segments by country

Reaction time in final position, for voiced (VD) and voiceless (VL) segments by country

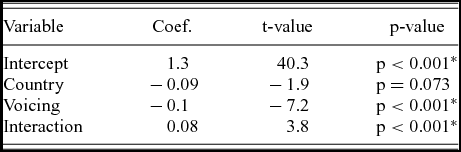
A linear regression was run on the reaction time for correct answers, using the lmer function in R. As mentioned, initial and final position were examined separately. Likelihood ratio tests were used to determine which model best explained the data. As before, the models were built up by term (Country and Voicing) and then compared to see which model was the best fit. For initial position, no model fitted the data better than the null model, indicating that there was no significant effect of Country or Voicing on reaction time. For final position, these tests showed that a model with an interaction of Country by Voicing was the best fit (R code: lmer(accuracy ~ Country * Voicing + (1|Participant), data=final)). These results are shown in table 3. Pairwise comparisons using lsmeans showed that when the contrast was in final position, the AmE participants did not differ based on voicing, and did not differ from the IE participants, but the IE participants responded significantly faster in the voiceless condition than the voiced condition.
Statistical results for the best reaction time model for final position

Note: The reference level for voicing is ‘voiced’ and country is ‘IE’.
4 Production results
The first part of the analysis of the audio recordings focused on the open vowel pairs, since a vowel duration difference was noted for the original IE speaker. Recordings of 9 IE participants (7 females, 2 males) and 8 of the AmE participants (7 females, 1 male) were analysed.Footnote 4 The vowels were manually labelled and then a Praat script (Boersma & Weenink Reference Boersma and Weenink2011) was used to measure vowel length in these pairs. As mentioned above, the words were read out, in isolation, from Powerpoint slides. Vowel duration was measured as beginning with voicing pulses and ending where the spectrogram got lighter and the waveform less uniform, signalling the end of voicing. This meant that for words beginning with <p>, the aspiration was not included as part of the vowel. For the IE speakers’ words with a final voiceless stop, pre-aspiration occurred in most instances. This was included as part of the vowel. There were three repetitions of each token (bat, pat, bath, path) per speaker, giving 3x4x17=204 tokens in total. Two tokens were discarded due to noise, leaving 202 tokens for analysis.
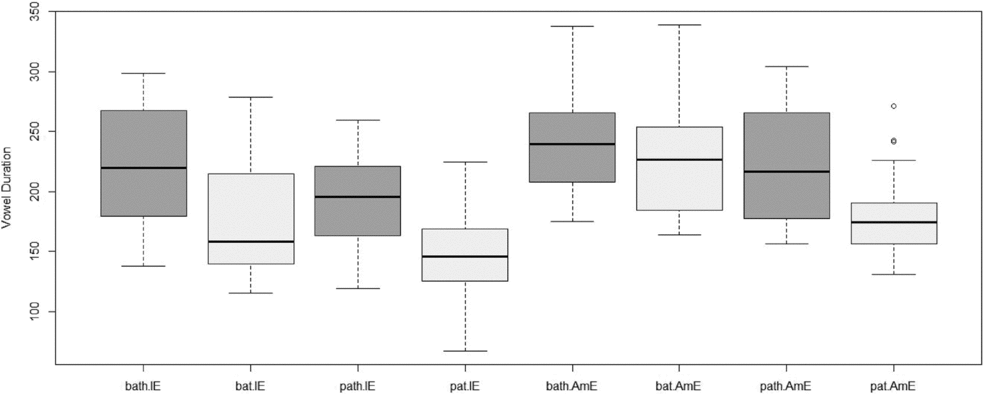
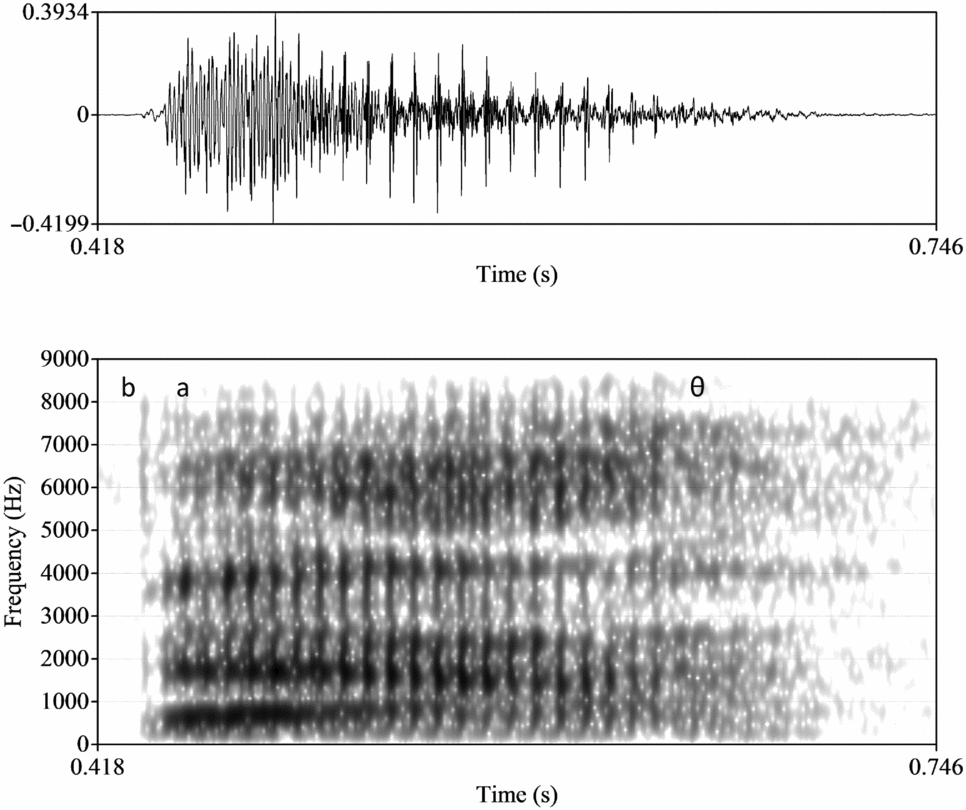
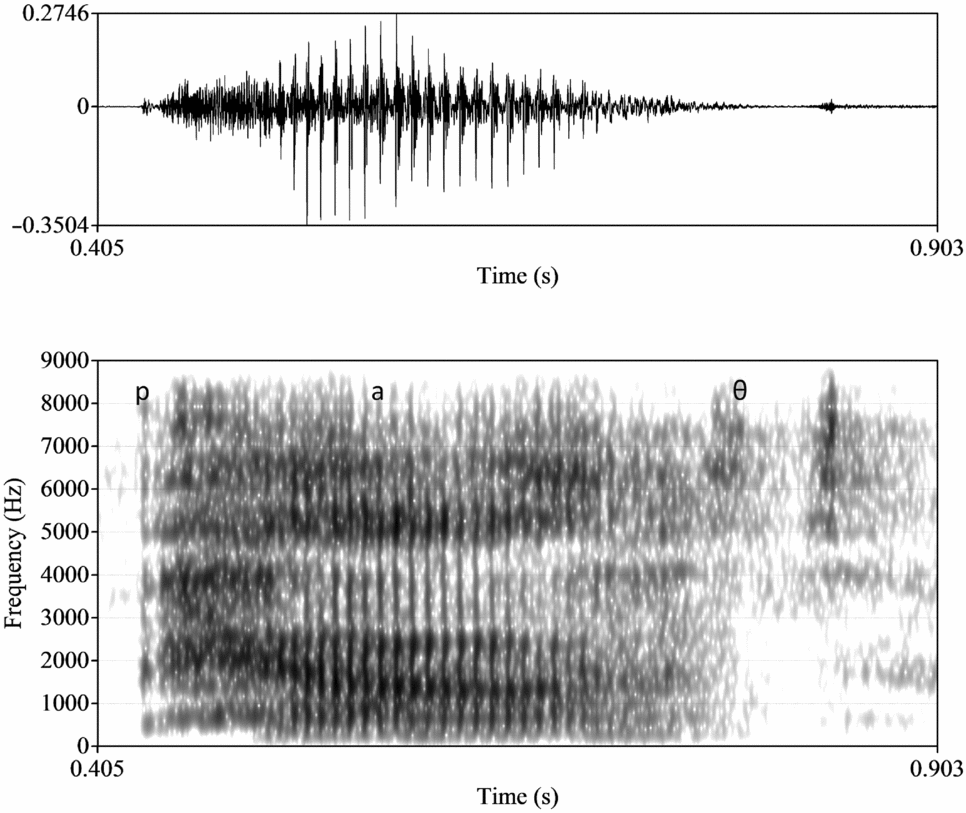
Figure 6 shows average vowel duration for bat/pat versus bath/path, by speaker country. It can be seen that for both groups, bath had the longest vowel, and pat the shortest. For the IE speakers, the average duration of bath is longer than that of bat (first two boxes), while for AmE speakers the difference, if any, is much smaller. For both groups, path appears longer than pat.
Average vowel duration pooled across participants, by country, final sound (<t> or <th>) and initial stop (/b/ or /p/). IE speakers are the four boxes on the left, AmE speakers the four boxes on the right. The darker boxes are those ending in <th> (bath/path) and the lighter boxes ending in <t> (bat/pat).

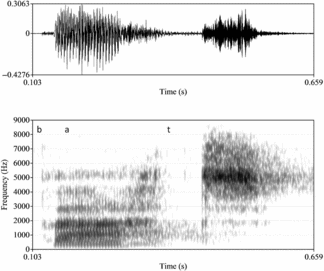
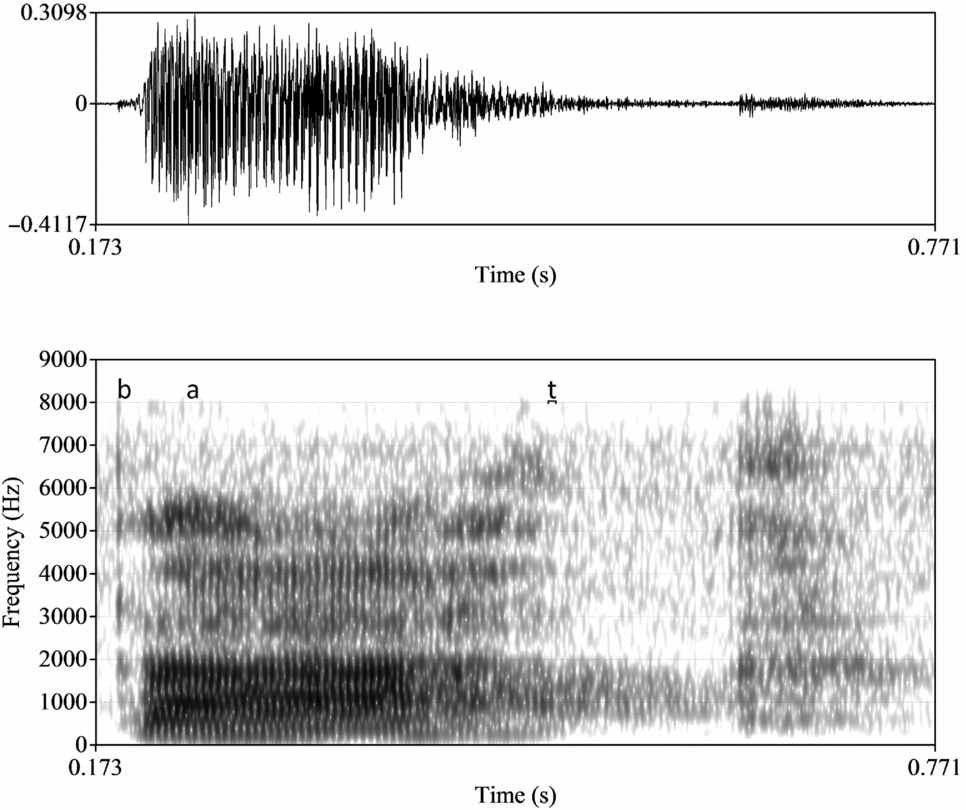
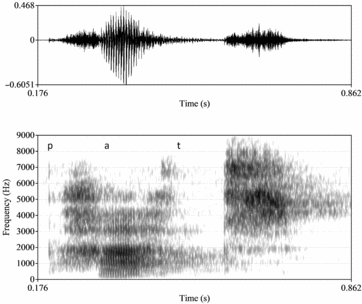
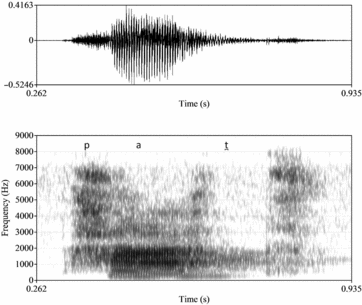
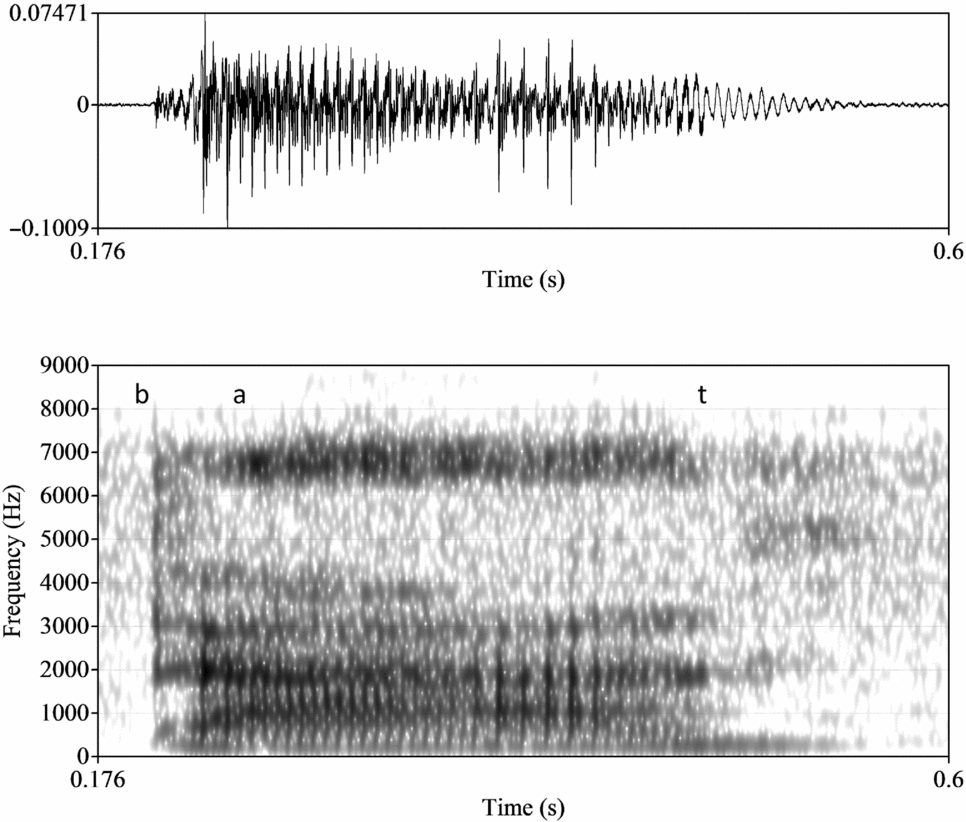
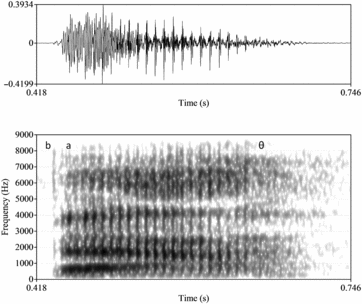
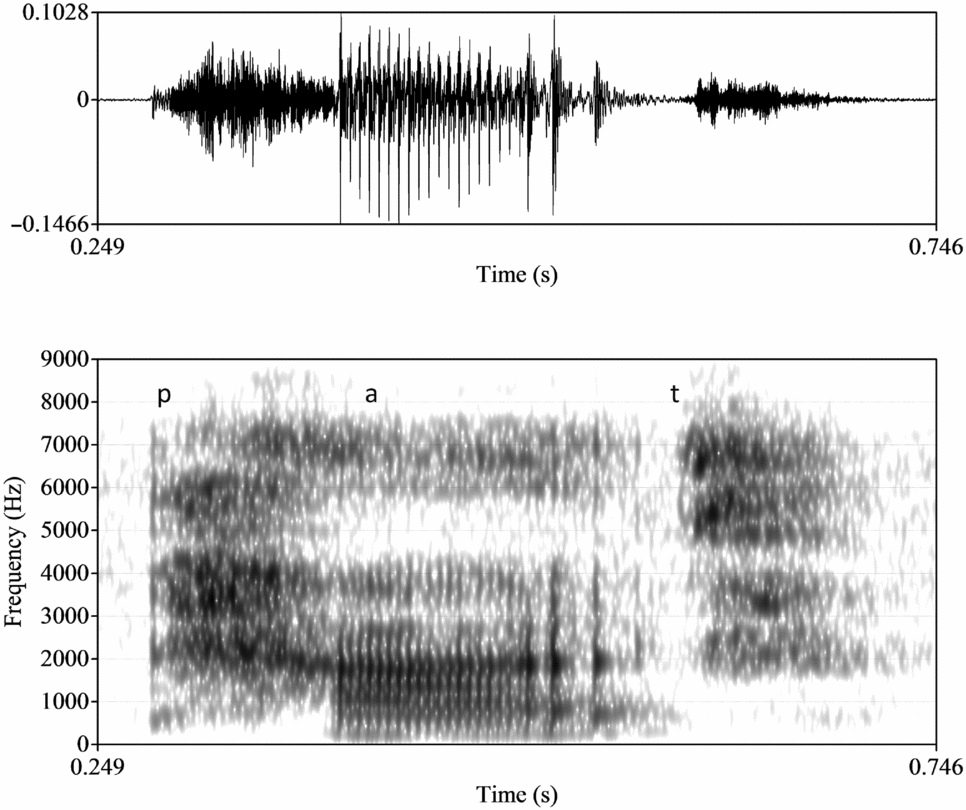
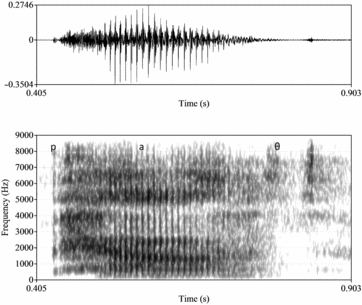
Figures 7–14 show spectrograms for all four words for one female IE speaker and one female AmE speaker.
Spectrogram of bat for one IE speaker

Spectrogram of bath for one IE speaker

Spectrogram of pat for one IE speaker

Spectrogram of path for one IE speaker

Spectrogram of bat for one AmE speaker

Spectrogram of bath for one AmE speaker
Spectrogram of pat for one AmE speaker

Spectrogram of path for one AmE speaker
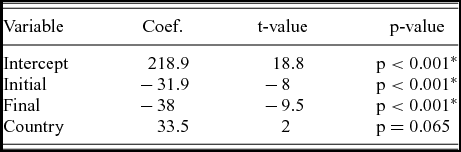
These measurements were subjected to a linear regression, with Country, Final (<t> or <th>) and Initial (whether the initial consonant was /b/ or /p/) as possible predictor variables. Models were built up term by term, as before, and compared using likelihood ratio tests (anova) to determine which model best explained the data. Speaker was included as a random factor. The model that best explained the data was one that included all three termsFootnote 5 (R code: lmer(duration ~ Initial + Final + Country + (1|Speaker)), and the summary of this model is shown in table 4.
Statistical results for the best duration model

Note: The reference level for Initial is /b/, for Final is <th>, and country is IE.
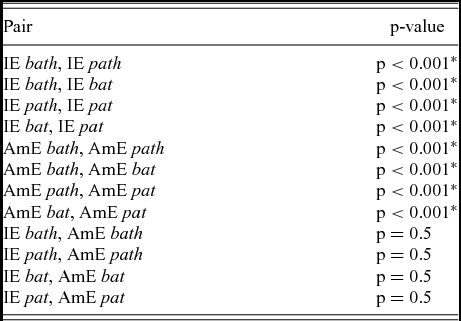
Pairwise tests using the lsmeans function showed that for IE speakers, there were significant differences between bath and bat, between path and pat, and also between bath and path, and between bat and pat. Parallel results were found for AmE speakers. This shows that both final sound and initial sound had significant effects on vowel duration, where the vowel in words ending in <th> was longer than that of words ending in <t> for both groups, and the vowel in words beginning with /b/ was longer than that of words beginning with /p/. There were no significant differences between the IE and AmE speakers for any word. As mentioned above, the IE speakers generally had pre-aspiration in words with final voiceless stops (average 72 milliseconds, both alveolar and dental), and this was included as part of the vowel. This did not occur in words with final voiced stops, or for any of the AmE speakers. Since this occurred for both alveolar and dental stops, it does not account for the difference in vowel duration between these two. Table 5 shows the pairwise results.
Pairwise statistical results for duration

These results further show that the vowel duration difference between bath and bat was not just present for IE speakers, but also for AmE speakers. For IE speakers, the final segment difference between the two words is in place of articulation, between an alveolar and dental stop, while for the AmE speakers it is a difference in both place and manner of articulation, between an alveolar stop and a dental fricative.
The amount of VOT when the voiceless alveolar and dental stops were word-initial was measured, with the finding that for all speakers, the alveolar stop <t> had longer VOT (by 12–22ms) than the dental stop <th> before the same vowel. The pooled results voiceless for initial dental and alveolar stops produced by IE speakers are shown in table 6.
VOT (milliseconds) pooled across IE speakers

These results will be discussed in section 5.2.
5 Discussion
5.1 Perception
The perception results consisted of two parts: accuracy and reaction time.
Overall, the AmE participants did better than was expected at the identification task. The hypothesis was that due to phonetic similarity, AmE speakers would map alveolar and dental stops onto the same (alveolar) category (Flege Reference Flege and Strange1995), but the results indicate that this was not the case.
Furthermore, no effect of Block was found, indicating that there was no training during the experiment, and participants did well from the beginning. It may be that since the words were produced in isolation, listeners were able to attend more to the contrast than they would in running speech. This suggests that the AmE participants were perhaps focusing on the acoustic properties of the relevant stops, rather than processing them as words. Similar to what Dupoux et al. (Reference Dupoux, Christophe, Sebastian Galles and Mehler1997) found with French speakers processing word accent, it may be that the AmE participants here were able to perform well at the task because their responses were required immediately. If the task were made more difficult by increasing the memory load of participants, it is possible that AmE participants would not be able to encode the information at a higher level. While the current results show that language experience has an influence, by the result that IE speakers were more accurate than AmE speakers, the fact that these varieties are two versions of the same language may have facilitated the AmE speakers in the task. Much research has focused on comparing speakers of different languages rather than different dialects of the same language. It may be that the AmE speakers were aided by understanding the lexical items. Perhaps an experiment using nonce words or just auditory materials would show different results. However, even using nonce words presented in English orthography would drive the listeners towards some form of linguistic processing. For this reason, a setup with only auditory presentation of materials may be preferable.
As noted in the introduction, AmE speakers may have the dental stop allophonically. Therefore, the experiment required these listeners to identify an orthographic word such as <both> as having a final dental stop, meaning that the listeners may in fact be using their awareness of how an Irish person would say the word.Footnote 6 An experiment involving just sounds rather than whole words could perhaps determine whether the AmE participants are in fact doing this. While the IE participants were asked to distinguish contrasting sounds or separate phonemes, the AmE participants had the more challenging task of distinguishing possible allophonic variants of the same phoneme (for these participants, both [t] and [ ] could be realisations of /t/). Their success at doing this indicates that perhaps their possible exposure to the dental stop (even just as an allophone) assisted their processing of this sound. Especially comparing the current results to those of Werker & Tees (Reference Werker and Tees1984), where native speakers of English were poor at distinguishing velar stops from uvular stops, it appears that in the current study, AmE participants may have done relatively well because they may have experience with the dental stop, even though only allophonically.
It was also found that both AmE and IE participants did significantly worse when the contrast was in final position than when it was in initial position. However, accuracy in the final condition was still high. It is unclear why the IE speakers had a significantly faster reaction time when the segments were voiceless, but only in final position, while there was no such difference found for the AmE participants.
5.2 Production
The audio recordings showed that both IE and AmE speakers produced words ending in <th> (bath, path) with significantly longer vowels than words ending in <t> (bat, pat). Words beginning with /b/ were also longer than their counterparts beginning with /p/.
While conclusions based on these results are preliminary due to the words being produced in isolation, the results indicate that there is indeed a vowel duration difference for both groups of speakers based on the final segment. The phonetic explanation of these results differs based on the group's production of the final sound. While it is well known that vowels are longer before voiced than voiceless consonants (House & Fairbanks Reference House and Fairbanks1953; Peterson & Lehiste Reference Peterson and Lehiste1960; House Reference House1961), the difference in the current study was in place and/or manner, but not voicing. With regard to the AmE speakers, a few studies have also found that vowels are longer before fricatives than before stops (Raphael Reference Raphael1972; Sokolović-Perović Reference Sokolović-Perović2009), so the results for this group are not surprising, and indeed support the limited research found on this topic. However, it appears that no research has shown a vowel duration difference before stops based on place of articulation.
The question arises as to whether the vowel duration difference or the dental/alveolar difference is the more important cue for listeners. The results of the perception study indicate that IE listeners have no difficulty in distinguishing the two types of stop even in word-final position; however, the words that contained a vowel duration difference were not included in the perception experiment. It may be that in IE, a final contrast in place of articulation is known to be perceptually small, so for some vowels at least, there is a compensation by using vowel duration as a further acoustic correlate of the contrast. A further study involving manipulation of vowel duration could be used to determine whether listeners use this cue or the stop cue to distinguish words such as bat and bath.
While not the main focus of the study, a further finding was that for both groups, the vowel in words beginning with the voiced bilabial stop was significantly longer than the vowel in their counterparts beginning with the voiceless bilabial stop. Recall that aspiration was not included as part of vowel duration. (For the voiceless stop, aspiration was 70–90 milliseconds, while for the voiced stop, aspiration was 0–20 milliseconds.) Peterson & Lehiste (Reference Peterson and Lehiste1960) examined the effect of multiple possible acoustic correlates on vowel duration. In terms of preceding stops, when aspiration was included in the measurement, vowels were longer after voiceless stops than voiced stops, as would be expected. When aspiration was not included, ‘the syllable nucleus following a voiceless plosive is usually shorter than that following a voiced plosive’ (Reference Peterson and Lehiste1960: 701). The authors conclude that there is no reliable effect of voicing of the initial consonant on the duration of the following vowel. Heffner (Reference Heffner1940) compared vowel duration in minimal pairs beginning with voiced versus voiceless stops. Again, when counted from the initial release rather than the beginning of voicing, vowels were longer after voiceless stops. However, when only the voicing part of the vowel was measured – as in the current study – he found different results for different pairs, with sometimes the vowel being longer after an initial voiced consonant and sometimes longer after a voiceless consonant. Finally, different speakers also showed different patterns in that study. In the current investigation, it was consistently found that vowels were longer after voiced stops, but a caveat is that only two words pairs were examined.
For VOT, it was found that for IE speakers, the dental stop had a shorter VOT than the alveolar stop. These results are in line with previous work, whereby the further back in the vocal tract the closure occurs, the longer the VOT (e.g. Lisker & Abramson Reference Lisker and Abramson1964). An alveolar closure is further back than a dental closure; however, the difference between a dental and alveolar place of articulation is smaller than the difference between, for example, a bilabial and alveolar place of articulation, yet, the universal pattern holds. It is likely that this difference of 12–22 milliseconds is used as a cue by listeners to distinguish the stops. In a study examining listeners’ perception of place of articulation of voiced bilabial, alveolar and velar stops, Hazan & Rosen (Reference Hazan and Rosen1991) note individual variability in the cues listeners use, with some relying more on burst duration and some on formant transitions. Future perception experiments manipulating VOT would be required to determine how much listeners weight the VOT duration cue for the dental versus alveolar contrast here.
5.3 Conclusions and future research
The perception experiment in the current study had three main findings. Contrary to the hypothesis, AmE participants had a high level of accuracy in identifying words that contained either an alveolar or a dental stop, even though this contrast is not in their native dialect. It is possible that their exposure to the dental stop as an allophone of either the alveolar stop or the dental fricative may have aided their processing of this sound. In line with the hypothesis, they did significantly worse than the IE participants. Both groups also did significantly worse when the contrast was in final position than when it was in initial position.
The production experiment found that for both groups of speakers, vowels were longer in bat and bath than in pat and path. Vowels were also longer in words ending in <th> than in words ending in <t> (bat, pat). For AmE speakers, this was explained by vowels being longer before fricatives than before stops, but for IE speakers, the finding that the vowel /a/ was longer before a dental stop than before an alveolar stop is new. This could be simply due to a place of articulation difference, although this has not been discussed in previous work, or it may even perhaps be an emerging vowel contrast in the language variety (although an argument for this would require further research in both production and perception). A perception experiment manipulating vowel duration could be used to determine whether this or place of articulation of the final stop is a more salient cue for listeners to distinguish words such as bat and bath. An examination of such words produced in natural speech rather than in wordlists would also clarify whether this vowel duration difference occurs in running speech. The finding that for word-initial voiceless stops, the VOT was longer for alveolar stops than for dental stops is in line with research on VOT and place of articulation. Once again, a perception experiment manipulating VOT would be necessary to determine if this is the main cue that listeners use to distinguish these two stops.
The current investigation adds insight into the relationship between production and perception. It appears that no other perception studies have yet been conducted on Irish English, particularly comparing speakers of two different dialects of English. The results found here indicate that while linguistic experience has an effect – shown by the higher accuracy among IE participants than among AmE participants – the AmE participants did well even without this experience, so were likely to be using a more acoustic than linguistic perception to hear the difference, and/or in fact were tuning into differences in the phonetic detail of the segments as opposed to making their judgements solely using their phonological system. Finally, the current study adds preliminary data on the acoustic differences between the dental and alveolar stops in IE.
Appendix: Test words