1. Introduction
Cirrus clouds cover approximately
 $20\, \%$
of the Earth’s atmosphere and are a major component in weather and climate research since they affect the radiation field of the Earth–atmosphere system (Liou Reference Liou1986). At a microphysical level, these clouds are composed of anisotropic ice crystals that scatter sunlight (Baran & Francis Reference Baran and Francis2004). Such clouds are necessarily turbulent (Smith & Jonas Reference Smith and Jonas1996), hence the basic mechanism – that of a turbulent suspension of anisotropic particles – at the heart of this problem is most usefully studied with tools of turbulent transport and statistical physics. Of course, such suspensions are not unique to cold clouds but are seen in a wide variety of phenomena (Voth & Soldati Reference Voth and Soldati2017). These range from paper-making processes involving cellulose fibres (Lundell et al. Reference Lundell, Söderberg and Alfredsson2011), the use of biopolymers in pharmaceuticals and cosmetics (Erni et al. Reference Erni, Cramer, Marti, Windhab and Fischer2009), soot particles in combustion affecting the radiative forcing (Moffet & Prather Reference Moffet and Prather2009) to pollen dispersion (Sabban & van Hout Reference Sabban and van Hout2011), and the dynamics of marine microorganisms (Pedley & Kessler Reference Pedley and Kessler1992; Gupta et al. Reference Gupta, Roy, Saha and Ray2020).
However, despite their ubiquity, studies of turbulent suspensions of anisotropic particles, such as spheroids, are fairly recent. This is especially true when compared to the enormous progress made in our understanding of suspensions of small, spherical particles (Brandt & Coletti Reference Brandt and Coletti2022; Bec et al. Reference Bec, Gustavsson and Mehlig2024). Remarkably, the understanding of such simpler suspensions has been exploited successfully to answer specific and important questions related to warm clouds, such as collisions (Mei & Hu Reference Mei and Hu1999; Ayala et al. Reference Ayala, Rosa, Wang and Grabowski2008; Saw et al. Reference Saw, Bewley, Bodenschatz, Ray and Bec2014; Ireland et al. Reference Ireland, Bragg and Collins2016; Picardo et al. Reference Picardo, Agasthya, Govindarajan and Ray2019), coalescences (Grabowski & Wang Reference Grabowski and Wang2013; Bec et al. Reference Bec, Ray, Saw and Homann2016; James & Ray Reference James and Ray2017), and settling of water droplets (Bec et al. Reference Bec, Homann and Ray2014; Naso et al. Reference Naso, Jucha, Lévêque and Pumir2018) – all of which relate to the problem of rain initiation (Falkovich et al. Reference Falkovich, Fouxon and Stepanov2002; Shaw Reference Shaw2003).
Answering similar questions for cold clouds is harder. This is because the anisotropic particles have not only additional degrees of freedom but also forces and torques that depend on their orientations. These, as we will see below, lead to a much more complicated set of equations of motion, which needs more care in its numerical implementation and interpretation. Indeed, while important results have emerged on the effects of anisotropy in turbulent flows, these have largely been in the context where either the gravitational effects are neglected (Roy et al. Reference Roy, Gupta and Ray2018; Gupta et al. Reference Gupta, Roy, Saha and Ray2020; Allende & Bec Reference Allende and Bec2023) or the effects of gravity are not included consistently across all the aspects of particle dynamics (Pumir & Wilkinson Reference Pumir and Wilkinson2011; Gupta et al. Reference Gupta, Vincenzi and Pandit2014; Siewert et al. Reference Siewert, Kunnen, Meinke and Schröder2014a ; Gustavsson et al. Reference Gustavsson, Jucha, Naso, Lévêque, Pumir and Mehlig2017; Jucha et al. Reference Jucha, Naso, Lévêque and Pumir2018). Matters are further complicated by observations of a wide variety of shapes and sizes that these crystals come in (Pruppacher & Klett Reference Pruppacher and Klett2010).
To correctly account for the motion of anisotropic particles settling in turbulence, one needs to first study the motion of the aforesaid particles settling in a quiescent ambient in the presence of small but finite fluid inertia. The earliest of these studies was done by Cox (Reference Cox1965), who calculated the gravity-induced torque to
 $O(Re_s)$
on a spheroid of small eccentricity, and later, Khayat & Cox (Reference Khayat and Cox1989) obtained this torque for a slender body; here,
 $Re_s$
is the Reynolds number based on the settling speed of the particle. The analogous calculation for a spheroid of arbitrary aspect ratio – a compelling model for ice crystals – was performed only recently by Dabade et al. (Reference Dabade, Marath and Subramanian2015). In all of the aforementioned scenarios, the gravity-induced torque acts to orient both prolate and oblate spheroids in a broadside-on orientation. When settling in a turbulent flow, besides the gravity-induced torque, such spheroids are acted upon by a turbulent shear-induced torque. It is the competition between these two torques that gives rise to interesting orientation dynamics for settling spheroids as reported recently in Sheikh et al. (Reference Sheikh, Gustavsson, Lopez, Lévêque, Mehlig, Pumir and Naso2020, Reference Sheikh, Gustavsson, Lévêque, Mehlig, Pumir and Naso2022), Anand et al. (Reference Anand, Ray and Subramanian2020) and Gustavsson et al. (Reference Gustavsson, Sheikh, Naso, Pumir and Mehlig2021). In particular, such modelling has led to an understanding of the origins of a broadside-on orientation (Gustavsson et al. Reference Gustavsson, Sheikh, Lopez, Naso, Pumir and Mehlig2019) of ice crystals in turbulent cirrus clouds. However, this is just one of the important characterisations for anisotropic particles, while fundamental questions of pair statistics, involving collision and coalescence rates, remain largely unexplored.
In this paper, we answer these questions and make a careful study of the effects of particle shape and size in determining the nature of small-scale clustering and the effective approach rates of colliding particles in a sedimenting, turbulent suspension of spheroids. While not actually resolving collisions in our system, akin to the ghost collision approach (Wang et al. Reference Wang, Wexler and Zhou1998; Ayala et al. Reference Ayala, Rosa, Wang and Grabowski2008) used extensively for spherical particles, the measurement of such approach rates forms the building blocks for modelling the collision kernels in ice-laden clouds (Sheikh et al. Reference Sheikh, Gustavsson, Lévêque, Mehlig, Pumir and Naso2022).
2. Formulation
We perform direct numerical simulations (DNS) of a dilute suspension of non-interacting spheroids sedimenting in a statistically homogeneous, isotropic turbulent flow. The fluid velocity field
 $\boldsymbol{u}$
satisfies the incompressible Navier–Stokes equations, and is driven to a statistically steady turbulent state via an injection of constant energy at the lowest wavenumbers.
For a given inertial spheroid, acted upon by gravitational acceleration
 $g \hat {\boldsymbol {g}}$
, the equations governing its translational
 $\boldsymbol {U}_p$
and angular
 $\boldsymbol {\omega }_p$
dynamics are given by
 \begin{align} &\frac {{\rm d}{\boldsymbol U}_p}{{\rm d}t} = g{\hat {\boldsymbol {g}}}+\frac {1}{\tau _p X_A}\boldsymbol {M}_t^{-1}\boldsymbol {\cdot }(\boldsymbol {v}-\boldsymbol {U}_p) , \end{align}
 \begin{align} &\frac {{\rm d}\boldsymbol {\omega }_p}{{\rm d}t}+\boldsymbol {I}_p^{-1}\boldsymbol {\cdot }[\boldsymbol {\omega }_p \boldsymbol {\wedge } (\boldsymbol {I}_p\boldsymbol {\cdot}\boldsymbol {\omega }_p)] = K_{sed} \boldsymbol {I}_p^{-1}\boldsymbol {\cdot }\left [(\hat {\boldsymbol {g}}\boldsymbol {\cdot}\boldsymbol {p})\,(\hat {\boldsymbol {g}}\boldsymbol {\wedge p})\right ] \nonumber \\ &\quad +\,8\pi \mu L^3 \boldsymbol {I}_p^{-1}\boldsymbol {\cdot }\left [{\boldsymbol M}_r^{-1}\boldsymbol {\cdot }\left (\frac {1}{2}\boldsymbol {\Omega }-\boldsymbol {\omega }_p\right ) -Y_H (\boldsymbol {E\cdot p})\boldsymbol {\wedge p}\right ], \end{align}
where
 $\boldsymbol {v}$
is the fluid velocity at the particle position. The large particle-to-fluid density ratio (
 $\rho _p/\rho _f$
), relevant to the atmospheric scenario, allows the neglect of Basset and added mass forces in (2.1). Particle inertia is characterised by a Stokes number defined as
 $St = \tau _p/\tau _\eta$
, the ratio of the particle relaxation time
 $\tau _p$
(defined below), and the characteristic turbulent (Kolmogorov) time scale
 $\tau _\eta$
. The particle response time
 $\tau _p$
(and hence the Stokes numbers) also depends sensitively on the spheroid aspect ratio
 $\kappa$
(Anand et al. Reference Anand, Ray and Subramanian2020); thus different values of
 $\kappa$
lead to different ranges of the Stokes numbers for our particles. Here,
 $\kappa =b/L\lt 1$
for oblate spheroids, where
 $b$
and
 $L$
are the semi-axis lengths along and orthogonal to the symmetry axis
 $\boldsymbol {p}$
, respectively. The angular dynamics of the settling spheroids also depends sensitively on the moment of inertia tensor
 $\boldsymbol {I}_p$
and the Stokesian translational (
 $\boldsymbol {M}^t$
) and rotational (
 $\boldsymbol {M}^r$
) mobility tensors, with the latter two ensuring an effective instantaneous drag and torque on the spheroids (Kim & Karrila Reference Kim and Karrila2013). The mobility tensors are defined as
 $\boldsymbol {M}_{t(r)}=X_{A(C)}^{-1}(\kappa )\,\boldsymbol {pp}+Y_{A(C)}^{-1}(\kappa )\,(\boldsymbol {I-pp})$
(Kim & Karrila Reference Kim and Karrila2013), where the principal resistance coefficients (
 $X_A-Y_C$
) are functions of only the spheroid aspect ratio
 $\kappa$
, and
 $\tau _p=2\rho _p L^2 \kappa/(9\rho _f \nu X_A)$
, with
 $\nu$
being the kinematic viscosity.
For an advecting turbulent flow with kinematic viscosity
 $\nu$
and mean dissipation rate
 $\epsilon$
, the Kolmogorov shear rate
 $\dot {\gamma }_\eta =\tau _\eta ^{-1}=(\epsilon /\nu )^{1/2}$
allows us to define a particle Reynolds number
 $Re_{\dot {\gamma }_\eta }=\dot {\gamma }_\eta L^2/\nu \lt 1$
(by definition for
 $L\ll \eta$
); likewise, another particle Reynolds number
 $Re_s=U_s L/\nu$
can be defined based on the slip velocity
 $U_s=\tau _p g$
. We limit ourselves to small but finite values of
 $Re_s$
, which ensures that the dominant forces acting on our spheroids are the gravitational and quasi-steady Stokesian drag forces (Jeffery Reference Jeffery1922; Kim & Karrila Reference Kim and Karrila2013). Further, considering small (sub-Kolmogorov) particles allows us to define the turbulent torque via the Bretherton constant
 $Y_H/Y_C=(\kappa ^2-1)/(\kappa ^2+1)$
(Bretherton Reference Bretherton1962). This turbulent torque competes with the gravity-induced torque (Dabade et al. Reference Dabade, Marath and Subramanian2015), and the relative importance of one to the other is quantified via the ratio
 $\mathcal {T} = K_{{sed}}/\mu L^3 \dot {\gamma }_\eta \sim U^2 f_I(\kappa )$
(Anand et al. Reference Anand, Ray and Subramanian2020; Sheikh et al. Reference Sheikh, Gustavsson, Lopez, Lévêque, Mehlig, Pumir and Naso2020; Gustavsson et al. Reference Gustavsson, Sheikh, Naso, Pumir and Mehlig2021), where
 $U=U_s/u_\eta$
(with
 $u_\eta$
the characteristic, small-scale Kolmogorov velocity field), and
 $f_I(\kappa )$
, which characterises the gravity-induced torque by setting
 $K_{sed}=Re_s\,\mu U_s L^2\,f_I(\kappa )\,X_A/Y_A$
in (2.2), was obtained in closed form by Dabade et al. (Reference Dabade, Marath and Subramanian2015) for a spheroid of arbitrary aspect ratio
 $\kappa$
. Finally, the effects of the advecting turbulent flow enter the rotational dynamics of the spheroids via the vorticity
 $\boldsymbol {\Omega }$
and rate-of-strain
 $\boldsymbol {E}$
fields evaluated simultaneously from the incompressible, Navier–Stokes equation. The fluid characteristic small-scale acceleration
 $a_\eta =u_\eta /\tau _\eta$
also allows us to define a Froude number
 $Fr = a_\eta /g$
to measure the effects of the turbulent acceleration with respect to that set by gravity; in what follows, we simulate for
 $Fr = 0.05$
, comparable to typical settings in clouds (Shaw Reference Shaw2003; Bec et al. Reference Bec, Homann and Ray2014), and as a contrast also for the zero gravity case, which leads, by definition, to
 $Fr = \infty$
.
Our DNS involve simultaneous simulations of the turbulent fluid as well as the time integration of spheroid trajectories defined by (2.1) and (2.2). The turbulent flow is simulated by using a standard pseudo-spectral method with a second-order Adams–Bashforth scheme for time marching. A spatial resolution of
 $512^3$
collocation points ensures a Taylor-scale-based Reynolds number
 $Re_\lambda =150$
. A two-thirds dealiasing rule is used in the pseudo-spectral method, resulting in
 $k_{\text {max}}\eta \approx 1.5$
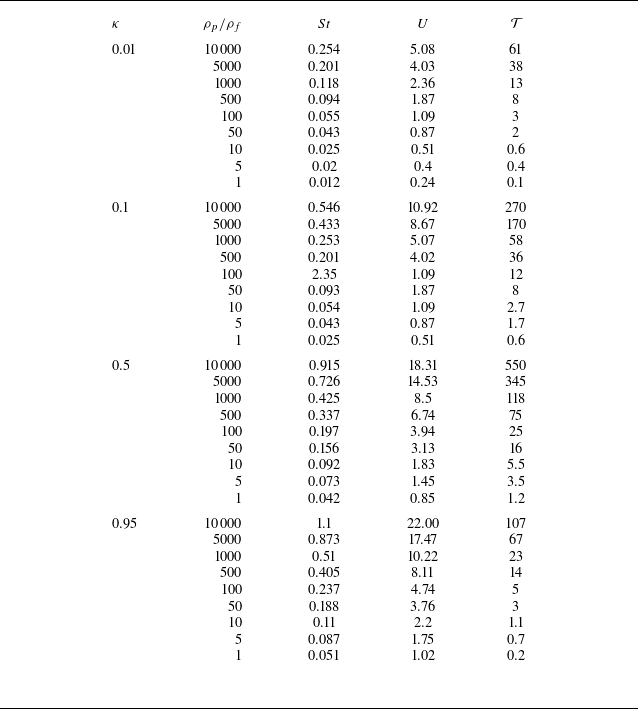
. A trilinear interpolation scheme is used to obtain the fluid velocity field at the particle positions for solving (2.1) (for details, see Ray Reference Ray2018). The set of parameters used in our simulations is given in table 1. We use different values of aspect ratios
 $0.01 \leq \kappa \leq 0.95$
(thus restricting ourselves to oblates) and Stokes numbers
 $0 \leq St \leq 1.1$
, where
 $St = 0$
is the tracer limit. To obtain reliable statistics, we use
 $10^6$
oblates for every combination of
 $\kappa$
and
 $St$
. Unlike many earlier studies, we have incorporated a gravity-induced torque (as explained earlier) in our model for anisotropic particles. This necessarily constrains our model to be accurate for particle Reynolds numbers
 $Re_s$
less than unity; in our simulations, we ensure
 $Re_s=0.5$
. It is instructive to rewrite the particle Stokes number in terms of the particle Reynolds number
 $Re_s$
, the density ratio
 $\rho _p/\rho _f$
and the aspect ratio
 $\kappa$
as
 $St=\tau _\eta ^{-1}(2\rho _p\kappa \nu\, Re_s^2/(9\rho _f X_A g^2))^{1/3}$
. This illustrates clearly that while in principle we could choose any value of
 $St$
, for the model to be physically realisable, the range of Stokes numbers is restricted (see table 1). Nevertheless, we do consider a wide range of parameters such as the torque ratio
 $\mathcal {T}$
and the density ratio
 $\rho _p/\rho _f$
. We also alert the reader that as
 $\rho _p/\rho _f\sim O(1)$
, some of the simplifications (such as the neglect of the Basset history and the added mass forces) in (2.1) are questionable. Nevertheless, for completeness, we do simulate (for every aspect ratio) a set of particles with
 $\rho _p/\rho _f=1$
(see table 1); but the remaining bulk of our results pertain to cases where the density ratios are comfortably larger than unity.
List of parameters used in the simulations.

3. Results
3.1. Small-scale clustering
One of the striking effects in suspensions of inertial, spherical particles is that of preferential concentration: particles tend to cluster, leading to a non-homogeneous spatial distribution of the particles (Wang & Maxey Reference Wang and Maxey1993), and the degree of clustering depends on their Stokes number in a non-monotonic way (Bec Reference Bec2003; Bec et al. Reference Bec, Biferale, Cencini, Lanotte, Musacchio and Toschi2007). This degree of small-scale clustering is best characterised by the correlation dimension
 $D_2$
(Bec et al. Reference Bec, Biferale, Cencini, Lanotte, Musacchio and Toschi2007), defined via the probability density
 $p_2(r) \sim r^{D_2-1}$
of finding two particles at a distance
 $r \lesssim \eta$
, with
 $\eta$
being the characteristic small scale (Kolmogorov) of the flow. In the tracer
 $St \to 0$
and large
 $St \to \infty$
limits, the correlation dimension
 $D_2 \to d$
, where
 $d$
is the spatial dimension of the problem; for finite Stokes numbers,
 $D_2 \lt d$
, with a minimum for
 $St \sim O(1)$
. The
 $D_2$
versus
 $St$
behaviour undergoes significant changes when the gravitational accelerations become comparable (Bec et al. Reference Bec, Homann and Ray2014) or larger than the turbulent accelerations of the flow, leading to important changes in the collision rates for gravitationally settling, inertial spherical particles.
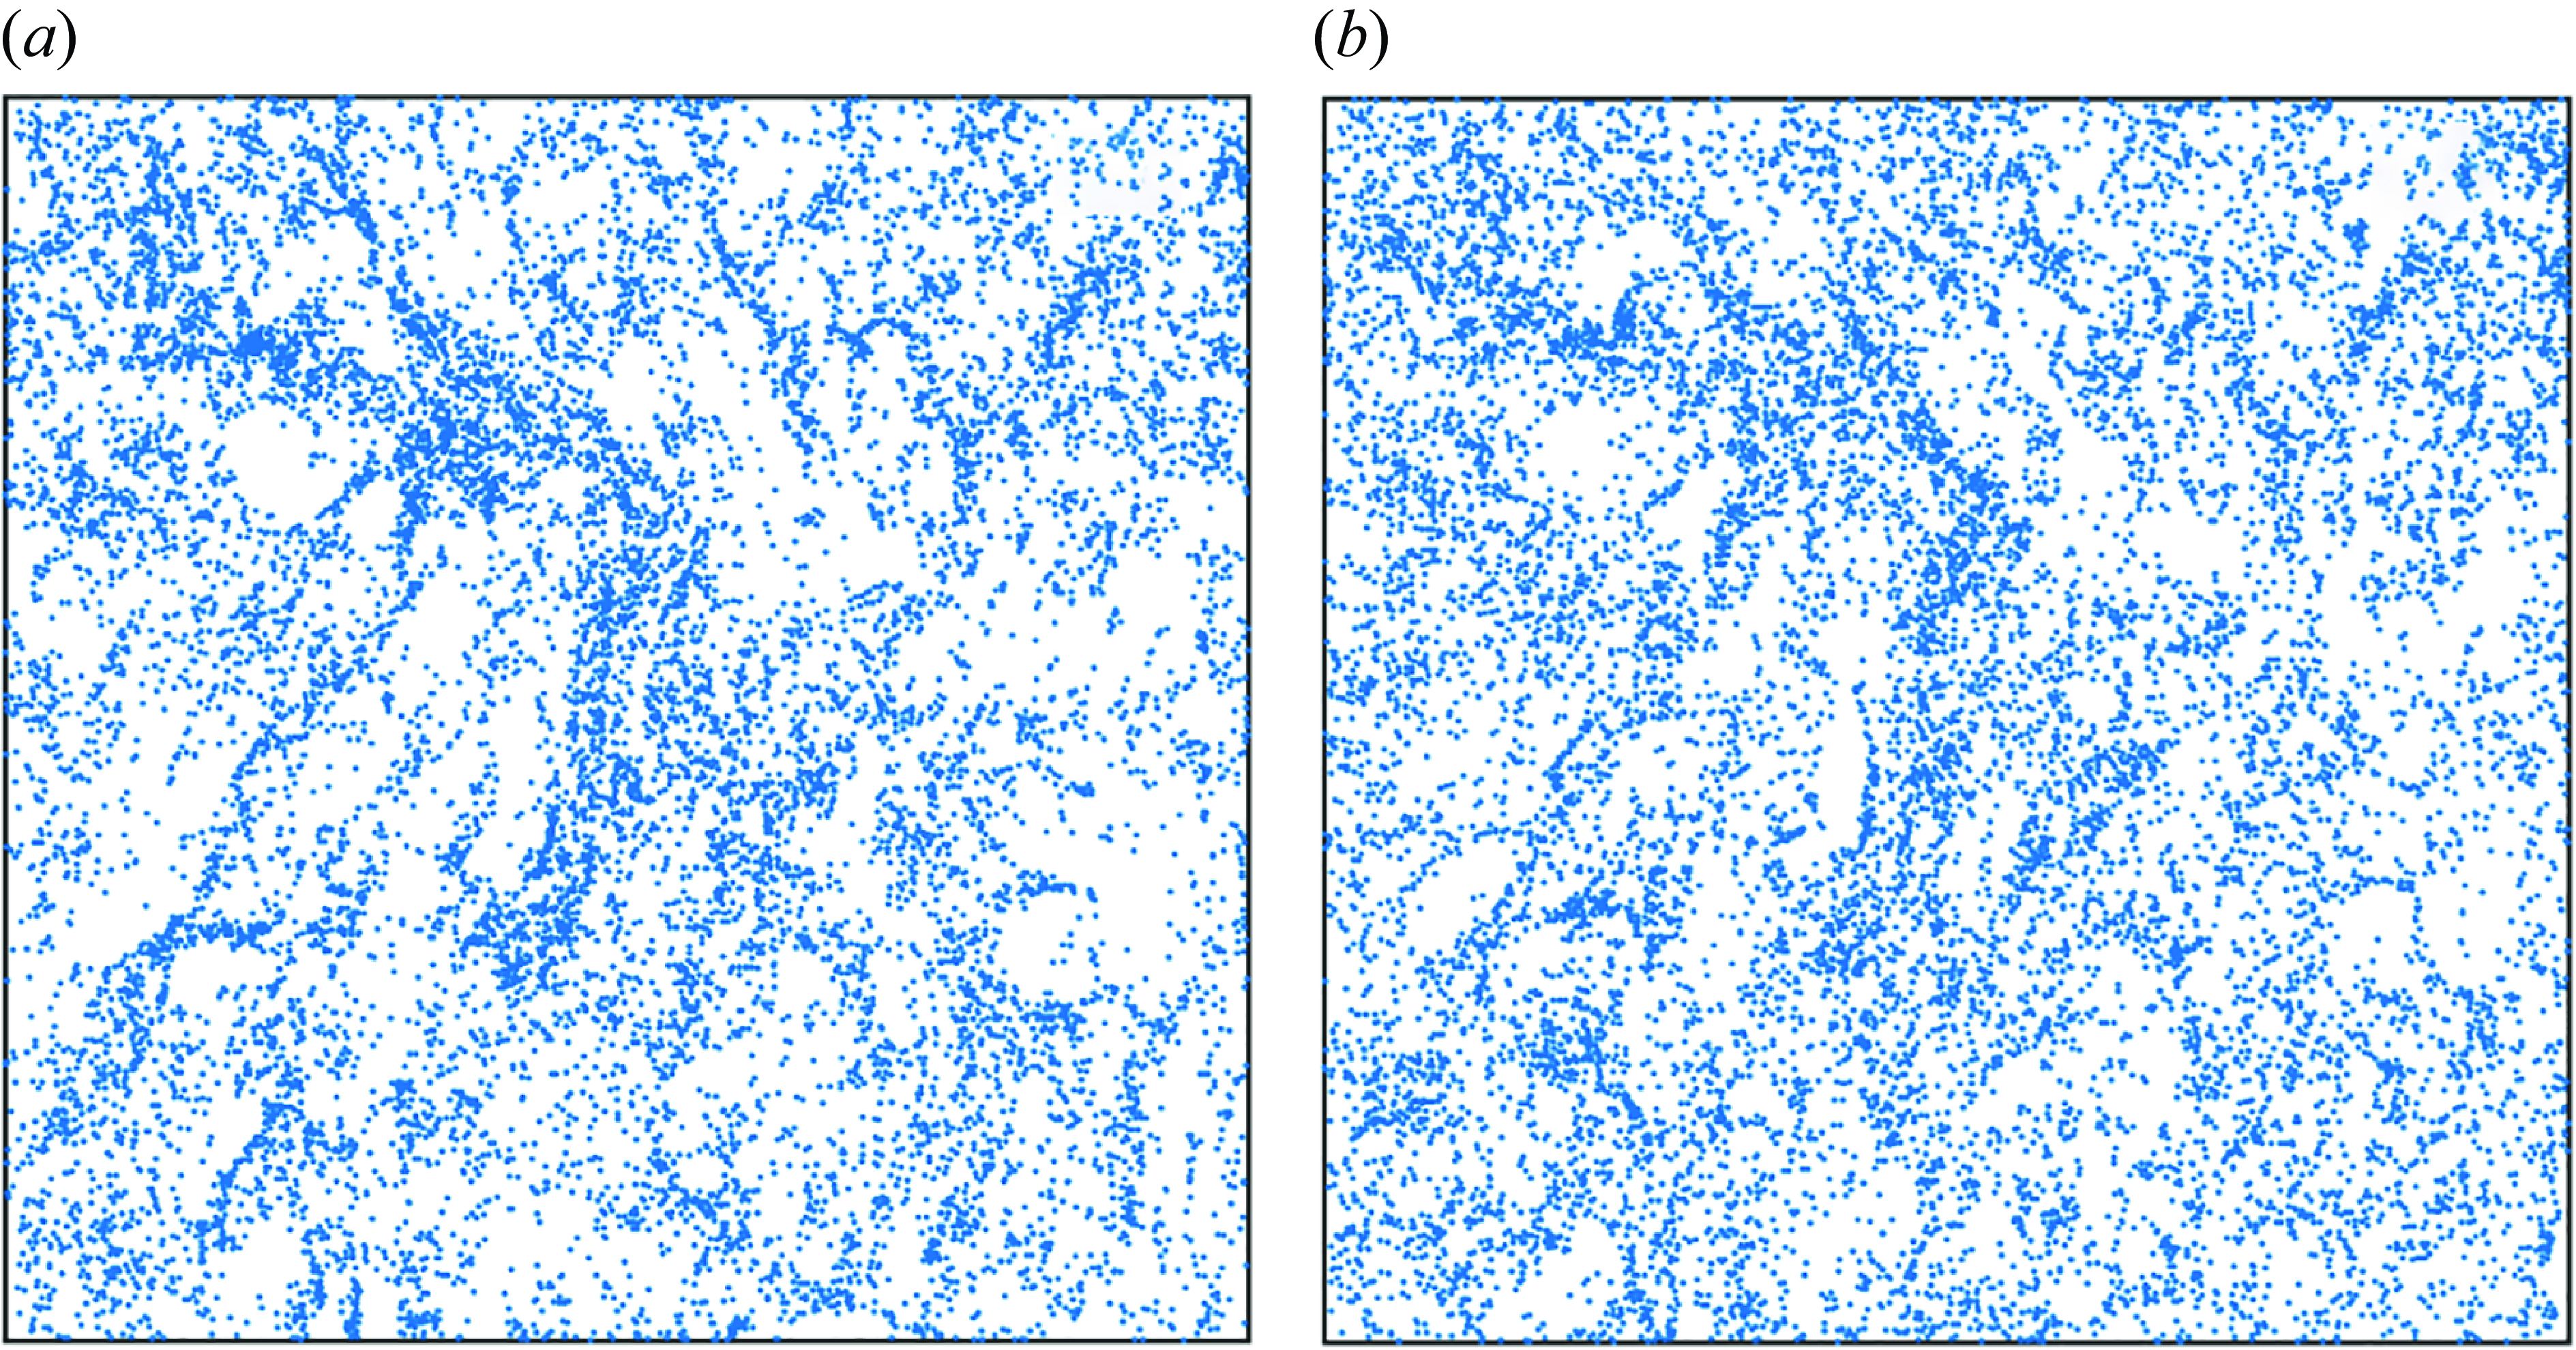
The question of small-scale clustering for spheroids settling in a turbulent flow is an open one. And yet, just as in the case of spherical particles, such clustering plays a key role in determining the eventual collision efficiency of, for example, ice crystals in a cloud. It would be reasonable to expect that the clustering of spheroids depends on their aspect ratio, and this expectation is borne out in figures 1(a) and 1(b), wherein particle positions are plotted in a thin slice of the computational domain for a given Stokes number. The extreme-shaped spheroids (
 $\kappa =0.1$
) seem to cluster more (notice the bigger voids) as compared to the nearly spherical particles (
 $\kappa =0.95$
). The snapshots of particle clustering are suggestive at best and certainly not conclusive. Hence we estimate a precise measure of the degree of clustering in what follows.
Representative snapshots, for
 $Fr = 0.05$
, of particle position with comparable Stokes numbers (
 $St \sim 0.5$
) but aspect ratios (a)
 $\kappa = 0.1$
and (b)
 $\kappa = 0.95$
; the (near) two-dimensional slice, on the
 $XZ$
plane, has dimensions
 $2\pi \times 10\eta \times 2\pi$
. A comparison of the two panels gives a visual cue that the disk-like (
 $\kappa = 0.1$
) particles tend to cluster more strongly than the near-sphere (
 $\kappa = 0.95$
) ones.

To quantify our observations regarding particle clustering, we measure the correlation dimension
 $D_2$
versus the Stokes number
 $St$
for different kinds of oblates, as characterised by their aspect ratio
 $\kappa$
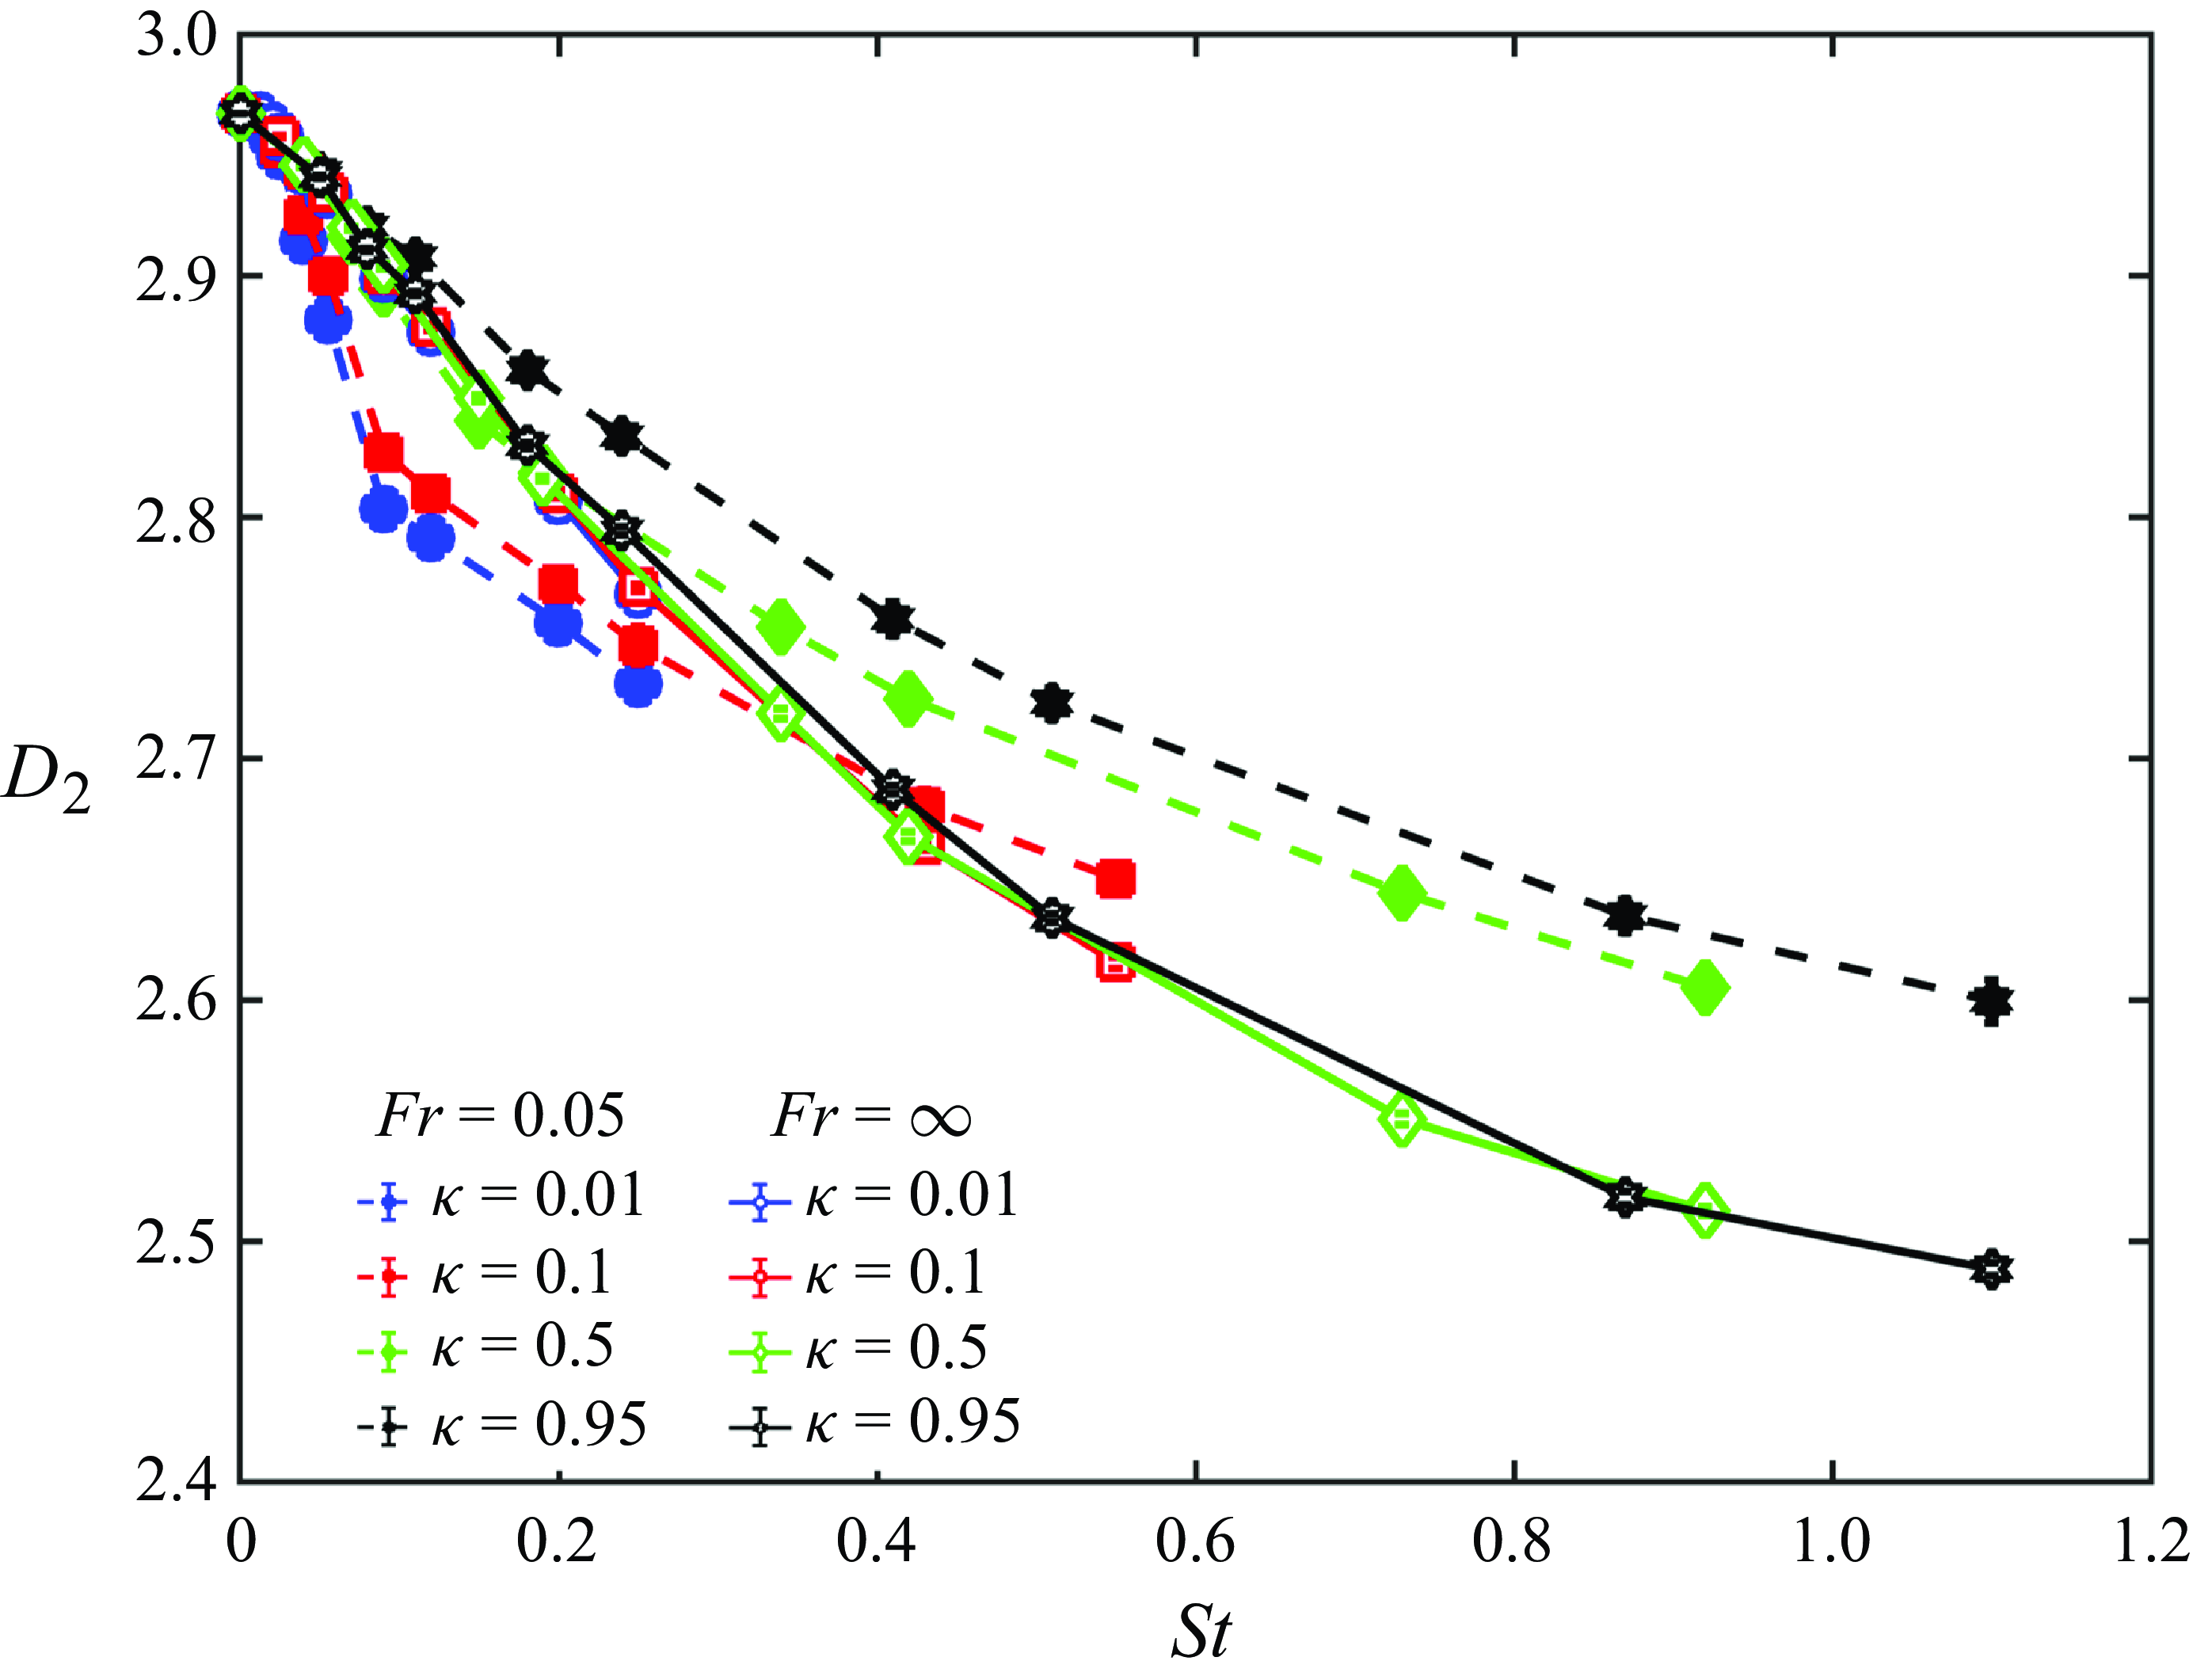
. In figure 2, we show a plot of the correlation dimension for different oblates (dashed curves for
 $Fr=0.05$
). We observe that as spheroids become disk-like (
 $\kappa \to 0$
), the degree of clustering becomes significantly stronger compared to the spherical limit
 $\kappa \to 1$
, which is consistent with the observations of the particle concentration field in figures 1(a) and 1(b).
Correlation dimension
 $D_2$
for the spheroids as a function of their Stokes numbers, for different aspect ratios (see legend; filled symbols for
 $Fr=0.05$
). Clearly, disk-like particles cluster more effectively, under gravity, than the near-sphere ones. The effect of gravitational settling on clustering is brought out by comparing the analogous plot for the zero gravity case (open symbols;
 $Fr = \infty$
, see legend): anisotropy has no effect on clustering when gravity is absent.

Note that the Stokes ranges for different values of
 $\kappa$
are different. This is because for most systems of interest, the particle-to-fluid density ratio varies from
 $1000$
(e.g. ice crystals in cold clouds) to
 $\sim 10000$
for aerosols (Bec et al. Reference Bec, Celani, Cencini and Musacchio2005). Since the Stokes numbers are aspect-ratio-dependent (see the expression in
 $\S$
2),
 $\rho _p/\rho _f=10\,000$
corresponds to different (maximum) Stokes numbers for each aspect ratio.
Owing to the anisotropy of the spheroids, gravity plays an important role by exerting the gravity-induced torque on the spheroidal particles. So does this mean that in the absence of gravity, there is no aspect ratio dependence on the small-scale clustering? To answer this question, we simulate the motion of the oblates for
 $Fr=\infty$
(no gravity). In figure 2, we show the plot of the correlation dimension in the zero gravity case (solid curves). Clearly, and as anticipated above, we find no dependence of
 $D_2$
on
 $\kappa$
. In particular, we find the correlation dimension for the spheroids of
 $\kappa =0.95$
to be consistent with those obtained for settling spherical particles (Bec et al. Reference Bec, Homann and Ray2014).
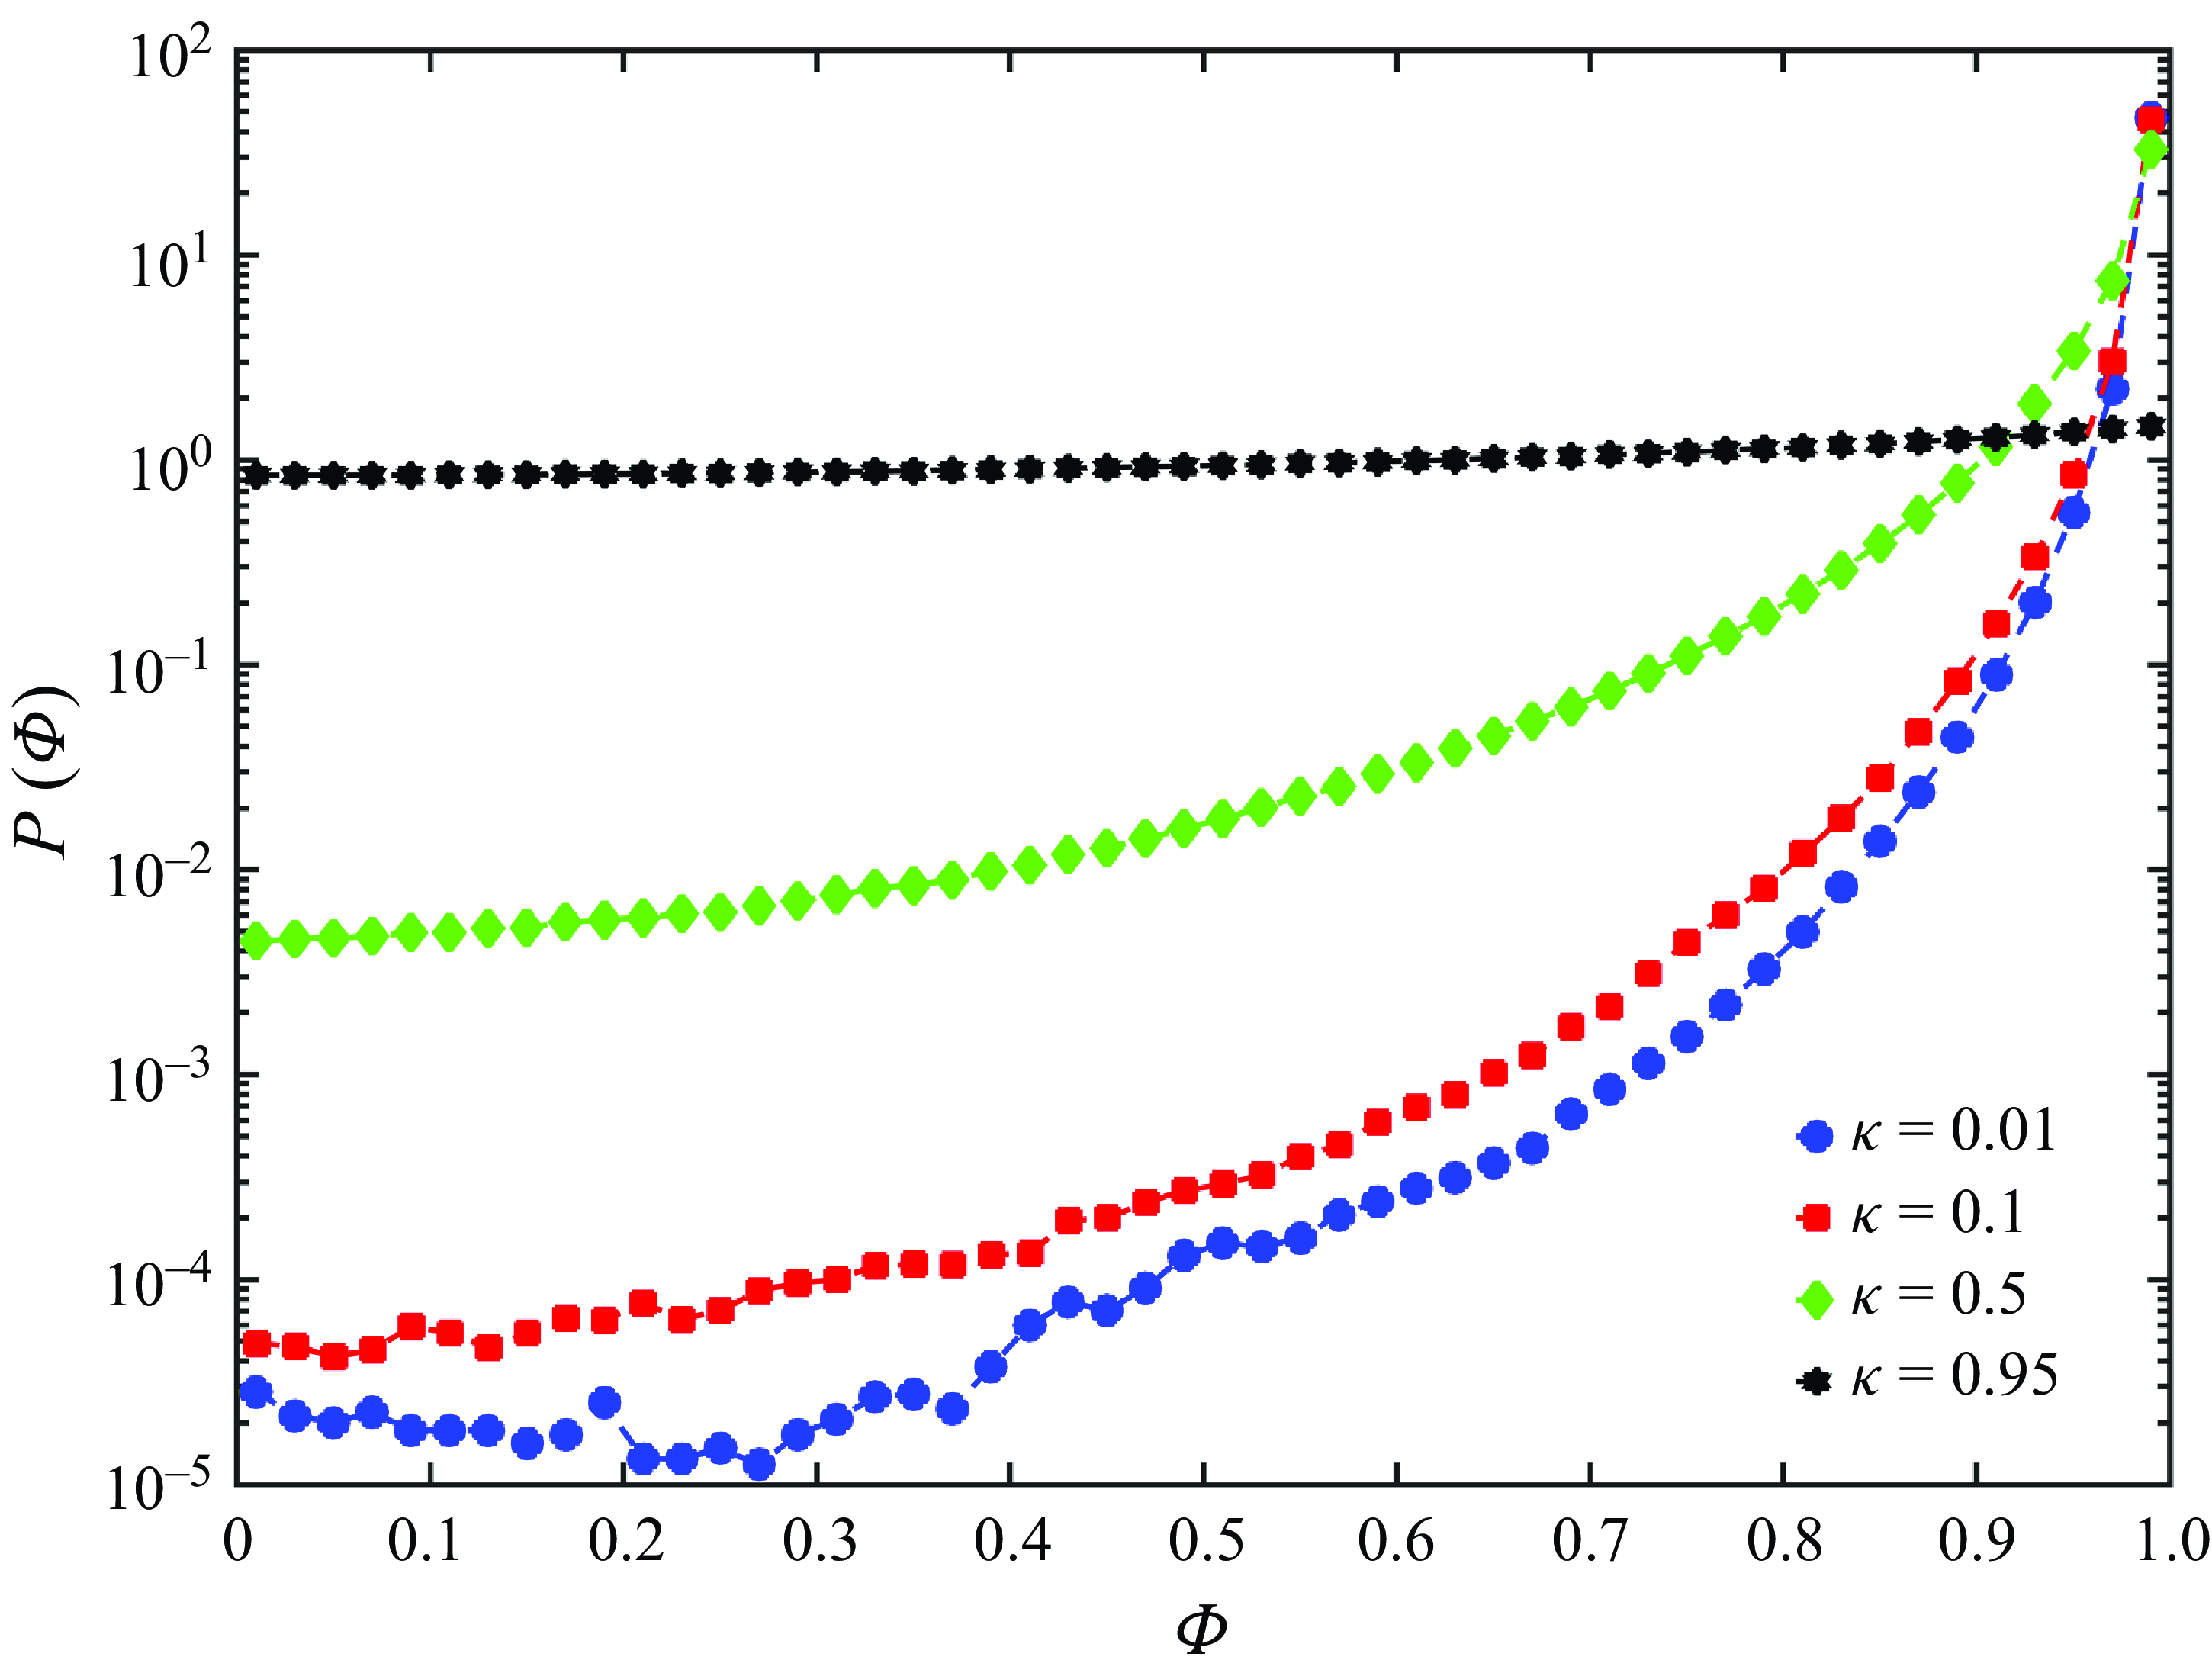
Distribution of the relative orientation
 $\Phi$
of the settling spheroids (with
 $St \sim 0.2$
), conditioned on their separation
 $r \leq 20\eta$
, for different aspect ratios. The ratio is
 $\mathcal {T}\sim 38,36,25,3$
for
 $\kappa =0.01,0.1,0.5, 0.95$
, respectively. Large values of
 $\mathcal {T}$
lead to a distribution that is sharply peaked at
 $\Phi \to 1$
for disk-like spheroids. As particles become more isotropic, this bias weakens, eventually leading to a flat distribution in the near-sphere limit (
 $\kappa = 0.95$
).

The correlation dimension is a measure of the spatial organisation of the particles, and in figure 2 we have shown the importance of shape and gravity in determining the eventual degree of clustering even if the Stokes numbers are comparable. However, the dynamics of the spheroids is determined not only by their positional information but also by their orientational information. To understand this, we calculate the relative orientation (for the gravitationally settling spheroids)
 $\Phi \equiv |\boldsymbol {p}_i\boldsymbol {\cdot} \boldsymbol {p}_{\! j}|$
of pairs
 $i,j$
of spheroids conditioned on their separation
 $r$
. Similar measurements have been obtained for suspensions of anisotropic particles, albeit in situations where the role of the gravity-induced torque has been neglected (Siewert et al. Reference Siewert, Kunnen and Schröder2014b
; Jucha et al. Reference Jucha, Naso, Lévêque and Pumir2018). In our model of spheroids, we are able to investigate this more fundamentally as the orientation of individual spheroids is an outcome of the competition between torques resulting from gravity and turbulent shear, quantified through their ratio
 $\mathcal {T}$
. Naively, one would expect for a given Stokes number and large
 $\mathcal {T}$
that the effects of gravity will dominate over turbulent fluctuations, leading to a distribution for
 $\Phi$
that is strongly peaked at 1, corresponding to a near perfect alignment, or orientational order, for sedimenting oblates. On the other hand, when
 $\mathcal {T} \sim O(1)$
, the gravity-induced torque loses its dominance, thereby ensuring that the spheroids settle in arbitrary orientations, leading to a more even sampling of
 $\Phi$
. In figure 3, we show measurements of
 $\Phi$
for
 $r \leq 20\eta$
and different values of
 $\kappa$
; the Stokes numbers for all spheroids are close to 1. As our phenomenological picture suggests, the relative orientation is strongly peaked at
 $\Phi = 1$
for disk-like oblates
 $\kappa = 0.01$
(
 $\mathcal {T}\gg 1$
), while becoming shallower as
 $\kappa$
increases, and eventually becomes uniform for the near-spheres
 $\kappa = 0.95$
(
 $\mathcal {T}\sim O(1)$
). A similar behaviour is observed for other values of
 $St$
and
 $r$
(not shown).
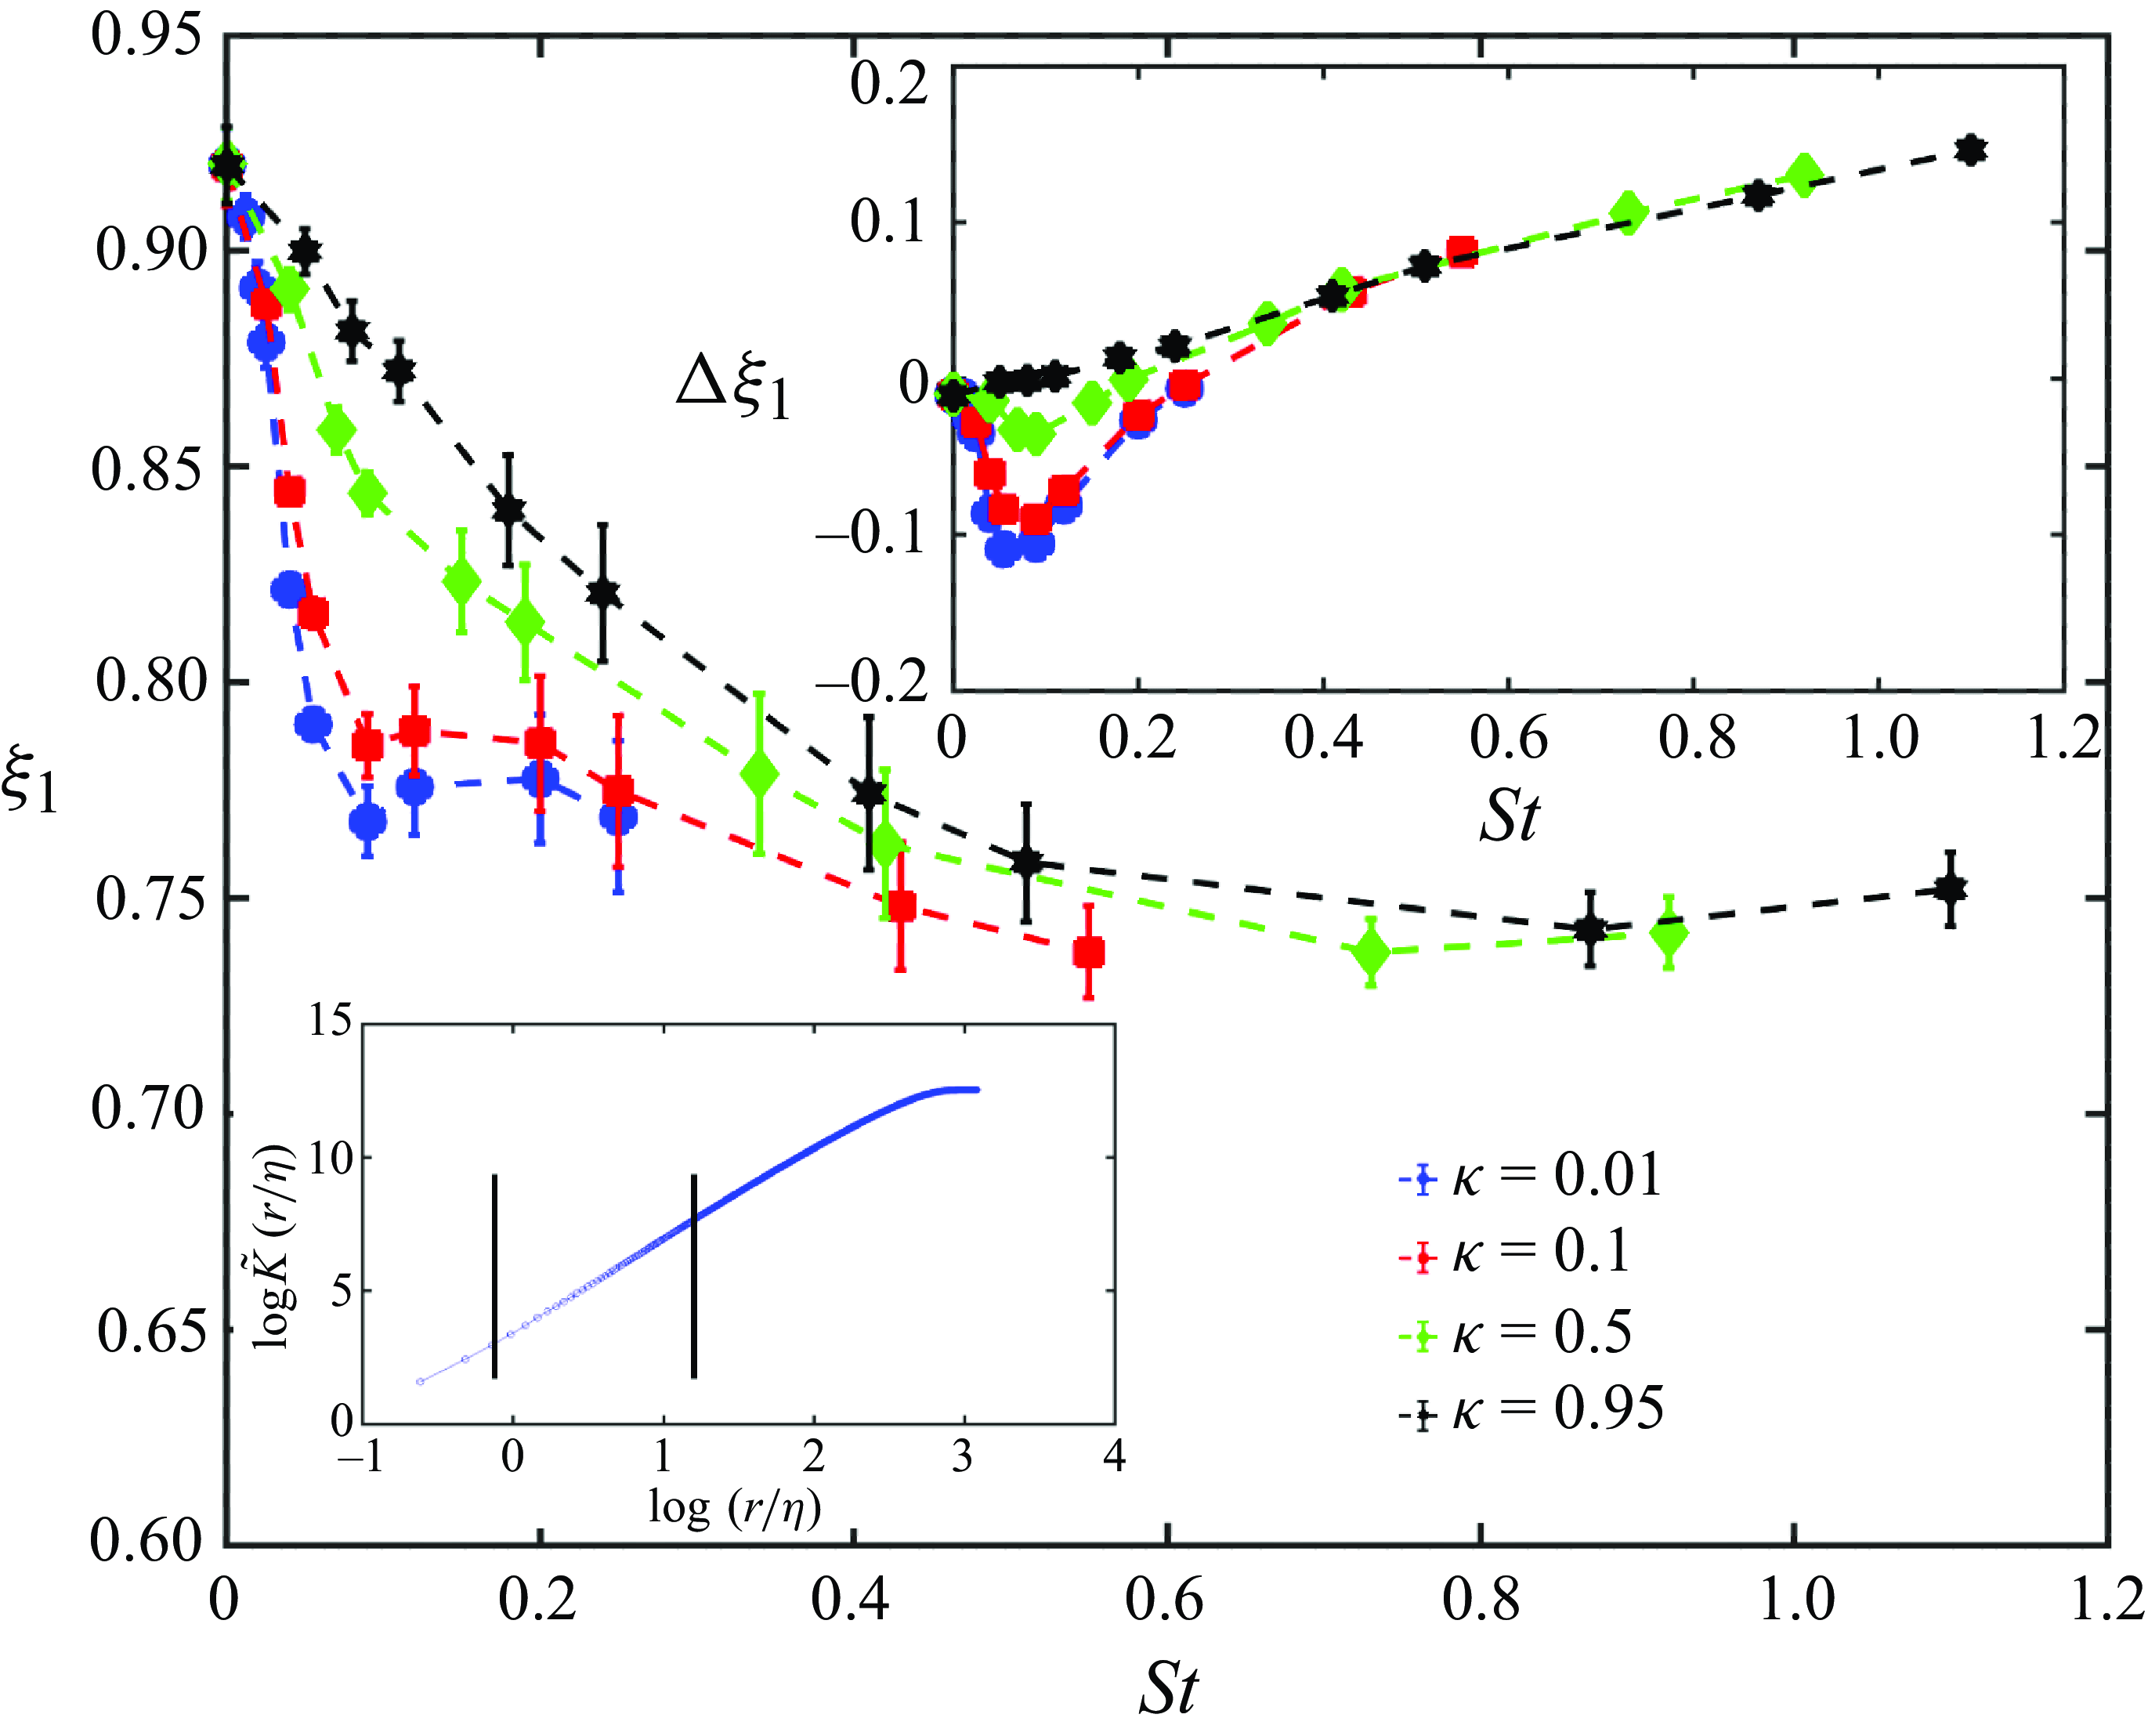
Variation of the exponent
 $\xi _1 = \gamma - D_2 + 1$
, characterising the relative longitudinal velocity for approaching, sedimenting particles, as a function of the Stokes number and for different values of
 $\kappa$
. In the upper inset, the difference
 $\Delta \xi _1 \equiv \xi _1 (Fr = 0.05) - \xi _1 (Fr = \infty )$
between this exponent for the gravity-driven settling and the zero-gravity case is shown. The lower inset shows a representative log-log plot of the cumulative sum
 $\tilde {K}(r)$
for
 $\kappa =0.5$
and
 $St=0.4$
; the scaling range, indicated by the pair of thick vertical lines, extends over a decade and yields
 $\gamma + 1$
, thence the exponent
 $\xi _1$
(see the text).

3.2. Relative longitudinal velocity
Having investigated the orientational order and positional correlation for settling spheroids, let us turn to the question of how such particles collide with each other. This, of course, is the critical question in developing ideas of collision kernels and estimating collision efficiencies in such systems, and particularly so in studies of ice crystals in cold clouds. There have been several studies that have estimated the collision kernel and its dependence on various parameters, such as the aspect ratio of particles and the fluid Reynolds numbers (Siewert et al. Reference Siewert, Kunnen and Schröder2014b ; Jucha et al. Reference Jucha, Naso, Lévêque and Pumir2018; Sheikh et al. Reference Sheikh, Gustavsson, Lévêque, Mehlig, Pumir and Naso2022). In this work, we take a slightly different point of view and address how violent the collisions can be through the approach rates (Bec et al. Reference Bec, Celani, Cencini and Musacchio2005) of colliding particles.
The approach rate can be expressed as
 $K(r)\equiv -\langle w\,\mathcal {H}(-w)\mid R=r\rangle\, p_2(r) \sim r^\gamma$
(Bec et al. Reference Bec, Homann and Ray2014), where
 $w$
is the longitudinal velocity difference between two particles, and
 $\mathcal {H}$
is the Heaviside function. As is usual, instead of the exponent
 $\gamma$
, we extract
 $\gamma + 1$
from log-log plots of the cumulative sum
 $\tilde {K}(r) \equiv \int _0^r K(r)$
. Such cumulative sums allow a better scaling range, and a representative plot of
 $\tilde {K}(r)$
is shown in the lower inset of figure 4 for
 $St = 0.4$
and
 $\kappa = 0.5$
. Our scaling range, which is indicated by thick vertical lines, extends for over a decade and yields
 $\gamma + 1$
through a least squares fit on this range. Following Bec et al. (Reference Bec, Celani, Cencini and Musacchio2005, Reference Bec, Biferale, Cencini, Lanotte, Musacchio and Toschi2007, Reference Bec, Homann and Ray2014), when
 $r\ll \eta$
, the approach velocity is
 $\langle w\,\mathcal {H}(-w)\mid R=r\rangle \sim r^{\xi _1}$
, the approach rate is
 $K(r)\sim r^\gamma$
, and
 $p_2\sim r^{D_2-1}$
, which implies that
 $\xi _1=\gamma -D_2+1$
. Thus our measured
 $\gamma + 1$
and
 $D_2$
allow an easy estimation of
 $\xi _1$
.
The exponent
 $\xi _1$
characterises the longitudinal velocity differences between pairs of settling spheroids, and is plotted for various Stokes numbers and aspect ratios in figure 4. For nearly spherical particles,
 $\xi _1$
shows the same dependence on Stokes number as reported for spheres in Bec et al. (Reference Bec, Homann and Ray2014). As the aspect ratio decreases, the constant-
 $\kappa$
curves start to get steeper. This implies that for a given Stokes number, the velocity difference increases with decreasing
 $\kappa \kern-1.5pt$
, or particles of smaller aspect ratio approach more violently. The exponents reported in figures 2 and 4, as well as the distribution of the relative orientations plotted in figure 3, are conditioned on
 $r\leq 20\eta$
. Although not shown, we have confirmed that the statistics reported in this paper are consistent for smaller interparticle separations, such as
 $r\leq 5\eta$
. To underline the interplay between gravity and anisotropy, we plot the difference between the
 $\xi _1$
values for
 $Fr=0.05$
and
 $Fr=\infty$
(zero gravity) in the upper inset of figure 4, for various aspect ratios. As is evident from the inset, when
 $St\lesssim 0.05$
,
 $\Delta \xi _1\lt 0$
for
 $\kappa =0.95$
, implying that gravity strengthens the longitudinal velocity difference of approaching spheroids. As
 $St$
increases beyond a critical value,
 $\Delta \xi _1$
becomes positive, which is indicative of gravity weakening the velocity differences. This is consistent with the results reported in Bec et al. (Reference Bec, Homann and Ray2014) for spherical particles. Interestingly, as the aspect ratio decreases,
 $\Delta \xi _1$
starts behaving non-monotonically with
 $St$
. It first decreases and attains negative values, before increasing and eventually collapsing onto the near-spherical curve beyond a
 $\kappa$
-dependent
 $St$
. This indicates that for
 $\kappa \leq 0.5$
, gravity first strengthens the velocity difference with increasing
 $St$
up to
 $\sim 0.08$
. Thereafter, the gravity-induced approach velocity starts to reduce, although
 $\Delta \xi _1$
remains negative; the minima of
 $\Delta \xi _1$
, and therefore the gravity-induced enhancement in velocity differences, are sensitive to the aspect ratio of the spheroid. Beyond a
 $\kappa$
-dependent Stokes number,
 $\Delta \xi _1$
attains positive values, thereby indicating that gravity now weakens the velocity differences instead of enhancing them. Once all the curves coincide, the difference of the longitudinal velocity behaves like those for spherical particles. It is important to flag a technical point regarding the particle Reynolds number based on the Kolmogorov shear rate,
 $Re_{\dot {\gamma }_\eta }=\dot {\gamma }_\eta L^2/\nu$
. Since the particles in our simulations are sub-Kolmogorov,
 $Re_{\dot {\gamma }_\eta }$
turns out to be quite small (
 ${\lt } 0.1$
) for most of the cases considered here. Therefore, the inertial correction to the turbulent shear-induced torque is sub-dominant in the present study for both
 $Fr=0.05$
and
 $Fr=\infty$
. For the gravitational case, an order-of-magnitude comparison of the gravity-induced torque vis-à-vis the inertial correction to the turbulent shear-induced torque is
 $\sim U^2$
, which is larger than unity for most of the cases in the present study (table 1).
3.3. Alignment of orientation vectors with local vorticity and strain-rate eigenframe
To augment our results on the pair statistics of oblate spheroids, we make a final calculation of how such particles align with the direction of the local vorticity
 $\hat {\boldsymbol {\Omega }}$
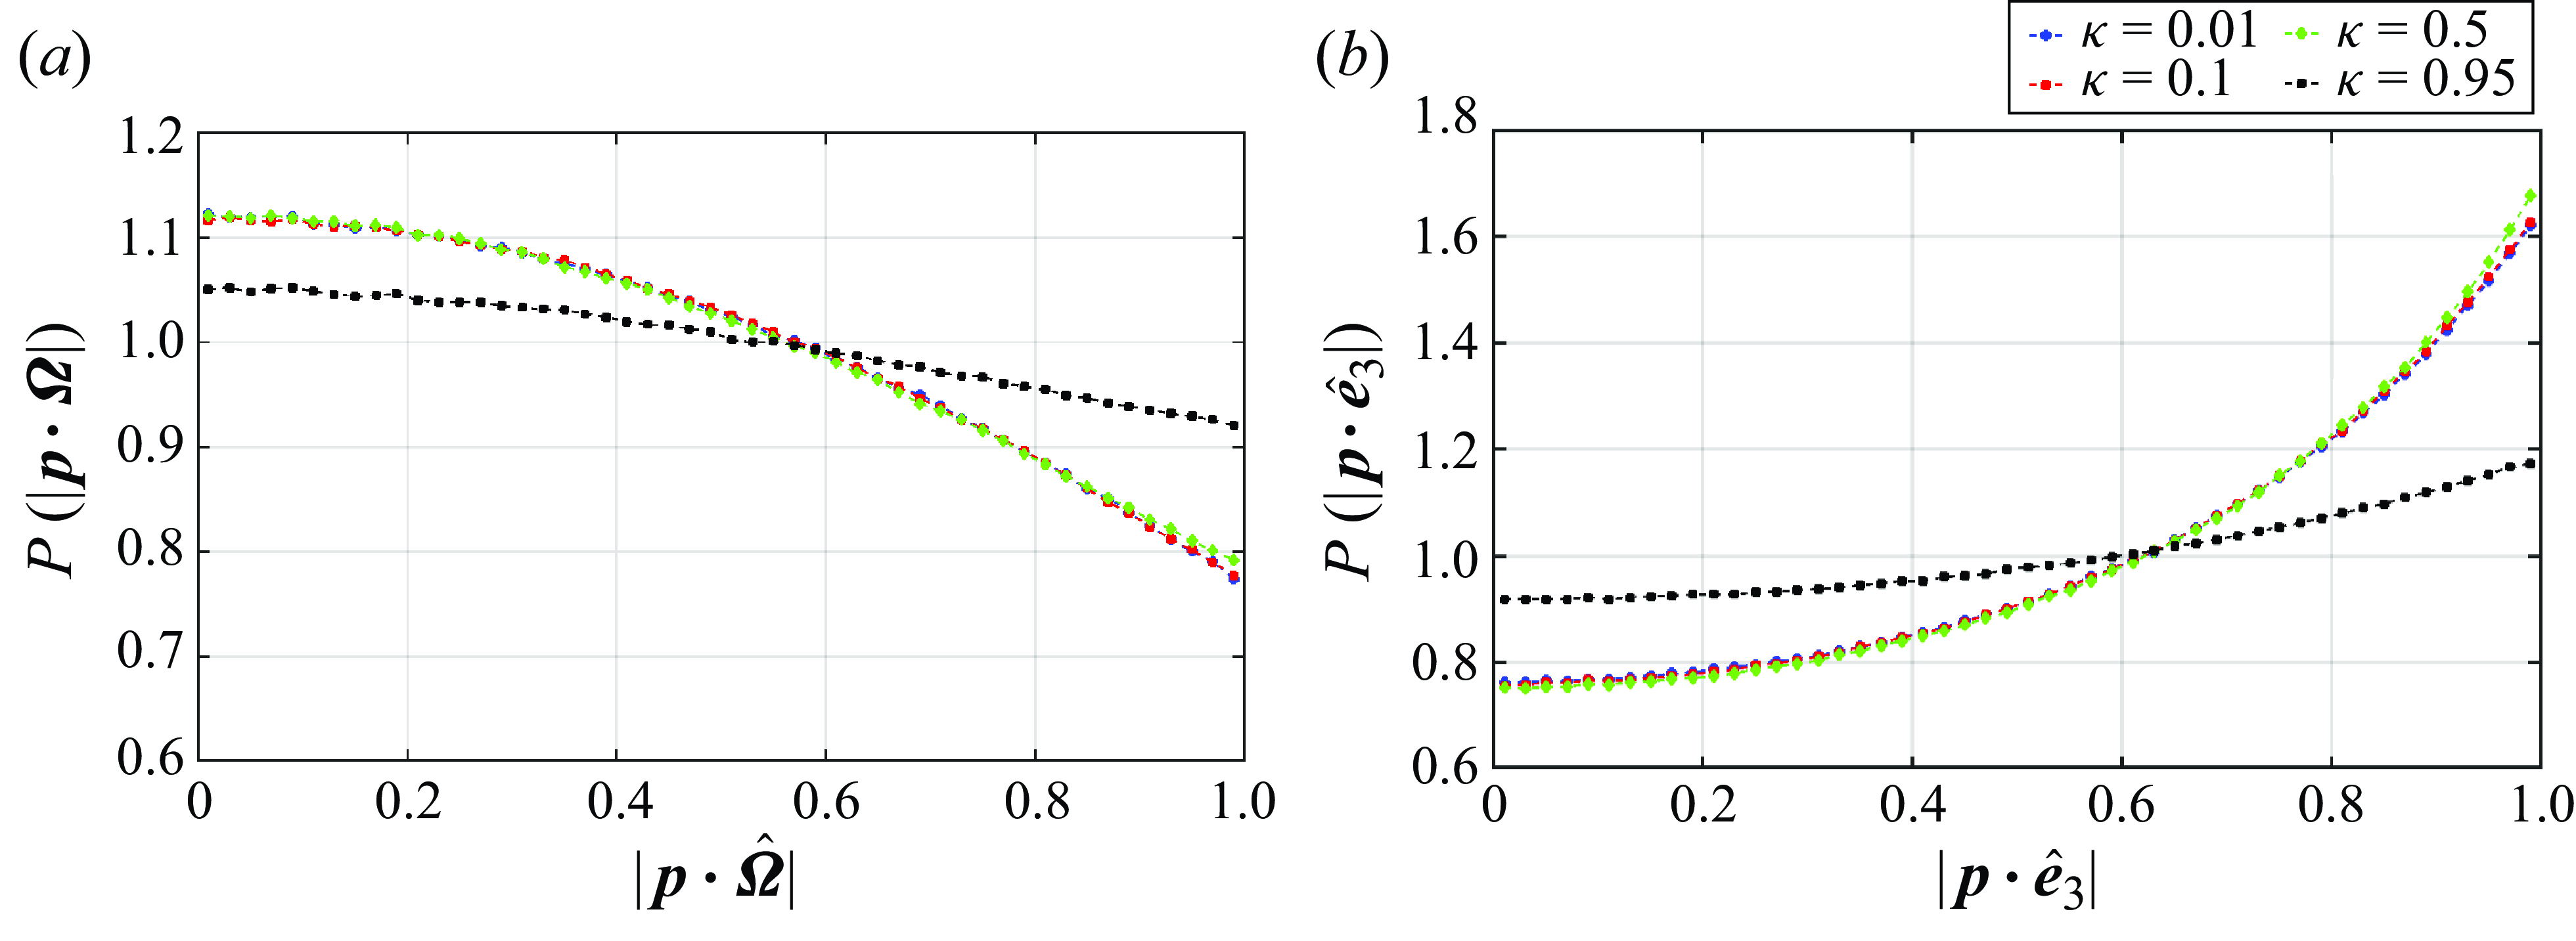
and the eigendirections of the local rate of strain tensor. Figure 5(a) shows the normalised probability distributions of the absolute value (due to the
 $\boldsymbol {p}\rightarrow -\boldsymbol {p}$
symmetry) of the cosine of the angle between the spheroid axis
 $\boldsymbol {p}$
and the local vorticity
 $\hat {\boldsymbol {\Omega }}$
, for various aspect ratios and
 $St \approx 0.2$
. The distributions peak at
 $|\boldsymbol {p}\boldsymbol{\cdot }\hat {\boldsymbol {\Omega }}|=0$
for all
 $\kappa$
, indicating that vorticity lies along the largest plane of the oblate spheroids, leading to a tumbling motion for the oblate spheroids. Such behaviour was already observed for tracer (
 $St=0$
) spheroids in Chevillard & Meneveau (Reference Chevillard and Meneveau2013). However, for our more complex anisotropic, inertial particles settling under gravity, the competing interactions of the additional torques (and forces) lead to a relatively weaker alignment than the tracer case studied by Chevillard & Meneveau (Reference Chevillard and Meneveau2013). (We have confirmed that for
 $St = 0$
, we recover the results reported in Chevillard & Meneveau Reference Chevillard and Meneveau2013.)
Probability distribution for (a)
 $|\boldsymbol {p}\boldsymbol {\cdot }\hat {\boldsymbol {\Omega }}|$
, where
 $\hat {\boldsymbol {\Omega }}$
is the local vorticity direction, and (b)
 $|\boldsymbol {p}\boldsymbol {\cdot }\hat {\boldsymbol {e}}_3|$
, where
 $\hat {\boldsymbol {e}}_3$
is the direction of strongest contraction, obtained from DNS for
 $St\approx 0.2$
for various aspect ratios. The spheroid axis is weakly perpendicular to the vorticity while strongly aligning with
 $\hat {\boldsymbol {e}}_3$
.

What about the preferential alignment with the local strain-rate eigenframe
 $(\hat {\boldsymbol {e}}_1,\hat {\boldsymbol {e}}_2,\hat {\boldsymbol {e}}_3)$
, where
 $\hat {\boldsymbol {e}}_1$
is the direction of the strongest extension (largest positive eigenvalue),
 $\hat {\boldsymbol {e}}_3$
is the direction of strongest contraction (largest negative eigenvalue), and
 $\hat {\boldsymbol {e}}_2$
is the direction corresponding to the intermediate eigenvalue, which can be either positive or negative? The distributions for
 $|\boldsymbol {p}\boldsymbol {\cdot }\hat {\boldsymbol {e}}_1|$
and
 $|\boldsymbol {p}\boldsymbol {\cdot }\hat {\boldsymbol {e}}_2|$
of course follow the trend of
 $|\boldsymbol {p}\boldsymbol {\cdot }\hat {\boldsymbol {\Omega }}|$
and peak at 0. This is because such spheroids show a strong alignment with the most contracting eigendirection
 $\hat {\boldsymbol {e}}_3$
as
 $\kappa \to 0$
. While this is easier to understand for the
 $St = 0$
case, as reported in Chevillard & Meneveau (Reference Chevillard and Meneveau2013), the problem of gravitationally settling inertial oblates is more subtle. In figure 5(b), we show the distributions for
 $|\boldsymbol {p}\boldsymbol {\cdot }\hat {\boldsymbol {e}}_3|$
for a fixed
 $St\approx 0.2$
and different aspect ratios. For nearly spherical oblates (
 $\kappa = 0.95$
), the distribution is close to being uniform, as one would expect. However, for truly anisotropic particles with
 $\kappa \leq 0.5$
, we see clear evidence, even for such finite Stokes numbers, of the preferential alignment with the most contracting eigendirection, with little or no dependence on the precise value of
 $\kappa$
.
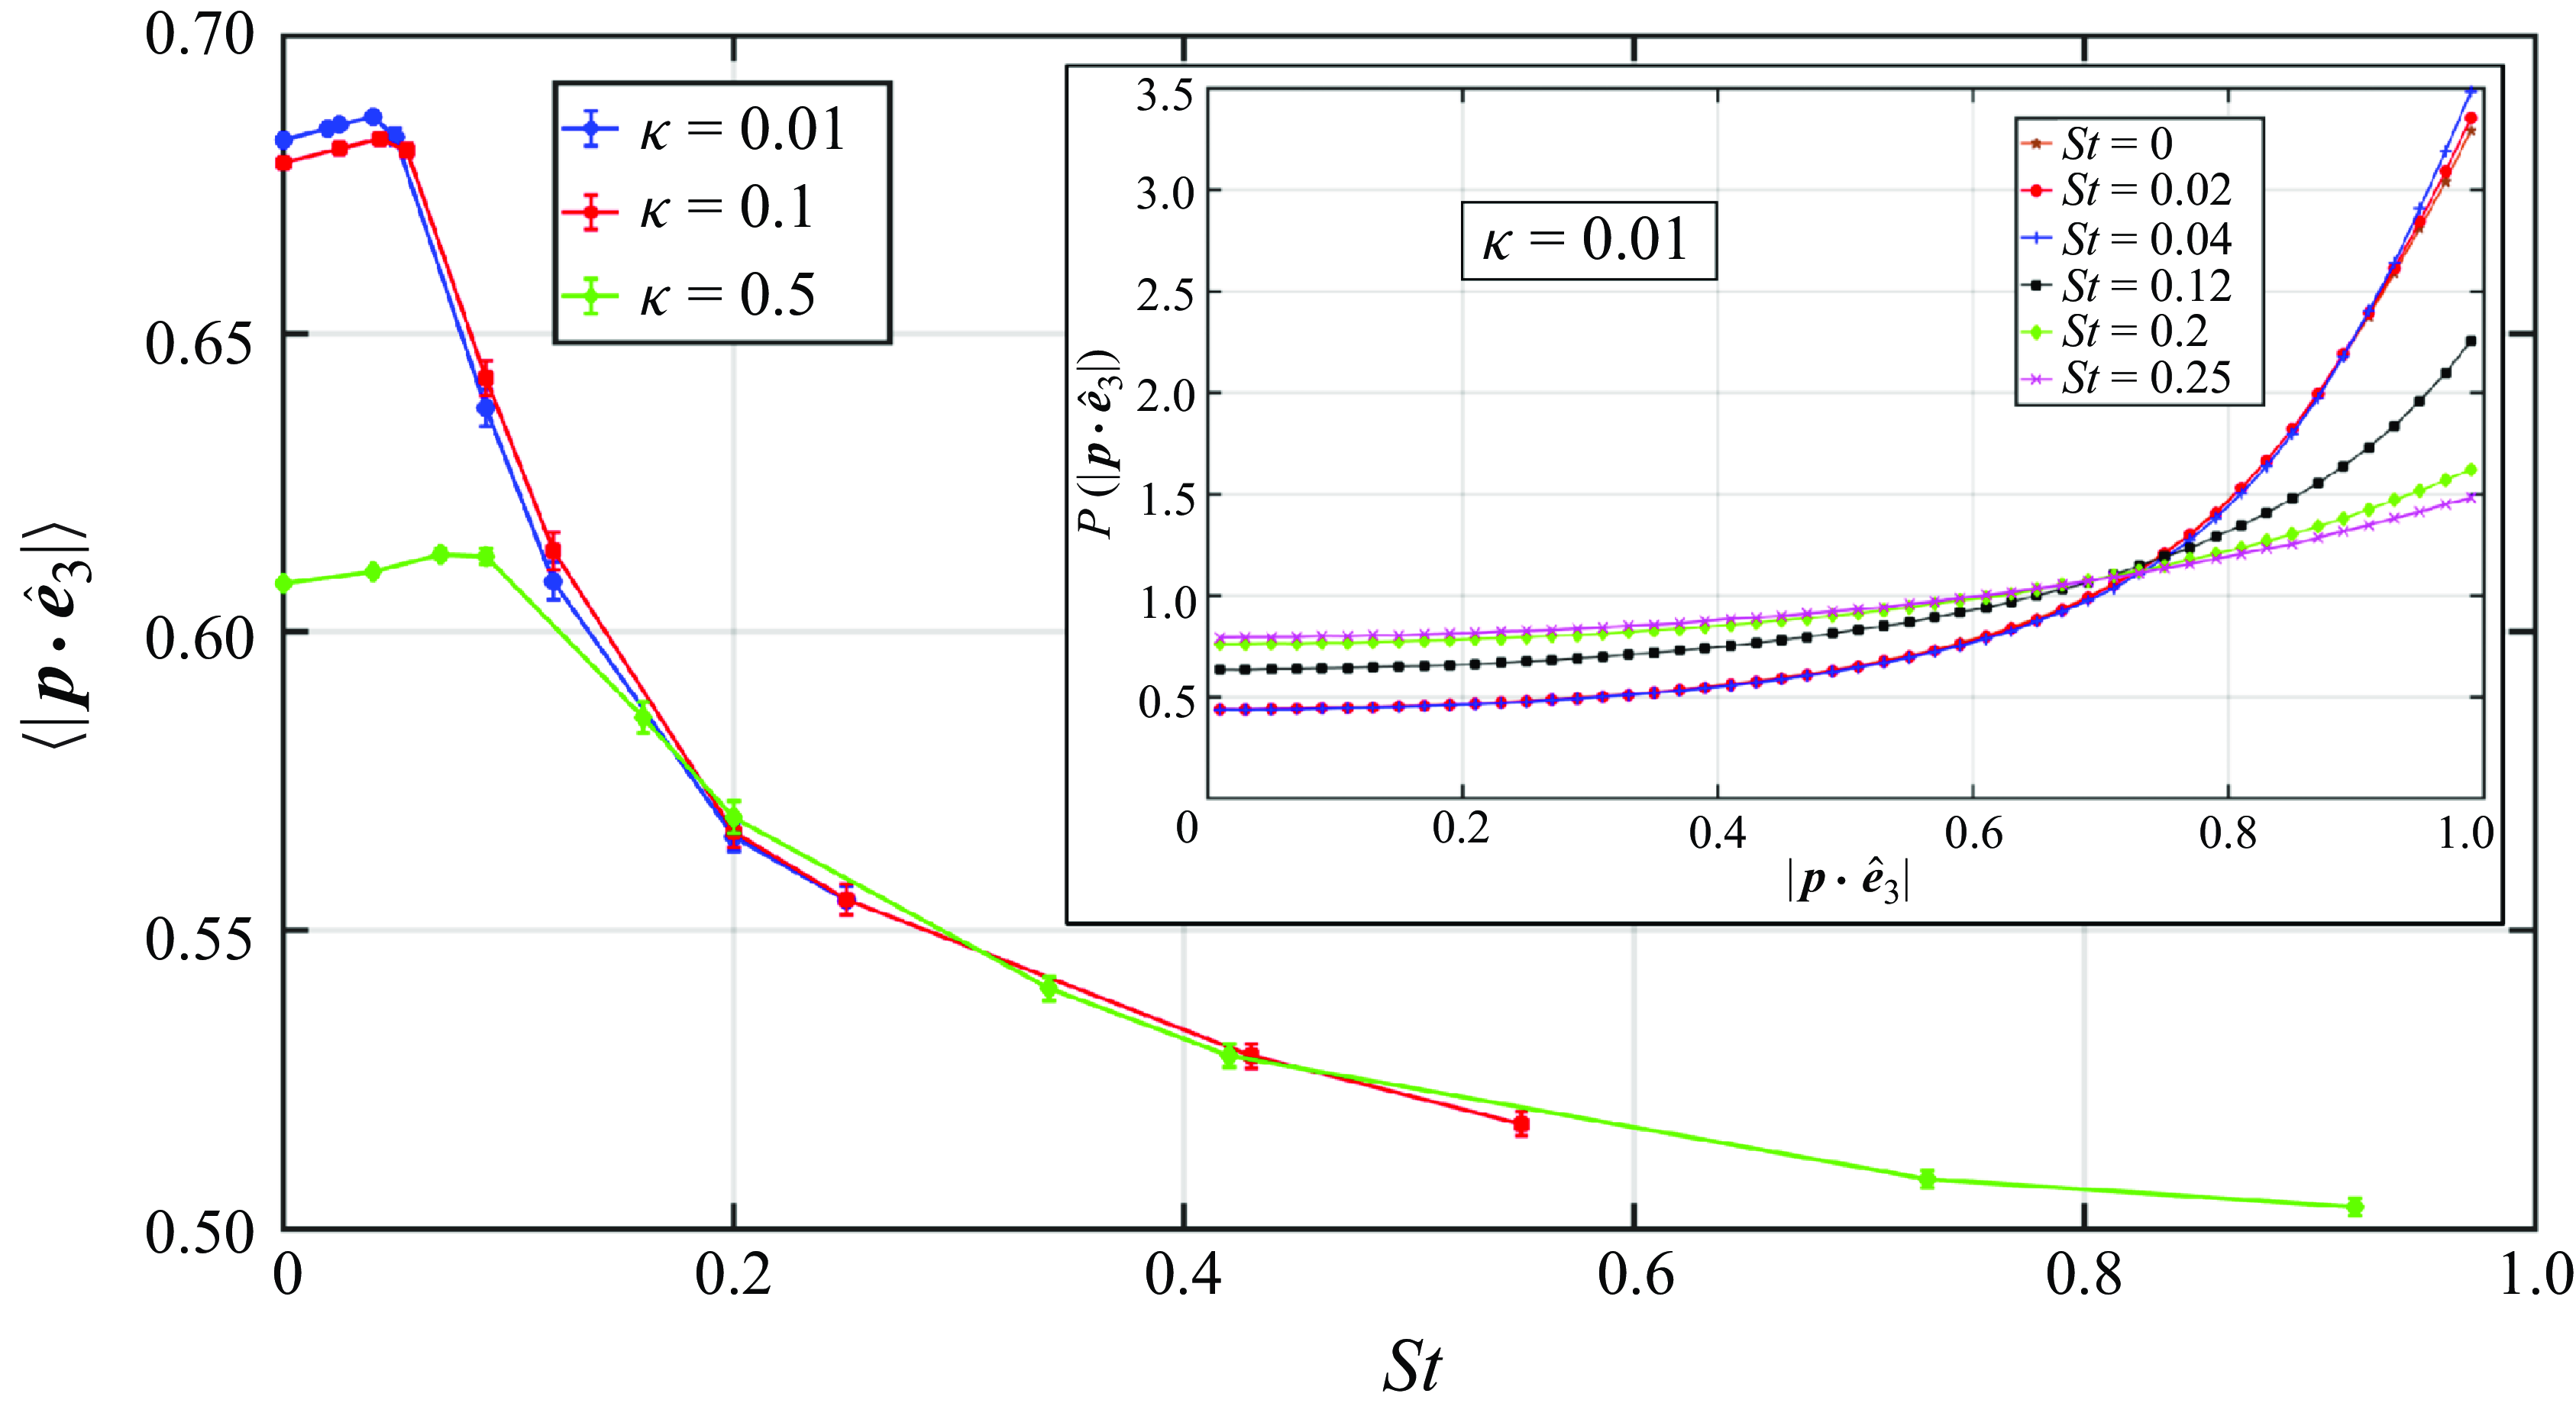
Mean values for the distributions of
 $|\boldsymbol {p}\boldsymbol {\cdot }\hat {\boldsymbol {e}}_3|$
for all the aspect ratios as a function of Stokes number. For a given
 $\kappa$
, the values decrease with increasing Stokes number, and for small Stokes number, the values depend on
 $\kappa$
. The inset shows the probability distributions for
 $|\boldsymbol {p}\boldsymbol {\cdot }\hat {\boldsymbol {e}}_3|$
for
 $\kappa =0.01$
for various Stokes numbers. The trend shown by the peak of the distribution is mirrored by the mean values.

Interestingly, our measurements for the distributions of
 $|\boldsymbol {p}\boldsymbol {\cdot }\hat {\boldsymbol {e}}_3|$
for different values of
 $St$
(for a given
 $\kappa$
) show a major surprise (figure 6, inset for
 $\kappa = 0.01$
): the distributions themselves, and in particular their peak values as
 $|\boldsymbol {p}\boldsymbol {\cdot }\hat {\boldsymbol {e}}_3| \to 1$
, show a sensitivity to the particle inertia, especially for the extreme-shaped
 $\kappa \to 0$
particles, reminiscent of the measurements of
 $D_2$
and
 $\xi _1$
reported earlier. While in the limit
 $St \to 0$
the distributions sharply peak at
 $|\boldsymbol {p}\boldsymbol {\cdot }\hat {\boldsymbol {e}}_3| \to 1$
, consistent with the tracer, non-sedimenting anisotropic particles studied in Chevillard & Meneveau (Reference Chevillard and Meneveau2013), the extent of preferential alignment falls sharply as
 $\kappa \to 1$
. We quantify this effect by calculating the mean
 $\langle |\boldsymbol {p}\boldsymbol {\cdot }\hat {\boldsymbol {e}}_3|\rangle$
for such distributions, and plotting their values as a function of
 $St$
for various
 $\kappa$
in figure 6. For particles with similar inertia, this mean varies monotonically with
 $\kappa$
, with the strongest alignment as
 $\kappa \to 0$
. For our nearly spherical particles (
 $\kappa = 0.95$
), the mean value is essentially 0.5, and within error bars, independent of the
 $St$
numbers, as one would expect for
 $\kappa \to 1$
. (For clarity, we do not show the corresponding plot for the near-sphere case
 $\kappa = 0.95$
where the distributions are essentially flat with
 $\langle |\boldsymbol {p}\boldsymbol {\cdot }\hat {\boldsymbol {e}}_3|\rangle \approx 0.5$
.)
In our model for sedimenting oblates, the translational and rotational dynamics are coupled in very non-trivial ways. Our observations of the non-trivial shape and inertia dependence in measurements of pair statistics –
 $D_2$
and
 $\xi _1$
– as well as in single-particle alignment statistics (figure 6), leaves open the intriguing possibility of the two effects being related. Indeed, the mean
 $\langle |\boldsymbol {p}\boldsymbol {\cdot }\hat {\boldsymbol {e}}_3|\rangle$
suggests that spheroids with large enough Stokes numbers sample the local flow geometry more uniformly. However, the precise relation between pair statistics and such single-particle statistics is well beyond the scope of this paper, but should serve as a future direction of investigations.
4. Conclusion
Before we conclude, it is important to underline and discuss a possible shortcoming of our model that is beyond the scope of the present work. When considering approach rates of settling spheroids, it is tempting to ask if hydrodynamic interactions (HI) – neglected in our work – could play a dominant role in influencing the statistics that we report. On the one hand, the question of HI is a delicate one, and on the other, the neglect of such interactions is in the spirit of most of the work in this area. Given the relative infancy of studies of sub-Kolmogorov spheroids in a turbulent flow, it is not surprising that, to the best of our knowledge, no studies exist on the HI in such turbulent suspensions, unlike the case for sub-Kolmogorov spherical particles (Wang et al. Reference Wang, Ayala, Kasprzak and Grabowski2005, Reference Wang, Ayala and Grabowski2007; Ayala et al. Reference Ayala, Rosa, Wang and Grabowski2008; Rosa et al. Reference Rosa, Wang, Maxey and Grabowski2011; Bec et al. Reference Bec, Musacchio and Ray2013; Onishi et al. Reference Onishi, Takahashi and Vassilicos2013). Briefly, while these studies do indicate that HI have an effect on the collision efficiency, relative velocity and pair distribution, the difference between the HI and no-HI cases turns out to be small. In fact, Ayala et al. (Reference Ayala, Rosa, Wang and Grabowski2008) find that the background turbulence severely limits the overall effect of HI. Indeed, this conclusion stems from their observation that collision efficiency remains more or less unchanged with and without HI. On a related note, a recent work Bragg et al. (Reference Bragg, Hammond, Dhariwal and Meng2022) shows the limitations of a theoretical model based on HI for weakly inertial particles in explaining the extreme clustering observed in the experiments of Yavuz et al. (Reference Yavuz, Kunnen, van Heijst and Clercx2018). We stress again that these examples are not to suggest that HI has no role in particle dynamics, but perhaps they are sub-dominant for sub-Kolmogorov particles in a turbulent flow. Indeed, for turbulent suspensions, Dhanasekaran et al. (Reference Dhanasekaran, Roy and Koch2021) showed recently that the importance of HI starts to emerge when spherical particles are within distances of the order of the mean free path where the continuum theory breaks down. All of this suggests that even for the simpler problem of turbulent suspensions of spherical sub-Kolmogorov particles, neglect of HI is a reasonable approximation when addressing questions of clustering dimensions and approach rates.
In summary, our work highlights the shape-sensitive nature of the two-particle statistics for inertial spheroids when the competing effects of the turbulent and gravity-induced torques are factored in. In particular, through a systematic and largely numerical study, we demonstrate the consequences of this in the nature of clustering and approach rates for such particles. This supplements several recent studies that have advanced our understanding of the phenomenon of turbulent transport for anisotropic particles. In particular, it complements the recent studies of collision kernels (Siewert et al. Reference Siewert, Kunnen and Schröder2014b ; Sheikh et al. Reference Sheikh, Gustavsson, Lévêque, Mehlig, Pumir and Naso2022) in such systems by measuring the approach rates of colliding particles.
The present work motivates several questions for future studies. One of these relate to the alignment of the spheroid with the local geometry of the flow. Chevillard & Meneveau (Reference Chevillard and Meneveau2013) demonstrated that the recent fluid deformation approximation (RFDA) – a stochastic model for the velocity gradient tensor proposed by Chevillard & Meneveau (Reference Chevillard and Meneveau2006) – gives a good prediction for the orientation statistics of the inertialess spheroids. It would be tempting, in the light of our results, to see how such models can be extended to the problem of finite inertia, and their results tested against the DNS results that we report in this work. This could provide the theoretical underpinnings for what effects govern the dependence of preferential concentration and the relative longitudinal velocity on the anisotropy of the particle. In fact, one can also make theoretical predictions in future studies by developing a model for the collision of spheroids settling in turbulence in a manner similar to Jiang et al. (Reference Jiang, Xu and Zhao2024), who obtain the collision kernel for spheroids settling in a quiescent ambient. As we have already discussed, an obvious restriction in our study is the smallness of
 $Re_s$
, which is reflective of the model used for the gravity-induced torque. Addressing the aforementioned restriction is the next step to generalising the results in our study. A first attempt at the same was made by Lopez & Guazzelli (Reference Lopez and Guazzelli2017), who proposed a theoretical model, by using the framework developed in Khayat & Cox (Reference Khayat and Cox1989), to obtain the settling velocity for slender fibres (
 $\kappa \gg 1$
) for
 $Re_s\sim O(1)$
; they reported a good match with their own experiments. Using their model, one can suspend slender fibres in turbulence and study their orientational and translational dynamics. This will greatly help in expanding the parameter space covered in the present study. Another potentially interesting study can involve using asymmetric shapes settling in turbulence, in contrast to spheroids (which are fore–aft symmetric). Recently, Roy et al. (Reference Roy, Hamati, Tierney, Koch and Voth2019) calculated the gravity-induced torque on freely settling asymmetric fibres for
 $Re_s\ll 1$
. In the same spirit as in the present study, the aforementioned gravity-induced torque can be implemented for the fibres settling in turbulent flow, which can then be used to characterise their orientation dynamics and pair statistics. Pursuing these questions will provide us with a more quantitative understanding of the dynamics of anisotropic ice crystals in cold clouds, as well as helping to address questions of mixed phase turbulent transport.
Acknowledgements
We thank G. Subramanian for introducing us to this subject and several discussions on this topic. We also thank H. Joshi for discussions. The simulations were performed on the ICTS clusters Tetris and Contra.
Funding
S.S.R. acknowledges SERB-DST (India) projects STR/2021/000023 and CRG/2021/002766 for financial support. We acknowledge the support of the DAE, Government of India, under project nos 12-R&D-TFR-5.10-1100 and RTI4001.
Declaration of interests
The authors report no conflict of interest.