INTRODUCTION
Myctophid fish are one of the most abundant and widespread mesopelagic fish groups in the world oceans, being key species in various ecosystems (Gjøsæter & Kawaguchi, Reference Gjøsæter and Kawaguchi1980; Brodeur & Yamamura, Reference Brodeur and Yamamura2005). They include approximately 250 species, of which approximately 20 species occur associated with submerged bottom features such as islands, seamounts, continental shelf and slope regions (Reid et al., Reference Reid, Hirota, Young and Hallacher1991; Hulley, Reference Hulley1992; Brodeur & Yamamura, Reference Brodeur and Yamamura2005; Gartner et al., Reference Gartner, Sulak, Ross and Necaise2008; Sassa et al., Reference Sassa, Tsukamoto, Yamamoto and Tokimura2010). They are defined as pseudoceanic or mesopelagic-boundary species (Reid et al., Reference Reid, Hirota, Young and Hallacher1991; Hulley, Reference Hulley1992). Benthosema pterotum (Alcock, 1890) is a typical pseudoceanic myctophid, widely distributed in the slope regions of the subtropical–tropical waters of the Indo-West Pacific (Gjøsæter & Kawaguchi, Reference Gjøsæter and Kawaguchi1980; Sassa et al., Reference Sassa, Tsukamoto, Yamamoto and Tokimura2010). This species is a small-sized fish, with a maximum body size of 55 mm standard length (SL), and has a life cycle of approximately one year (Gjøsæter, Reference Gjøsæter1984; Sassa et al., Reference Sassa, Ohshimo, Tanaka and Tsukamoto2014a). An extremely high biomass of 100 million tons has been estimated for the Arabian Sea (Gjøsæter, Reference Gjøsæter1984). In the East China Sea (ECS) which is one of the largest marginal seas of the western Pacific, B. pterotum is one of the most abundant myctophids (Sassa et al., Reference Sassa, Tsukamoto, Yamamoto and Tokimura2010).
In the ECS, dense distributions of B. pterotum are observed in all seasons, mainly in the central part of the shelf, i.e. the area south-west of Cheju Island (Figure 1), where the biomass is estimated in the order of several thousands to several tens of thousands of metric tons (Sassa et al., Reference Sassa, Tsukamoto, Yamamoto and Tokimura2010). Daytime habitat depth of adult B. pterotum is mainly 40–90 m, which is a markedly shallower depth than previous reports for adult B. pterotum and the other pseudoceanic myctophids (Sassa et al., Reference Sassa, Tsukamoto, Yamamoto and Tokimura2010; Dypvik & Kaartvedt, Reference Dypvik and Kaartvedt2013). In the ECS they occur in the epipelagic layer at night, and migrate down to the benthopelagic layer during the daytime to form dense aggregations (Yamada et al., Reference Yamada, Tokimura, Horikawa and Nakabo2007; Sassa et al., Reference Sassa, Tsukamoto, Yamamoto and Tokimura2010). Benthosema pterotum feed on small crustaceans such as copepods, euphausiids and ostracods (Ishihara & Kubota, Reference Ishihara and Kubota1997), and form a major prey item for both pelagic and demersal fish, including many commercially important species (Mio et al., Reference Mio, Tagawa, Shinohara and Yamada1984; Yamada et al., Reference Yamada, Tokimura, Horikawa and Nakabo2007; Jiang et al., Reference Jiang, Xu, Jin, Zhou and He2012, Reference Jiang, Jin, Zhou, Xue and Guo2013). Therefore, this species is a key species in the ECS, acting as an important link between secondary producers and upper trophic levels. Morphology, distribution, feeding and reproduction of B. pterotum in the ECS have been studied (Ozawa & Peñaflor, Reference Ozawa and Peñaflor1990; Ishihara et al., Reference Ishihara, Kubota and Yamada1995; Ishihara & Kubota, Reference Ishihara and Kubota1997; Sassa et al., Reference Sassa, Tsukamoto, Yamamoto and Tokimura2010, Reference Sassa, Ohshimo, Tanaka and Tsukamoto2014a), but study of the early life history, which is essential for understanding the population dynamics of this species, has been limited in the ECS.
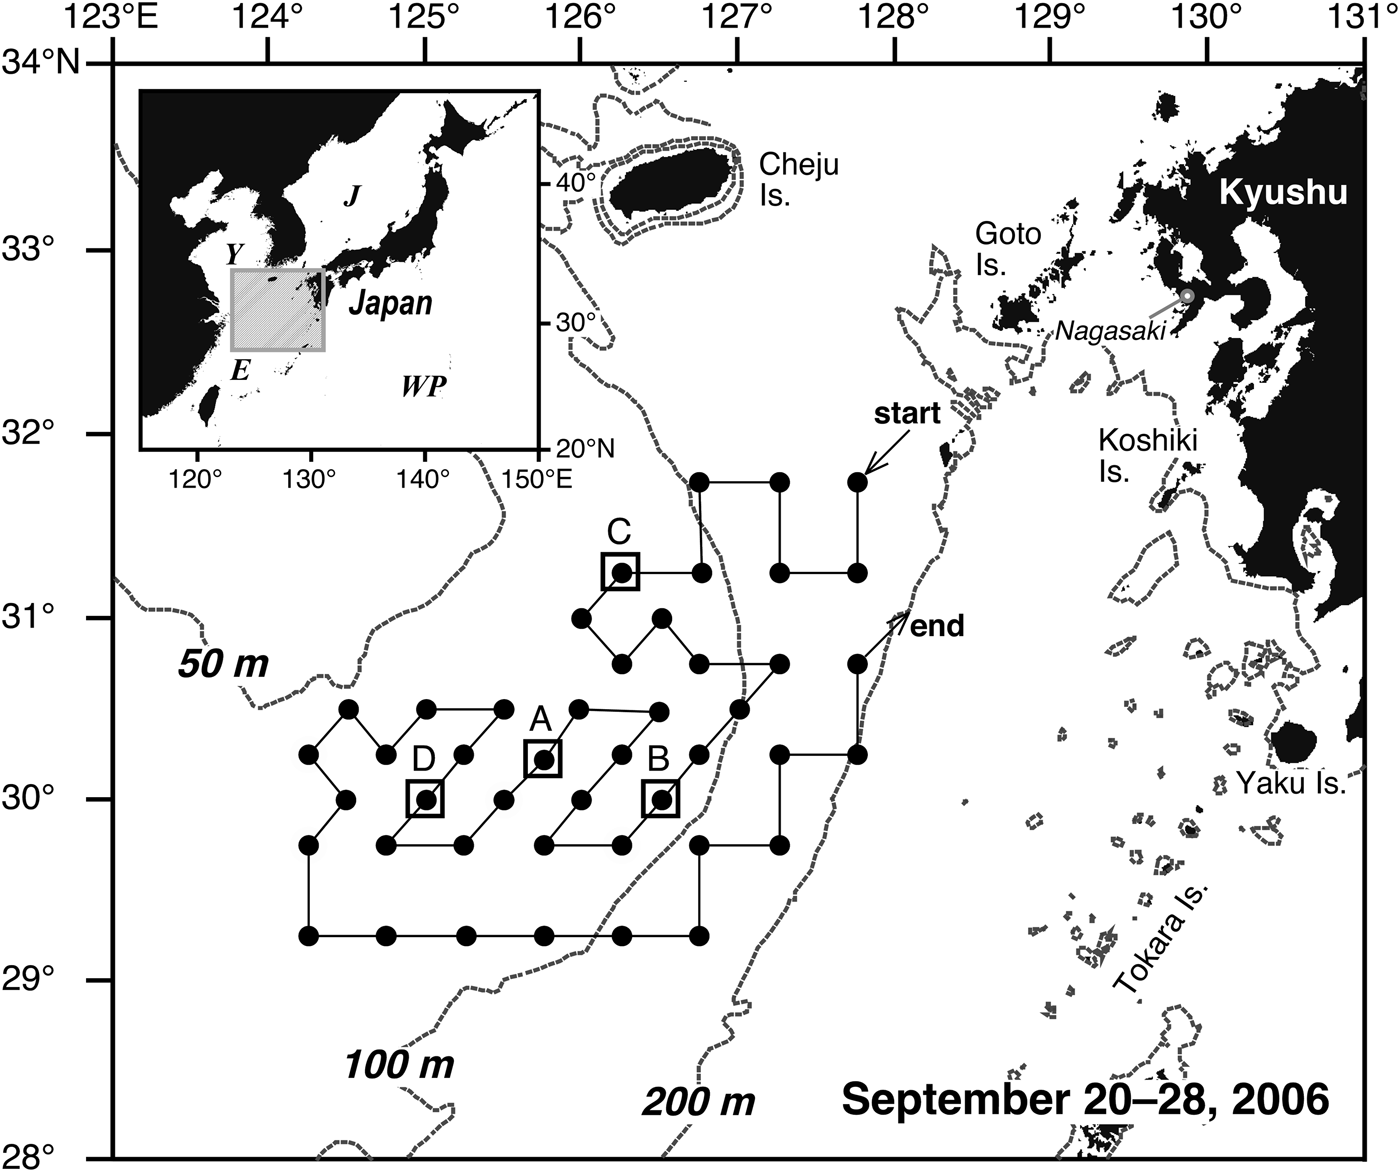
Sampling localities of Benthosema pterotum larvae in the shelf region of the East China Sea between 20 and 28 September 2006, together with the 50, 100 and 200 m isobaths. At all 45 stations, twin-NORPAC, Bongo, and ORI nets were towed. At stations enclosed by open squares, the MTD net was additionally towed. E, East China Sea; Y, Yellow Sea; J, Sea of Japan; WP, western North Pacific.

In this study, based on fine scale larval sampling surveys, we examined the early life history of B. pterotum in the shelf region of the ECS in September when the main spawning has been predicted based on the gonadal development (Sassa et al., Reference Sassa, Ohshimo, Tanaka and Tsukamoto2014a). Firstly, we describe the distribution of the larvae in relation to the adult distribution and oceanographic conditions to discuss the maintenance mechanism of the larvae. And then, based on the hatch-date of the larvae, we discuss the possible relationship between spawning and the lunar cycle. Finally, we examine the growth and mortality of the larvae, information that is limited for myctophids in the world oceans (Moser & Smith, Reference Moser and Smith1993a; Brodeur & Yamamura, Reference Brodeur and Yamamura2005). Net extrusion losses of small-sized larvae through the plankton net meshes are also provided as supplemental information that is needed for accurate estimation of larval mortality.
MATERIALS AND METHODS
Sample collection
Samples were collected at 45 stations in the shelf and shelf-break regions of the ECS during the RV ‘Yoko-Maru’ (Seikai National Fisheries Research Institute, Fisheries Research Agency; 499 t) cruise between 20 and 28 September 2006 (Figure 1) when the main spawning of B. pterotum in this region is considered to occur (Sassa et al., Reference Sassa, Ohshimo, Tanaka and Tsukamoto2014a). We used two types of sampling gears for determining the horizontal distribution of the larvae: a paired Bongo net (60 cm mouth diameter; 0.32 mm mesh) and a much larger-sized Ocean Research Institute (ORI) ring net (160 cm mouth diameter; 1.0 mm mesh; Omori, Reference Omori1965), since fish larvae of the entire size range are difficult to collect using only one type of sampling gear owing to net extrusion of smaller larvae and net avoidance by larger larvae. For small larvae the Bongo net was used, and for larger larvae the ORI net was used. Both nets were towed regardless of day or night. Flowmeter and depth recorder were attached to both nets for quantitative sampling. A double-oblique tow was conducted at each station from the surface down to 150 m depth or 10 m above the bottom at shallow stations. The Bongo and ORI nets were towed at a speed of 1.5–2 knots (0.75–1 m s−1) and 2–2.5 knots (1–1.25 m s−1), respectively, and were adjusted to maintain a wire angle of approximately 45°. A conductivity–temperature–depth profiler (CTD) with a submersible fluorometer (Clorotec, ACL220-PDK, Alec Electronics, Tokyo, Japan) was used at each sampling station to 5 m above the bottom. Specimens collected by both nets were first fixed in 10% buffered formalin-seawater for 6 h, the formalin was rinsed out with freshwater, and then transferred to 90% ethanol for preservation.
To evaluate net escapement of the small-sized larvae from the 0.32 mm mesh, a twin-NORPAC net (0.10 and 0.32 mm mesh, 45 cm diameter; Motoda, Reference Motoda1957) with flowmeters was towed vertically from close to the bottom (maximum 150 m depth) to the surface using a reeling speed of 1 m s−1 at all stations (Figure 1). Additionally, to investigate the vertical distribution of the larvae, a multi-layer depth sampler, MTD net (56 cm mouth diameter; 0.32 mm mesh; Motoda, Reference Motoda1971), was towed at 1.5 knots (0.75 cm s−1) in 4–6 target depths (0, 10, 20, 30, 40 and 50 m) for 20 min at four stations (Figure 1). Tows started at 2256 h at Station A, 2340 h at Station B, 0027 h at Station C and 1149 h at Station D. The actual sampling depth was estimated from the wire angle, wire length and depth recorder attached to the deepest net and ranged within ±10% of the target sampling depth of each net. The volume of water filtered by each net was measured with a flow meter mounted at the net mouth. Plankton samples collected by both the twin-NORPAC and MTD nets were fixed at sea with 10% buffered formalin–seawater.
In the laboratory, all B. pterotum larvae were sorted from the samples and counted. For all larvae in good condition, body lengths (BL) were measured to the nearest 0.1 mm using a measurement system that was composed of a stereomicroscope and video camera connected to a monitor and computer (Nikon Instech, Tokyo, Japan). Notochord length (NL) was measured for preflexion larvae and standard length (SL) for flexion and postflexion larvae. All larval BL were standardized as the initial fresh length using the shrinkage (%) reported by Moku et al. (Reference Moku, Mori and Watanabe2004) for myctophid larvae of Diaphus slender type spp. (5.1–10.2 mm BL) in the ECS, since we used two types of preservative which possibly affects the degree of shrinkage in the larval length. Shrinkage in 90% ethanol and 10% formalin is 4.7 and 1.1% of BL of fresh specimens, respectively (Moku et al., Reference Moku, Mori and Watanabe2004), thus the larvae sampled by the Bongo and ORI nets were adjusted by 4.7% and larvae sampled by the twin-NORPAC and MTD nets by 1.1%. Notochord flexion occurs between 4.2 and 4.5 mm BL, and formation of the caudal fin base is almost complete at approximately 5 mm BL (Ozawa, Reference Ozawa1986). Transformation from the larval to the juvenile stage begins at approximately 12 mm SL (Ozawa, Reference Ozawa1986). Thus, B. pterotum specimens <12 mm SL were analysed in this study as the larval stage.
Analyses of hydrographic conditions and larval distribution
The mixed layer depth was defined as the depth from the sea surface to the maximum depth where water temperature was almost the same as the sea surface temperature (SST), i.e. within ±1°C of SST. The chlorophyll-a fluorescence measured by the Clorotec was calibrated based on standard procedures using extracted chlorophyll-a from 250 ml water samples at 20 m depth (Sassa & Konishi, Reference Sassa and Konishi2006). The chlorophyll-a concentration (mg m−2) was integrated for the 0–40 m water column.
The number of B. pterotum larvae collected by the Bongo and ORI nets was standardized to the number per 10 m2 sea surface using the volume of water filtered by the nets and the maximum depth to which the net sampled. To examine ontogenetic change in the larval distribution, the larvae of <5 mm BL collected by the Bongo net were defined as ‘small larvae’ and the larvae of 5–11.9 mm BL collected by the ORI net as ‘large larvae’ in this study.
Larval density (individuals per 1000 m3 of water filtered by each MTD net) was calculated in describing and comparing larval distributions in distinct depth layers. To describe the vertical distribution centre of larvae, the weighted mean depth (WMD) of B. pterotum larvae was calculated using the following equation for each station:
 $${\rm WMD} = \displaystyle{{\sum\nolimits_{i = 1}^n ({bpd_i} \times d_i)} \over {\sum\nolimits_{i= 1}^n bpd_{i}}}$$
where bpd i and d i are the densities of larvae in the i-th sampling layer (individuals 1000 m−3) and the depth of the i-th layer, respectively.
Catches of larval fish by plankton net are known to differ between day and night, usually higher at night due to lower visual net avoidance, which would affect the analyses of larval distribution and mortality (Watanabe et al., Reference Watanabe, Oozeki and Kitagawa1997). To analyse the possible difference in larval catches among diel time periods, abundances of the small and large larvae were grouped into day (0630–1830 h) and night (1830–0630 h). Then, differences in the abundances between the day and night were examined using the Mann–Whitney U-test.
The weighted mean (WM) of temperature, salinity and chlorophyll-a concentration (WMT, WMS and WMC, respectively) of B. pterotum habitat for each of the two body size-class were calculated using the following equations:
 $${\rm WM=}\displaystyle{{\sum\nolimits_{i=1}^{n} ({bpa}_{i} \times x_i)} \over \sum\nolimits_{i=1}^{n} bpa_i}$$
where bpa i is the abundance of B. pterotum larvae in the i-th sampling station (individuals 10 m−2) and x i is the temperature (°C), salinity (psu) at 5 m depth or the chlorophyll-a concentration (mg m−2) at the i-th sampling station.
The weighted standard deviation (sdw) of WMT, WMS and WMC was calculated using the following equation:
 $${\rm sd_w=}\sqrt {\displaystyle{{\sum\nolimits_{i=1}^{n} {\mathop {\lpar {x}_{i} - {\bar x}_{w} \rpar }\nolimits^ 2 { bpa}_{i}} } \over {\left[{\sum\nolimits_{i=1}^{n} {{ bpa}_{i}} } \right]- 1}}} $$
where x
i
is the observation (i.e. temperature, salinity and
chlorophyll-a concentration) of the
i-th sampling station and
 ${\bar x}_{w} $
is the weighted mean of the observation (i.e. WMT, WMS and
WMC, respectively).
Net extrusion
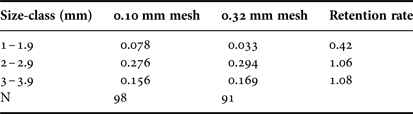
Studies of the calculation of mortality rates from BL frequencies will incorporate serious bias if net extrusion losses of larvae through the net meshes by the combined effects of hydraulic pressure, larval morphology and net mesh size are overlooked (Johnson & Morse, Reference Johnson and Morse1994). In this study, the length-specific catch ratio of 0.32 and 0.10 mm meshes from twin-NORPAC tows was used to compute the net extrusion of B. pterotum larvae from the 0.32 mm mesh. The 0.10 mm mesh was considered to be extrusion-free. Data of the net tows with at least one mesh size having a positive catch were used (total of 14 stations). Benthosema pterotum larvae <4 mm BL were grouped into 1 mm BL size-classes, and mean density (individuals m−3) of each larval size-class was compared between the two meshes.
Otolith analysis, hatch dates and growth rates
A total of 98 B. pterotum larvae in good condition were used for the otolith analysis. Of these, 51 specimens ranging from 1.3 to 5.1 mm BL (3.0 ± 1.0 mm BL; mean ± standard deviation (SD)) were collected by the Bongo net and 47 specimens ranging from 4.5 to 11.4 mm BL (7.9 ± 2.1 mm BL) by the ORI net. Our study covered almost all larval stages after yolk-sac absorption. Sagittal otoliths were extracted using a dissecting microscope at 10–40× magnification and embedded on a glass slide with enamel resin. Since otoliths increment from individuals >9 mm BL were not clearly visible without polishing, the otoliths were ground using 2000 grit sandpaper and polished using 8000 grit lapping film or 3 µm alumina powder. Otolith radii were measured and the total number of otolith growth increments was counted using an otolith measurement system, consisting of a light microscope at 400–1000× magnification equipped with CCD camera controlled by PC (Ratoc System Engineering Co. Ltd., Tokyo, Japan). The first increment was observed at approximately 6 µm from the core, as previously reported by Ozawa & Peñaflor (Reference Ozawa and Peñaflor1990). Since daily otolith increments of myctophid fish have been validated in sagittal otoliths through marginal increment analyses (Gartner, Reference Gartner1991; Suthers, Reference Suthers1996; Hayashi et al., Reference Hayashi, Kawaguchi, Watanabe and Ishida2001; Moku et al., Reference Moku, Ishimaru and Kawaguchi2001, Reference Moku, Hayashi, Mori and Watanabe2005), we postulated that the increments were deposited daily. Although the first increment is deposited a few days after hatching in most fish species reported based on rearing experiments, there is no information on timing of the first deposition for myctophids. In this study the total number of increments was considered as age, thus it is possibly underestimated by a few days.
The relationships between BL and otolith radius and between BL and age were fitted using linear, allometric, exponential and logarithmic formulae using the least squares method to adopt the best fitted formulae. Weight-specific instantaneous rate of growth (G w) and the relative rate of growth (K) were estimated as follows (Yamashita & Bailey, Reference Yamashita and Bailey1989):
 $$W_t=W_o \cdot {\rm e}^{{G}{\rm w} \cdot {t}} $$
 $$K={\rm e}^{{G}{\rm w}} - 1$$
where W t is the dry weight (mg) at time t (in days) and W 0 is the estimated dry weight at hatching. The daily weight-specific growth rate was defined as K (×100%). The dry weight of B. pterotum larvae was estimated from the BL using the following relationship; W = 0.0010L 3.3870 (n = 64, r 2 = 0.987, range of BL = 1.6–14.4 mm), where W is the dry body weight (μg) and L is BL (mm) (C. Sassa, unpublished data).
Age of all B. pterotum larvae collected by both Bongo and ORI nets was estimated from the obtained relationship between BL and age. Then, hatch-date was estimated by subtracting the age from the collection date for each larva. Based on incubation of artificially fertilized eggs of B. pterotum, hatching takes place approximately 10 h after fertilization at 25°C (Gjøsæter & Tilseth, Reference Gjøsæter and Tilseth1988).
Mortality
Larvae collected by the Bongo net were classified into eight size-classes of 0.5 mm intervals in each sampling station: 1.5–1.9, 2–2.4, 2.5–2.9, 3–3.4, 3.5–3.9, 4–4.4, 4.5–4.9 and 5–5.4 mm BL. Larvae ≥5.5 mm BL were not included in the mortality analysis due to the small number caught (see ‘Results: Larval size and abundance’ below). After the corrections for net escapement for the smallest size-class larvae (see ‘Results: Net extrusion’ below), we obtained the BL frequency distribution of each tow sample. Mean number of fish per 10 m2 of sea surface in the eight size-classes was calculated from all net tow samples.
Based on the larval growth, we calculated mid-ages and durations in days of the eight size-classes at 0.5 mm intervals. The mean larval abundance (per 10 m2) in each of the eight size-classes was divided by duration of the corresponding size-classes and daily larval production was obtained for each size-class. Estimates of daily production of each of the eight size-classes were then plotted against the mid-ages of the size-classes and daily instantaneous mortality coefficients were estimated applying the exponential model of decline (Watanabe et al., Reference Watanabe, Oozeki and Kitagawa1997):
 $$P_t=P_o=W_0 \cdot {\rm e}^{ -{Z} \cdot {t}} $$
where P t is the daily larval production (per 10 m2) at time t (in days), P 0 is the daily larval production at hatching and Z is the daily instantaneous mortality coefficient.
The mortality rate as percent mortality d−1 (A) was calculated by:
 $$A=100 \cdot \lpar 1 - {\rm e}^{ - {Z}} \rpar $$
RESULTS
Oceanographic conditions
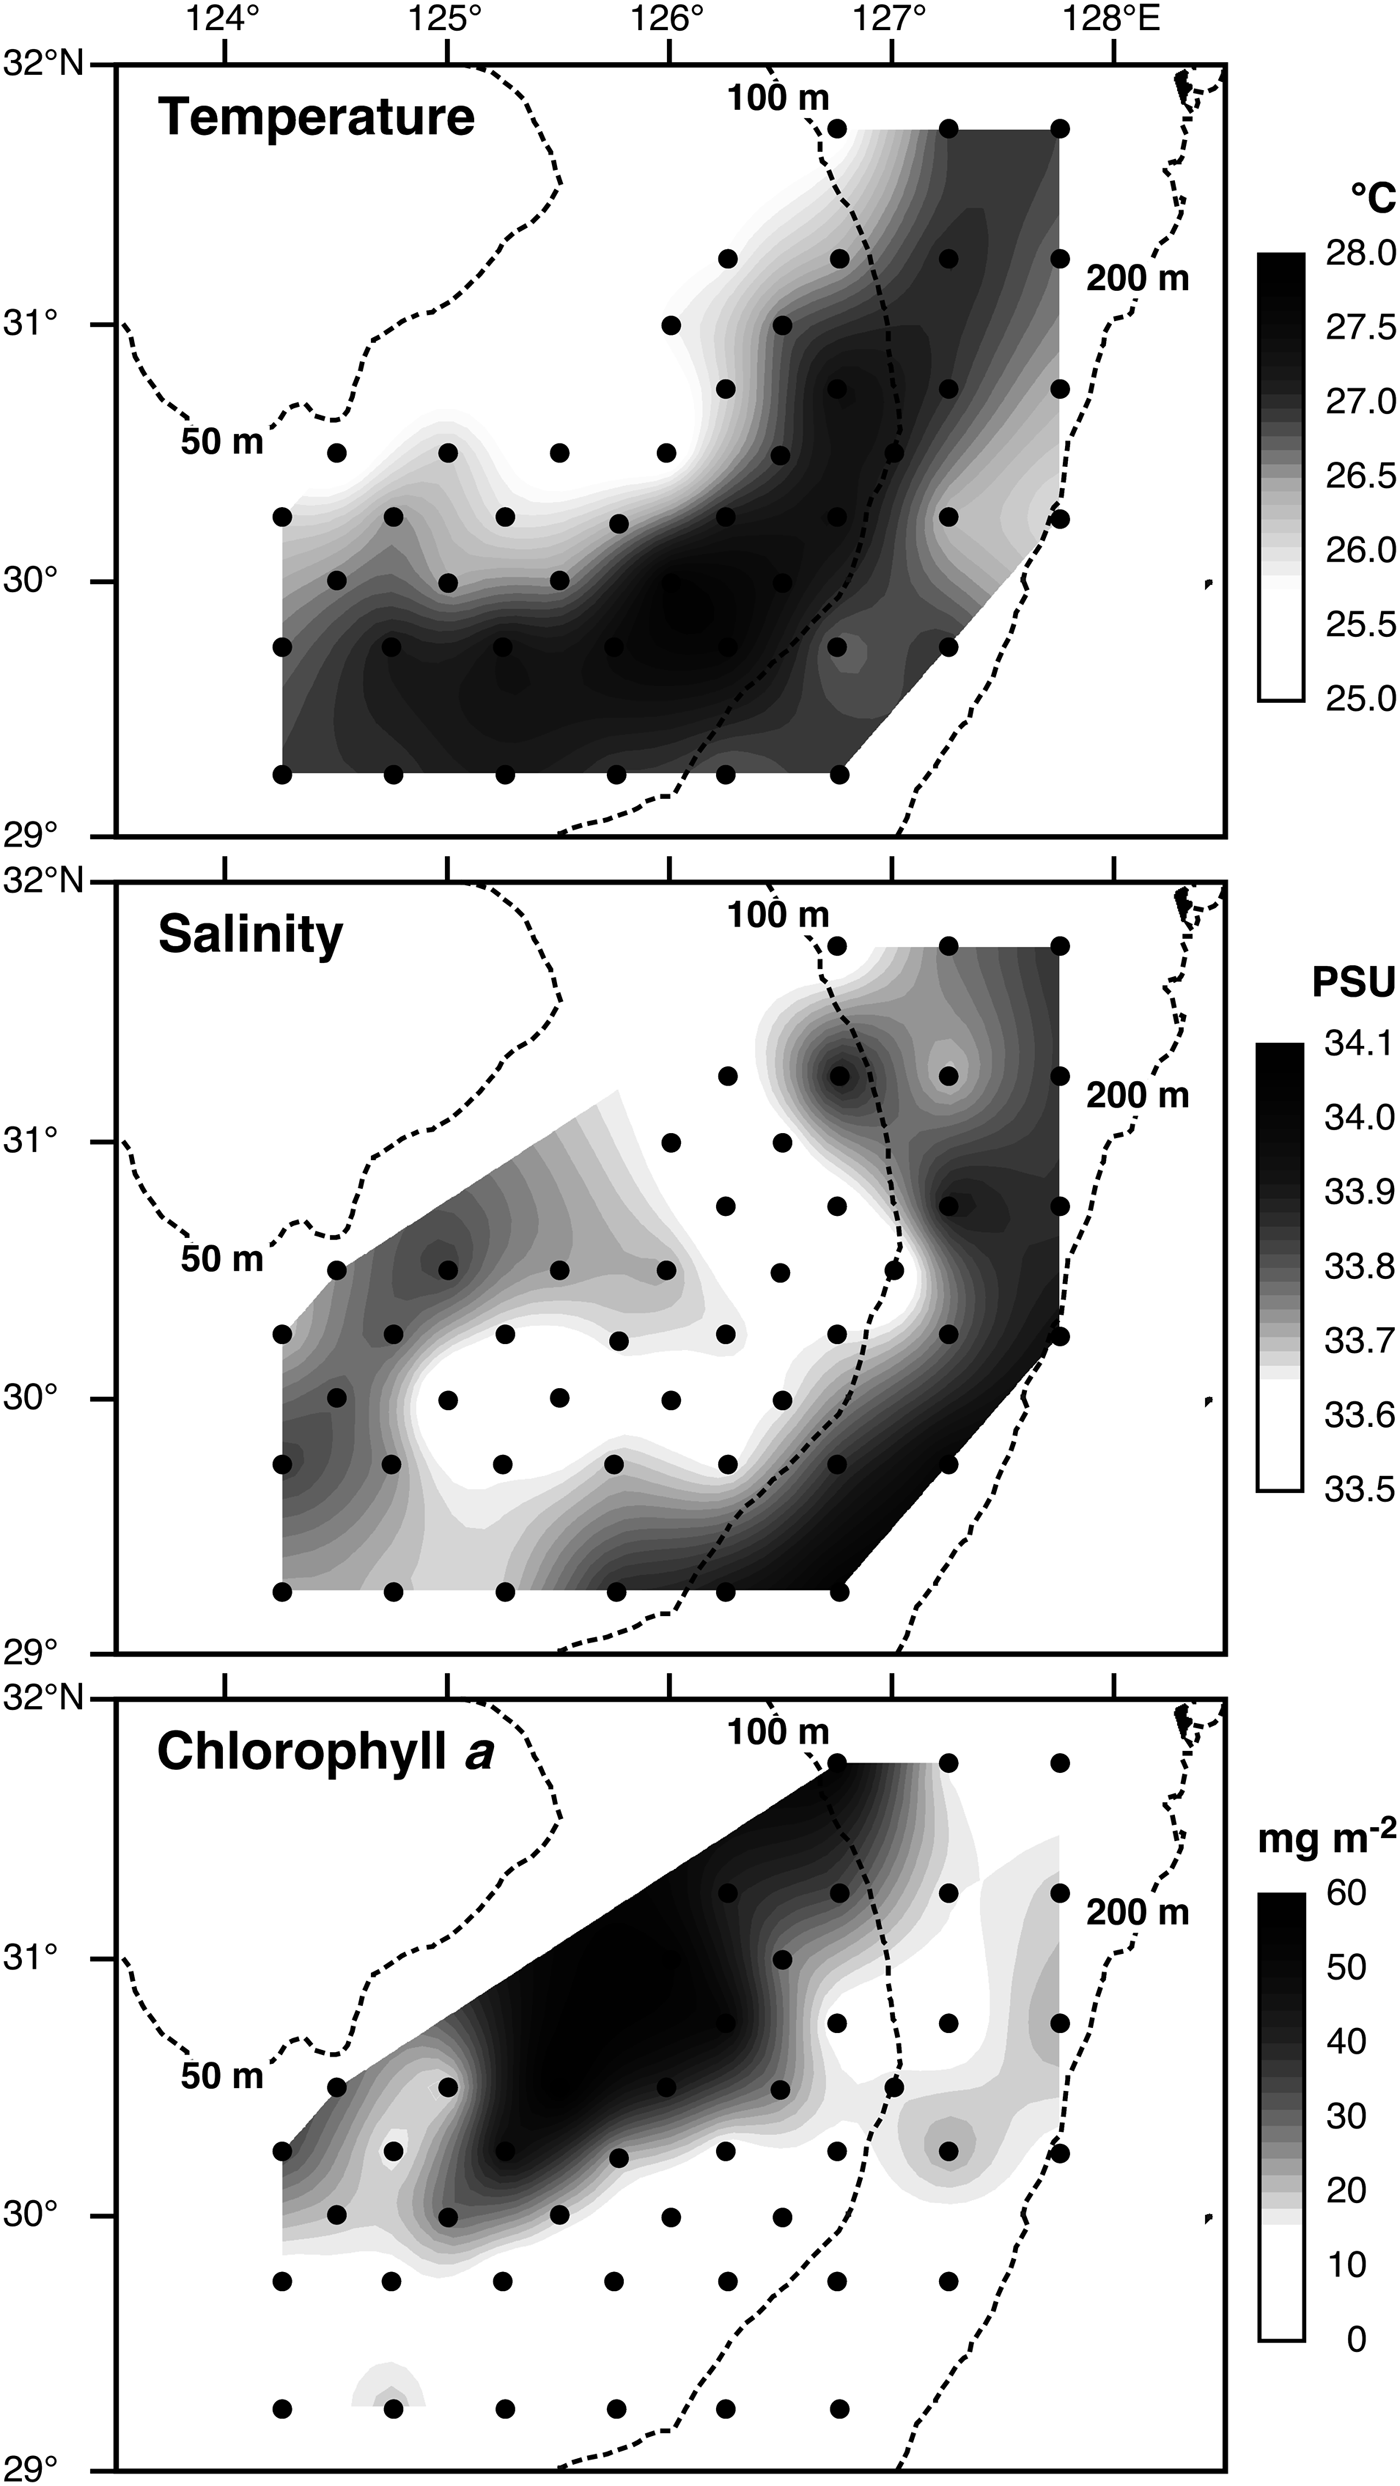
The mean and SD of mixed layer depth in the 45 sampling stations was 42.7 ± 8.2 m (range, 24.0–59.0 m). Temperature and salinity in mixed layer ranged from 25.2 to 27.9°C and from 33.51 to 34.06 psu, respectively. Since B. pterotum larvae mainly occurred in the mixed layer during both day and night (see ‘Results: Vertical distribution’ below), the temperature and salinity fields in the 5 m depth (i.e. within the mixed layer) are shown in Figure 2 to describe the larval habitat conditions. Warm waters 26–28°C occurred over a broad area, except in the north-western part of the study area where waters <26°C extended southward.
Horizontal distributions of temperature (°C) and salinity (psu) at 5 m depth, and chlorophyll-a concentration (mg m−2) integrated for the first 40 m of the water column in the shelf region of the East China Sea between 20 and 28 September 2006. The 50, 100 and 200 m isobaths are shown with dashed lines.

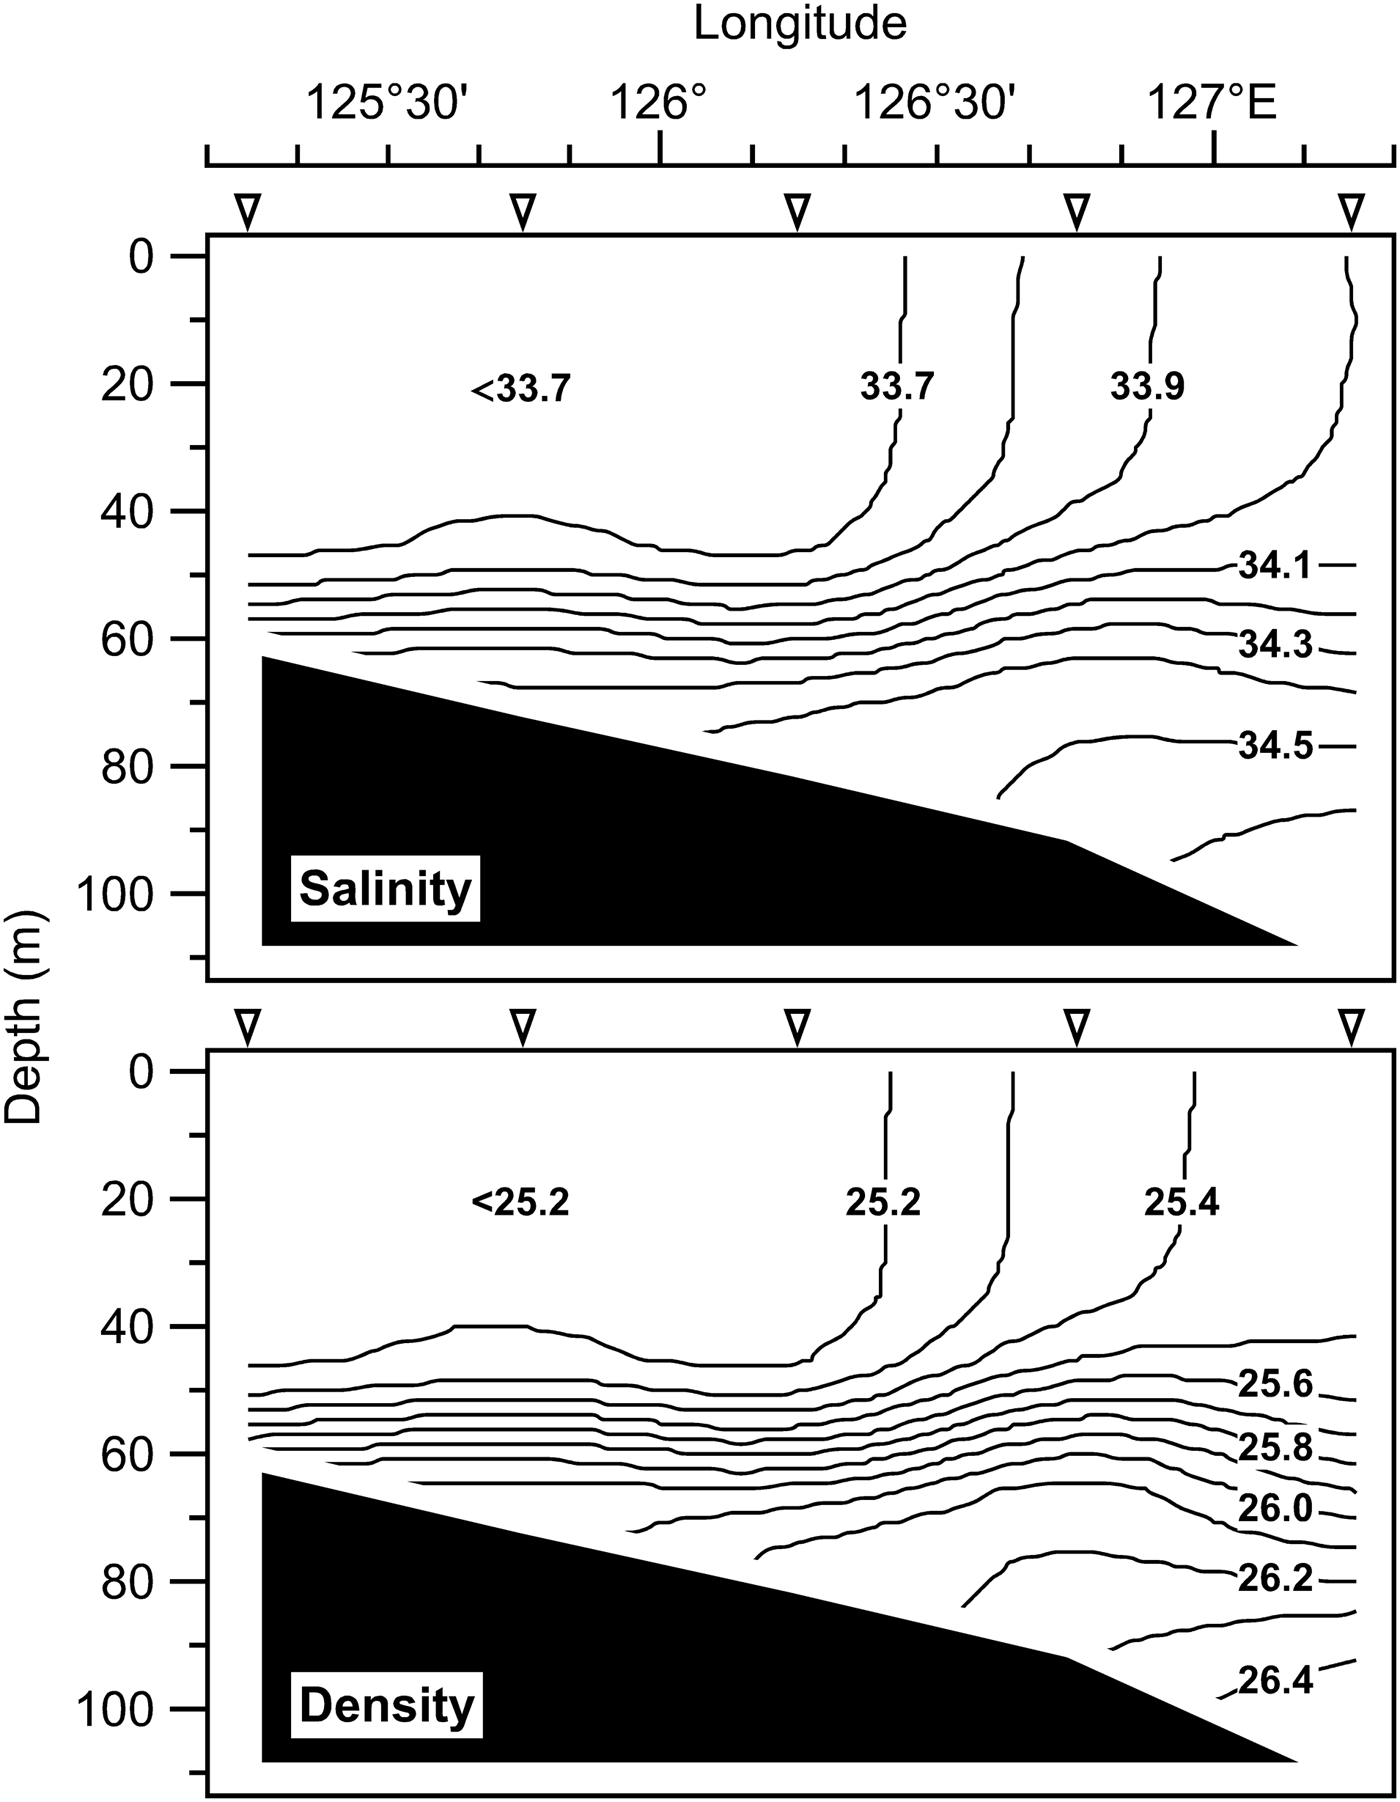
The salinity mainly affects density (sigma-t) fields in this study area and there was a strong positive relationship between salinity and density at 5 m depth (Pearson's correlation coefficient test: r = 0.964, N = 45, P < 0.05). The salinity was high (>33.8 psu) in the area deeper than 100 m depth, while it was low (<33.7) in the area shallower than 100 m depth, with the lowest salinity waters of 33.5–33.6 in the central part of the study area. The shelf-break salinity front defined by 33.7 isohaline was formed along the 100 m isobath (Figure 2). Figure 3 shows typical salinity and density profiles in the frontal area along 29°45′N latitude. There was a strong halocline between 40 and 60 m depth. The vertical isohalines were found east of 126°20′E in the upper 40 m layer, and a similar frontal structure was observed in the other transects across the shelf-break region. The density profile was closely related to the salinity profile (Figure 3), also indicating that the salinity was the main factor affecting the density in the study area.
Salinity (psu) and density (sigma-t) profiles along 29°45′N latitude. White arrowheads on the horizontal axis indicate the sampling stations.

High chlorophyll-a concentration was usually observed below the thermocline, except for several stations where the chlorophyll-a maximum was observed in the lower part of the mixed layer (Figure 4). Chlorophyll-a concentration integrated for the first 40 m of the water column ranged from 3.6 to 52.6 mg m−2 in the 45 sampling stations. Chlorophyll-a concentration showed a negative correlation with the temperature field (r = −0.792, n = 45, P < 0.05), and high concentrations (>20 mg m−2) were restricted in the area <26°C (Figure 2).
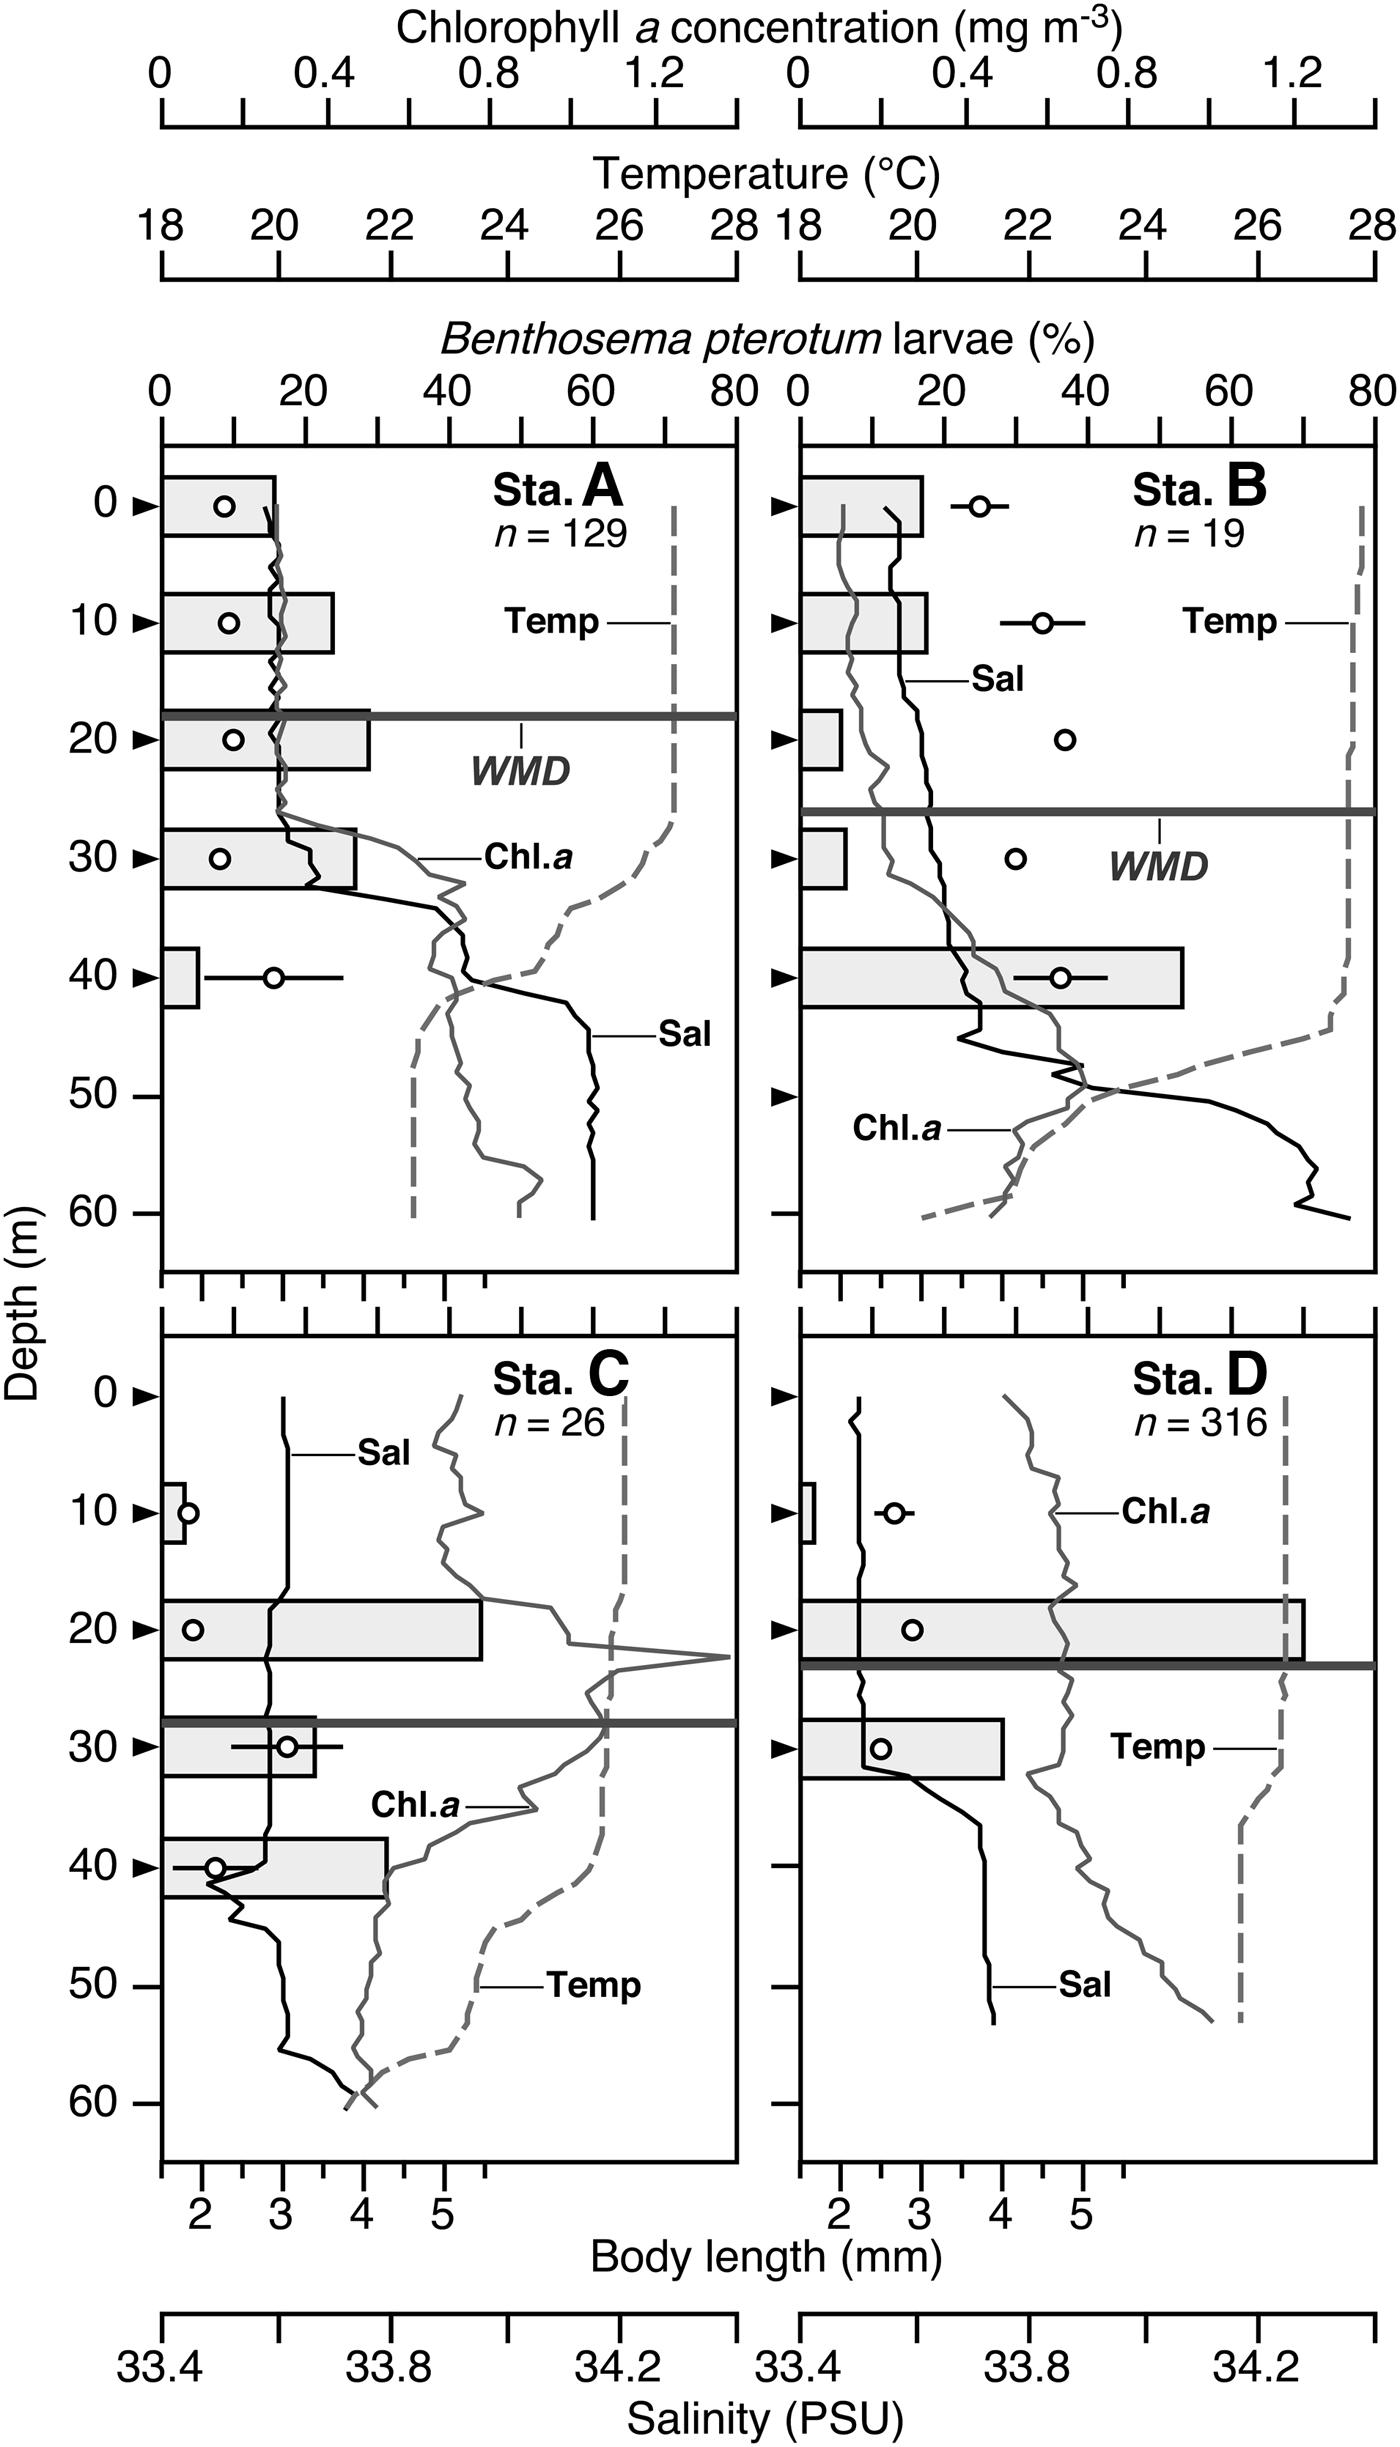
Vertical distribution of Benthosema pterotum larvae in relation to vertical temperature (dashed lines), salinity (black lines), and chlorophyll-a concentration (grey lines) profiles in the shelf region of the East China Sea. White circles and horizontal bars indicate the mean ± SE of larval body length at each sampling depth. Black arrowheads on the vertical axis indicate the target larval sampling depths. Horizontal lines indicate the weighted mean depth (WMD) of the larvae. Sampling was conducted at night in Stations A, B and C, and during the day in Station D. The mixed layer depth at Stations A, B, C and D was 32, 45, 40 and 31 m, respectively. n, total number of fish collected.

Net extrusion
The 0.32 mm mesh retained 0.42 of the 0.10 mm mesh catch of B. pterotum larvae <2 mm BL (Table 1). On the other hand, in the larvae of 2–2.9 and 3–3.9 mm BL size-classes, catches were not different between the two meshes, showing that the 0.32 mm mesh retained all larvae ≥2 mm BL. Therefore, in the larval mortality estimation, the abundance of larvae <2 mm BL were corrected by this size-dependent correction factor of 0.42 (see ‘Results: Survival’ below), since the towing speeds of both the twin-NORPAC and Bongo nets were approximately 1 m s−1 and a similar hydraulic pressure can be expected during the tows.
Size-specific sample mean (individuals m−3) of Benthosema pterotum larvae collected by twin-NORPAC net (0.10 and 0.32 mm mesh) and retention rates in 0.32 mm mesh nets. Data of tows with at least 1 mesh having a positive catch were used (total of 14 stations).

N, total number of specimens collected.
Vertical distribution
The WMD of B. pterotum larvae at the 4 stations ranged from 18.2 to 28.0 m (Figure 4). The larvae were distributed within the mixed layer above the thermocline, but some variations in distribution depths were also observed among the stations (Figure 4). At Station A, the larval distribution extended from the surface to the 30 m layer, while at Station B where the relatively deep mixed layer was observed, it extended from the surface to the 40 m layer, with a peak near the bottom of the mixed layer. At Stations C and D, the larvae were concentrated in the lower part of the mixed layer of 20–40 and 20–30 m depth, respectively. There was no clear relationship between mean BL and depth, which would be related to the vertical mixing of the water column (Figure 4). Although only five individual larvae >6 mm BL were sampled by the MTD net, they were always collected in the deepest layer where the larvae occurred at each station.
Larval size and hatch dates
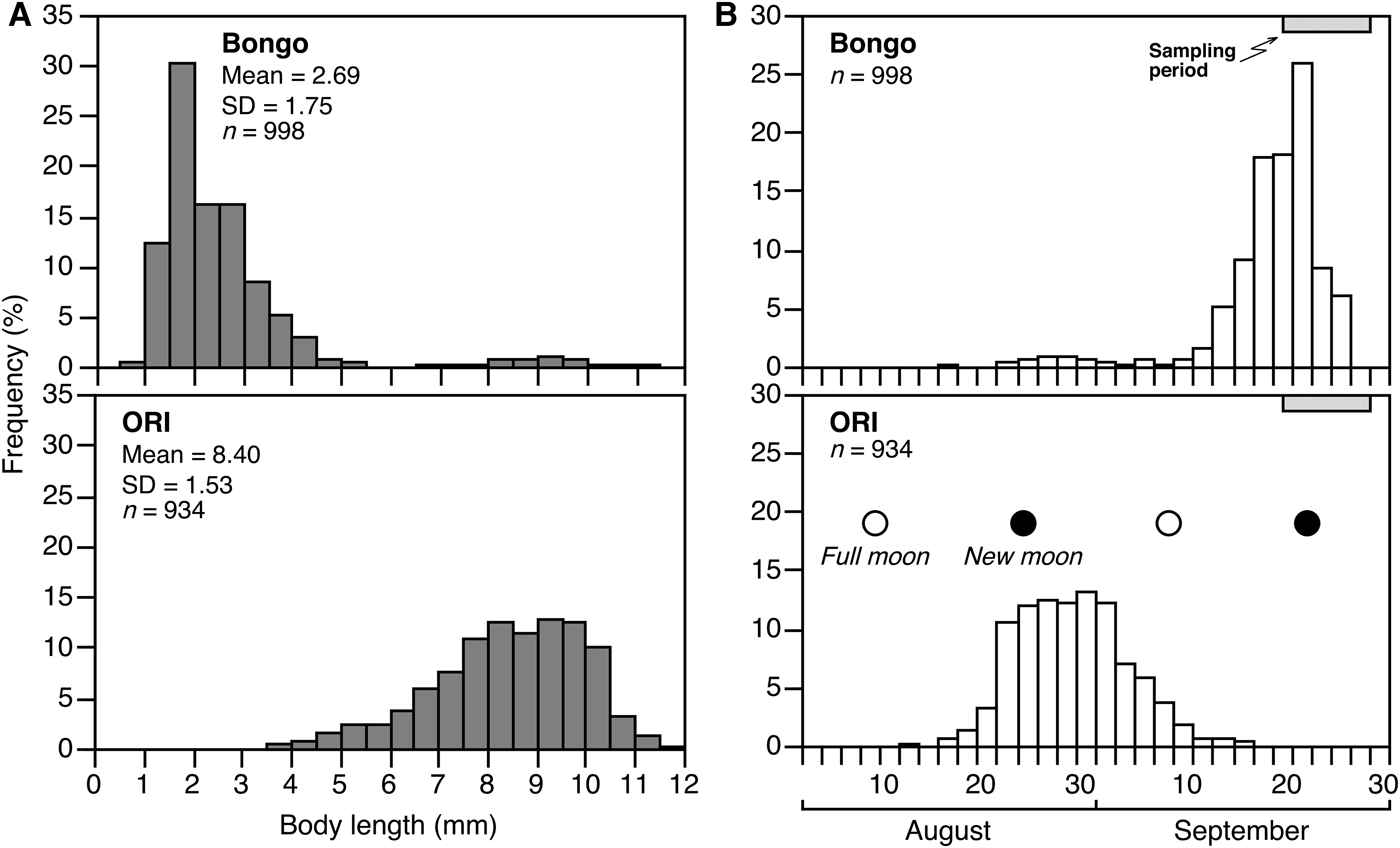
A total of 1078 and 938 B. pterotum larvae were collected by the 45 Bongo and ORI net tows, respectively. In the Bongo net samples, larval size ranged from 0.9 to 11.3 mm BL (mean 2.7 mm BL), a clear mode was observed in <4 mm BL, with another much lower mode of 8–10 mm BL (Figure 5A). In the ORI net samples, larval size ranged from 3.6 to 11.9 mm BL (mean 8.4 mm BL), with a mode of 7.5–10.5 mm BL (Figure 5A), which corresponded with the second mode in the Bongo net samples. Since formation of the caudal fin base is almost complete at approximately 5 mm BL, most of the Bongo net collected larvae were at the preflexion and flexion stages, while most of the ORI net collected larvae were at the postflexion stage.
Frequency distributions of body length (A) and back-calculated hatch dates (B) of Benthosema pterotum larvae in the shelf region of the East China Sea in September 2006. Horizontal bars in (B) indicate the duration of cruise during which samples were collected. Moon period is superimposed on the hatch-date distribution in (B). n, total number of fish analysed. Bongo, Bongo net samples; ORI, ORI net samples.

Modes of hatch dates appeared from mid to late September in the Bongo net samples, and from late August to early September in the ORI net samples (Figure 5B). Since our sampling period and the hatch-date distribution largely overlapped in late September, our sampling was conducted during one of the primarily spawning periods. When moon period was superimposed on the hatch-date distribution, mid to late September-hatched individuals coincided closely with the new moon period (Figure 5B). Although late August to early September-hatched individuals showed a longer period of peak occurrence compared to the later-hatched individuals, the peak roughly corresponded with the new moon period (Figure 5B). On the other hand, individuals that hatched during the full moon were rare.
Abundance and horizontal distribution
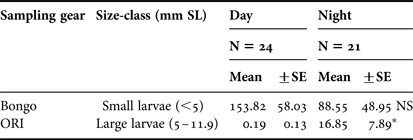
Mean abundances of the small larvae (<5 mm BL) collected by the Bongo net showed no significant difference between day and night (Mann–Whitney U-test, P > 0.05) (Table 2), thus we pooled these diel periods for analyses of the larval distribution and mortality. In contrast, mean abundance of the large larvae (5–11.9 mm BL) collected by the ORI net during the daytime was significantly lower than the abundance at night (Mann–Whitney U-test, P < 0.05) (Table 2). Thus, we excluded the daytime catch data for analysis of the distribution of the large larvae.
Mean abundance (individuals 10 m−2) and its standard error (±standard error (SE)) of Benthosema pterotum larvae during the day and night in the two body size-classes.
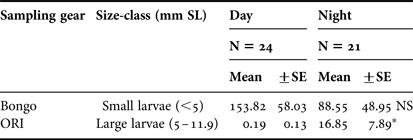
N, total number of sampling stations. *, P < 0.05; NS, not significant.
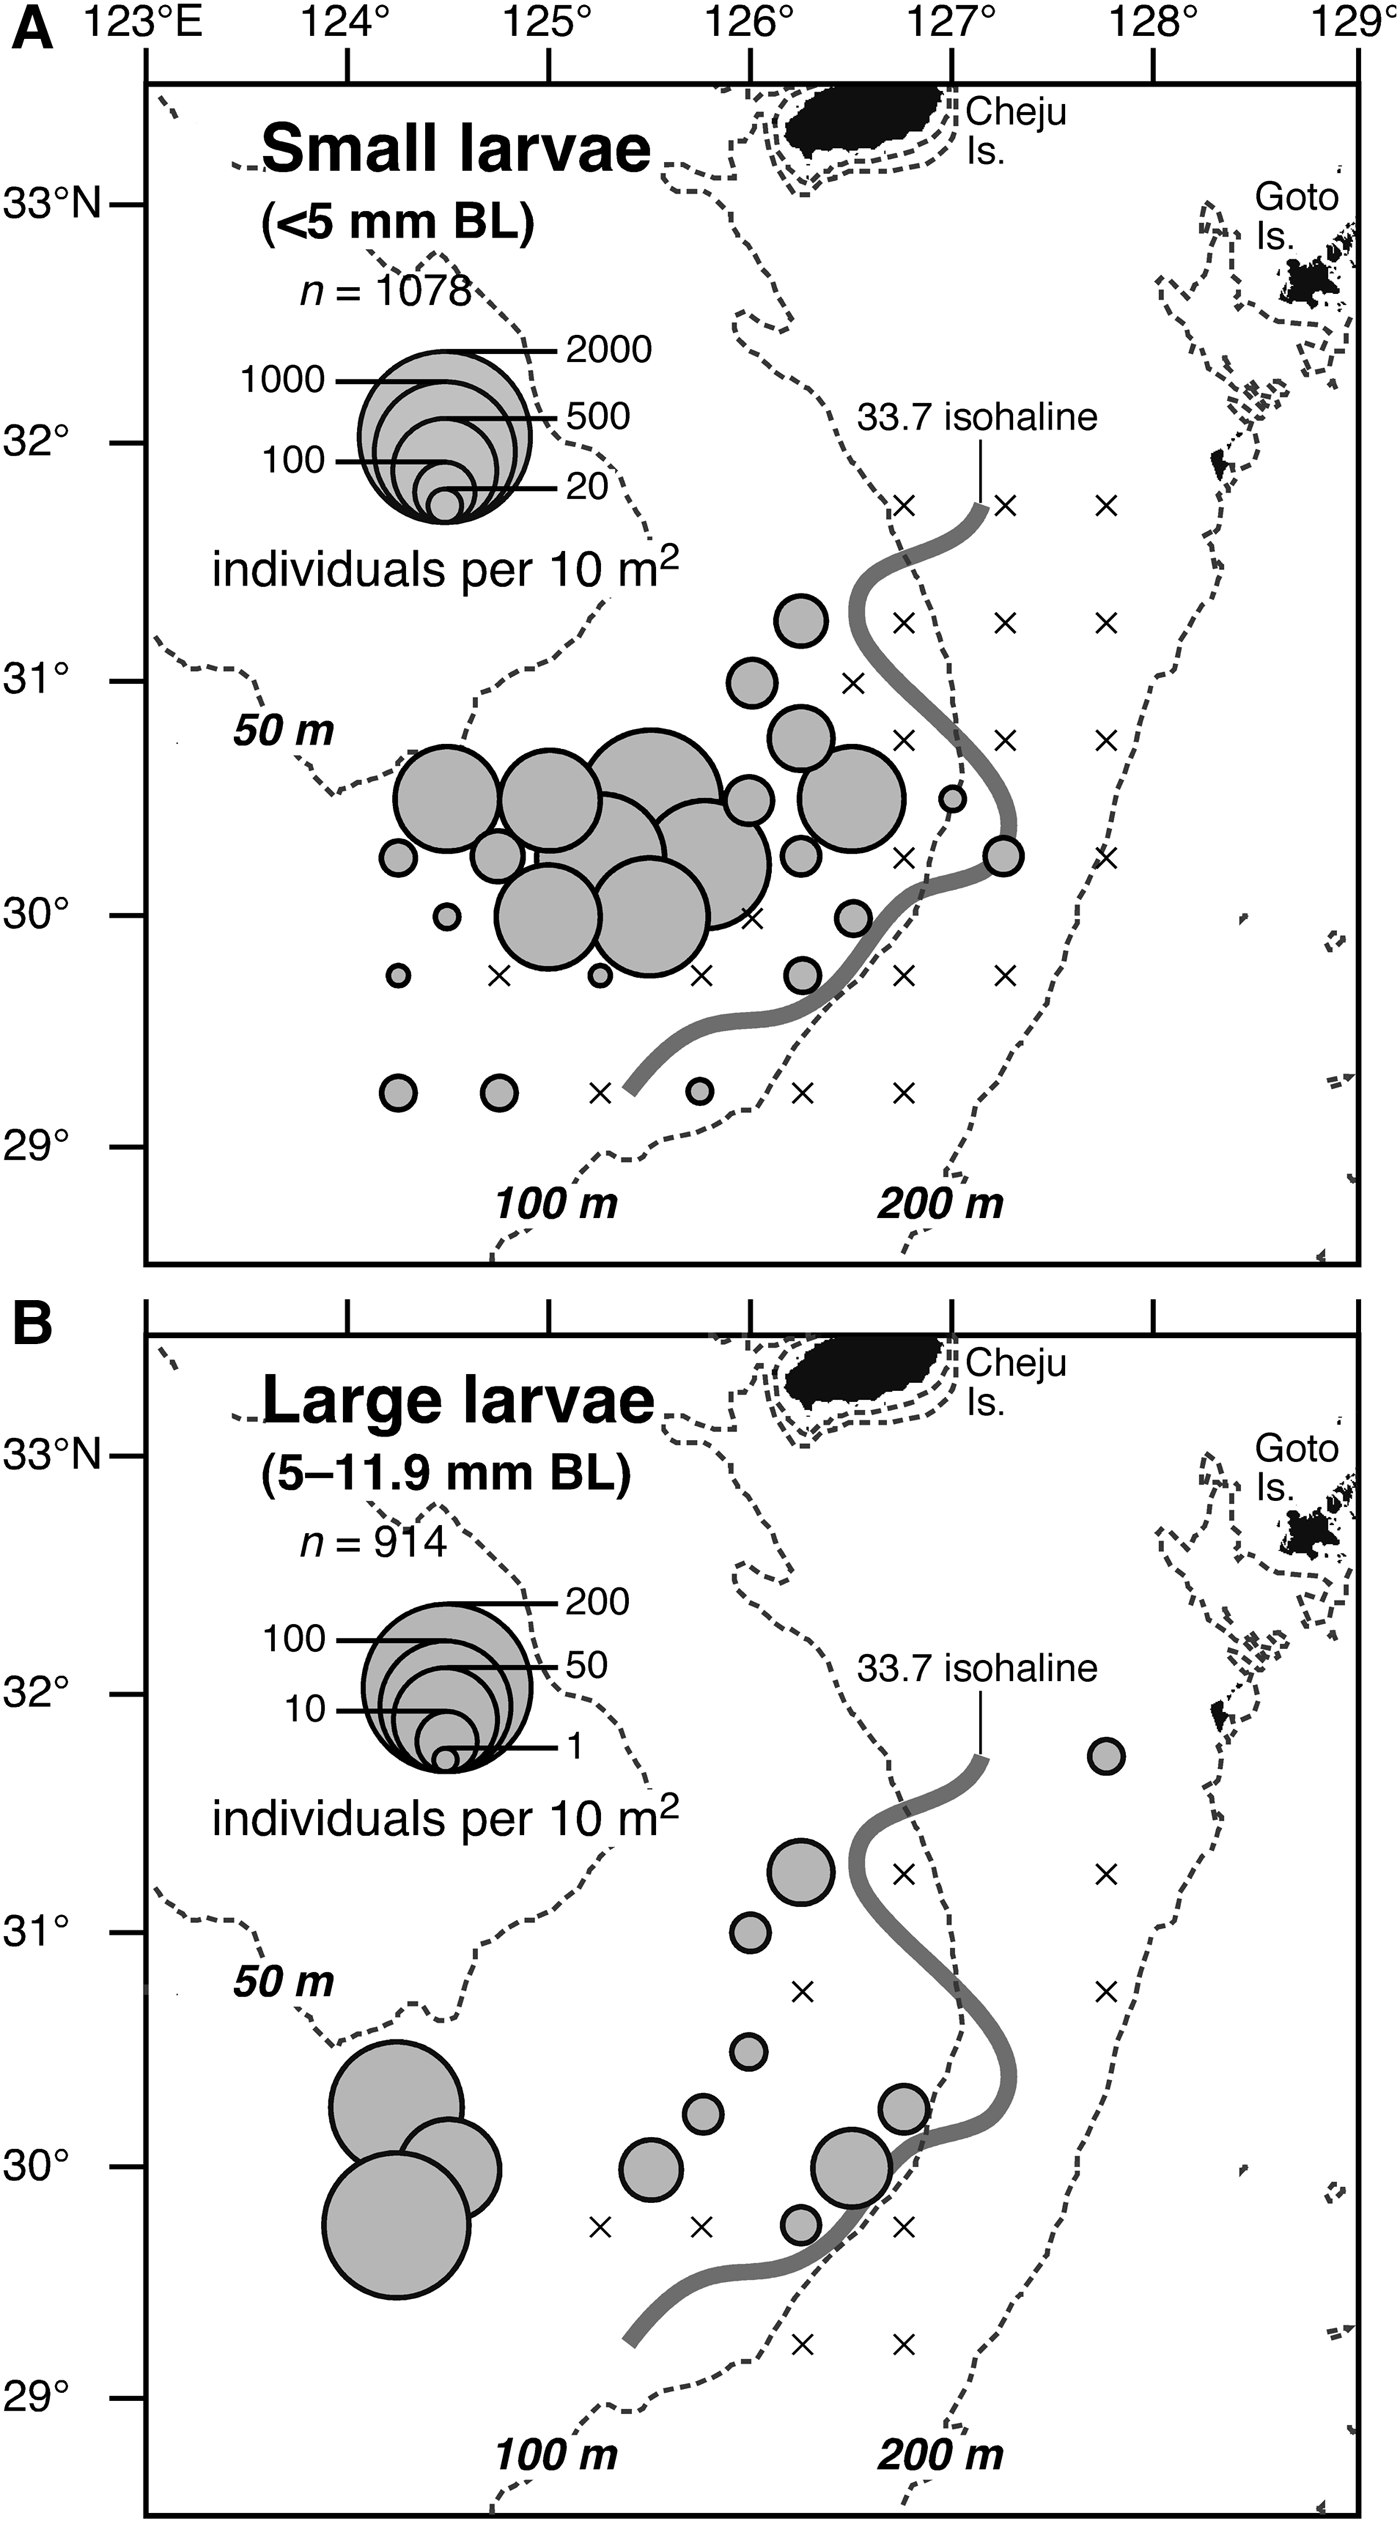
Occurrence of the small larvae was restricted to the onshore side of the shelf-break salinity front (33.7 isohaline at 5 m depth) that was formed along the 100 m isobath (Figure 6A). The mean ± standard error (SE) of abundance per positive station was 229.4 ± 63.1 individuals 10 m−2 (range, 5.8–1281.7 individuals 10 m−2, N = 28). Dense distributions (>500 individuals 10 m−2) of the small larvae were observed in a narrower area between 30° and 30°30′N and between 124°30′ and 126°E at the bottom depth between 60 and 80 m (Figure 6A). This dense distribution corresponded with the area where waters <26.5°C extended southward into our study area and high chlorophyll-a concentrations (>20 mg m−2) were observed (Figure 2).
Horizontal distributions of Benthosema pterotum larvae in the shelf region of the East China Sea. Circles represent abundances (individuals 10 m−2) as a continuous range of values. Crosses indicate no catch. Grey line represents the 33.7 psu isohaline at 5 m depth. n, total number of larvae collected. The 50, 100 and 200 m isobaths are shown with dashed lines. For ORI net collected larvae, we used only catch data during the night-time.

The large larvae also occurred in the onshore side of the shelf-break salinity front (Figure 6B). Although the nighttime samplings in the area where the small larvae occurred abundantly were restricted, the distribution of the large larvae was slightly different from that of the small larvae (Figure 6B). That is, the highest abundances of the large larvae (46.9–139.7 individuals 10 m−2) were observed at the westernmost three stations where the small larvae occurred in low abundance.
The WMTs of the small and large larvae habitats were 26.1 and 26.5°C, respectively (Table 3). The WMS was 33.7 in both size-class habitats. The WMC of the small larvae habitat showed a high value of 29.4 mg m−2 (Table 3). Although the WMC of the large larvae habitat was lower (17.0 mg m−2) compared to the value of the small larvae (Table 3), it was much higher than that in the offshore side of the shelf-break salinity front where chlorophyll-a concentrations were <10 mg m−2 (Figure 2).
Weighted mean temperature (WMT, °C), salinity (WMS, psu), and chlorophyll-a concentration (WMC, mg m−2), and the weighted standard deviations (sdw) of Benthosema pterotum larvae habitat in the two body size-classes.

Growth
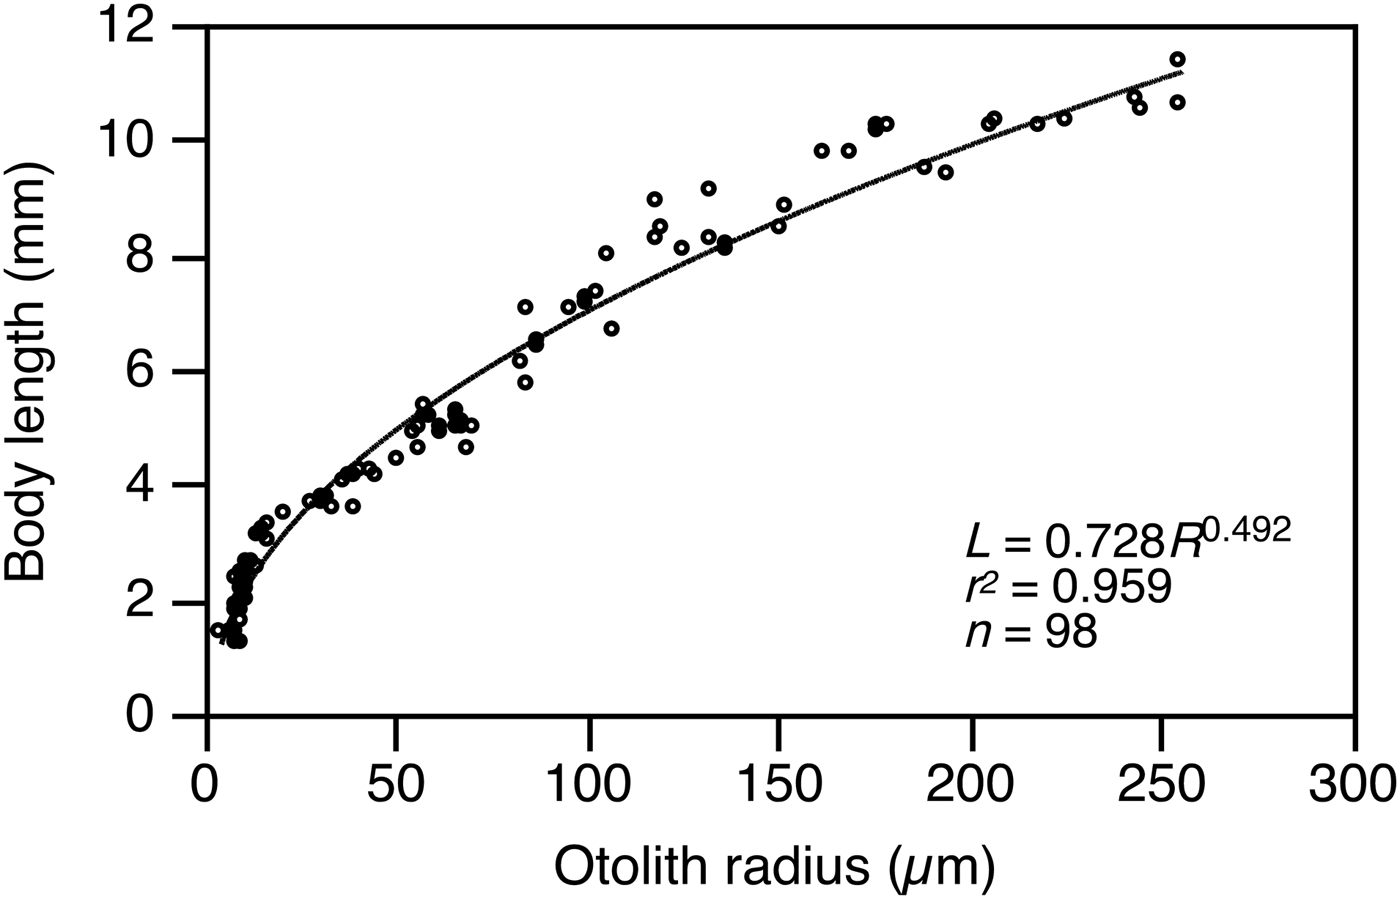
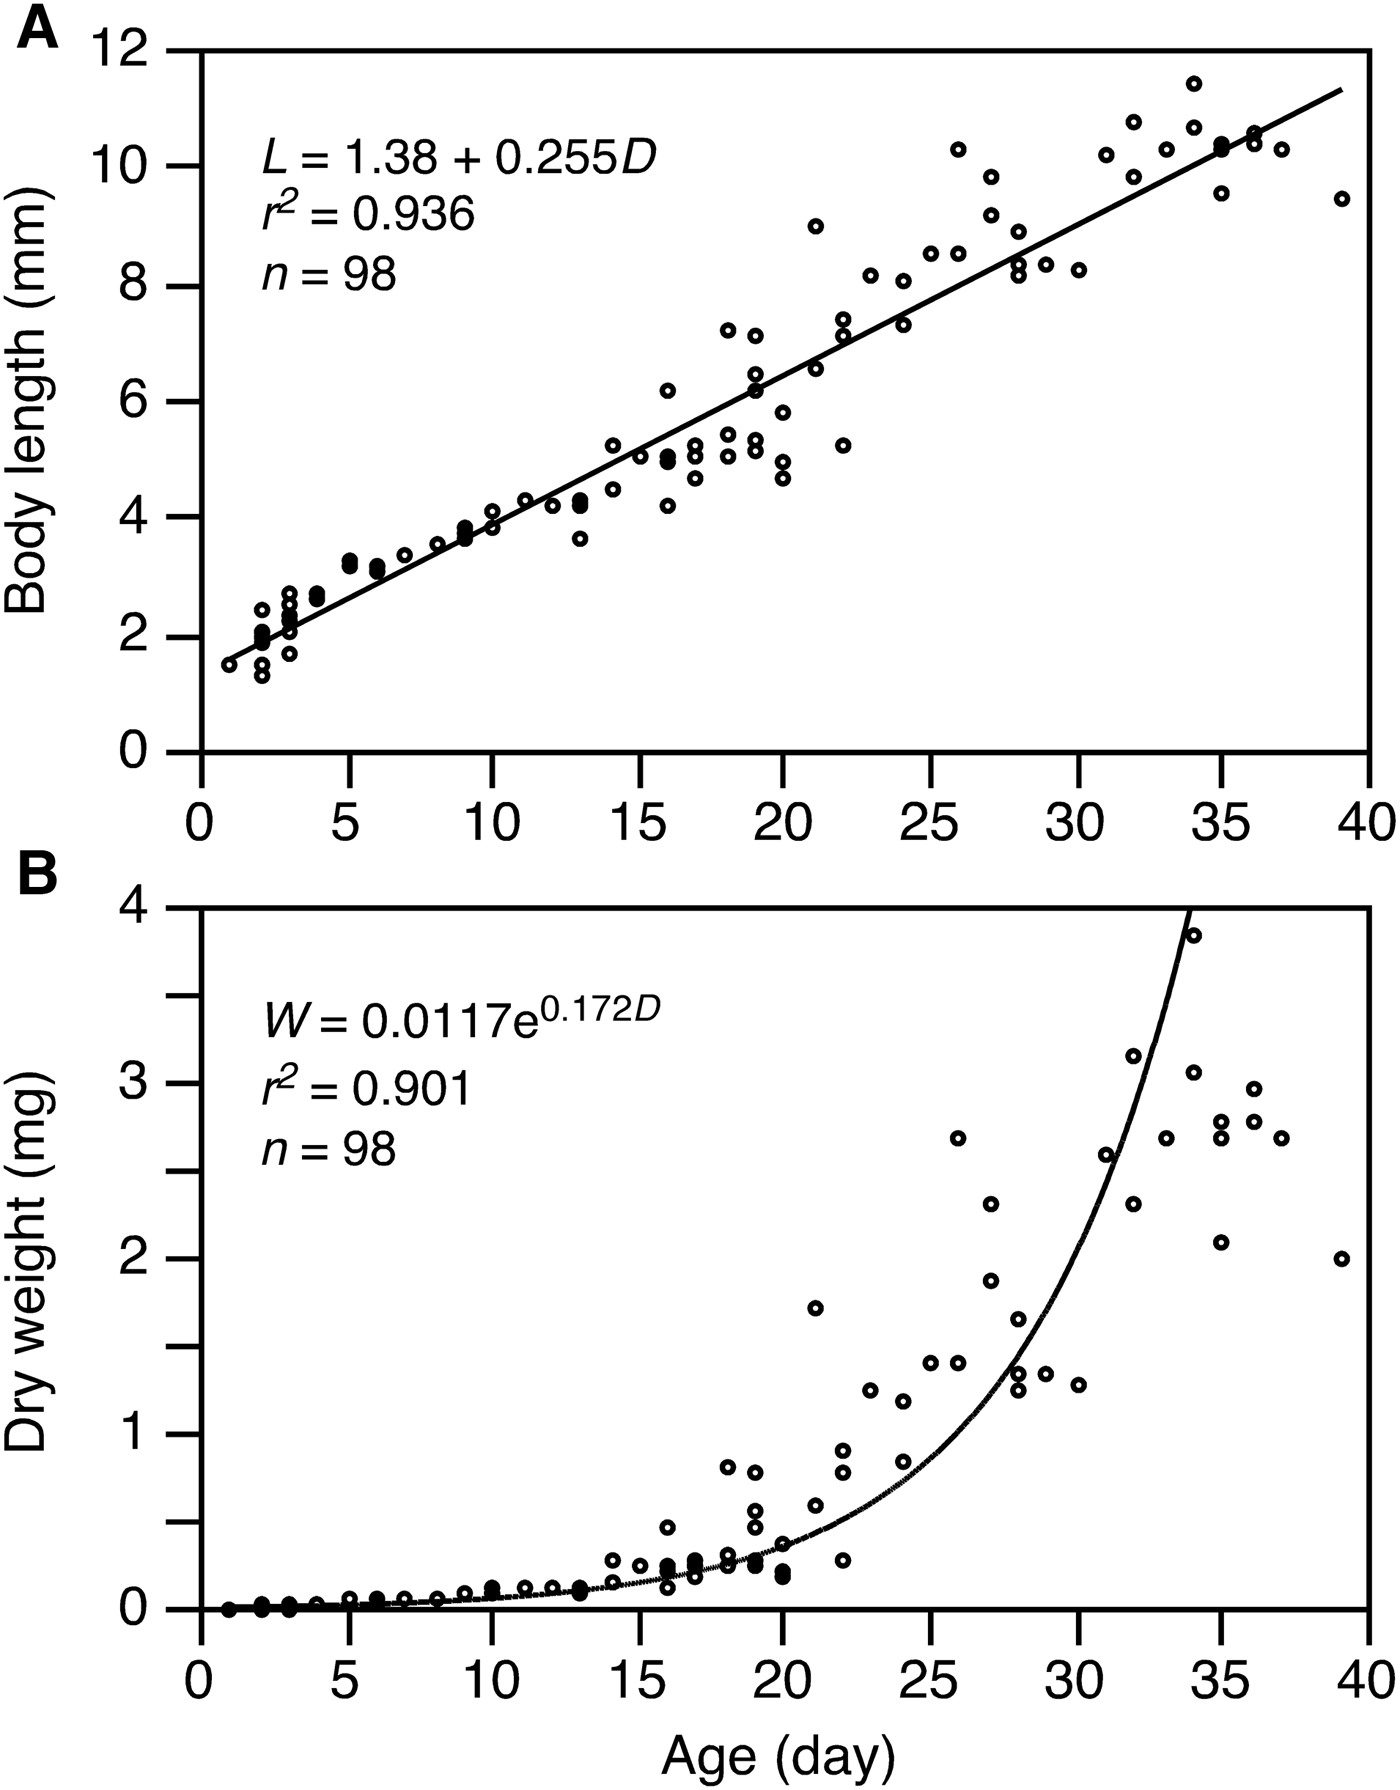
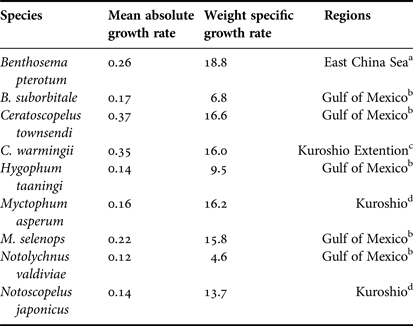
The relationship between otolith radius (R) and BL (L) of 98 B. pterotum larvae was L = 0.728R 0.492 (Figure 7). The linear model fitted the age and BL data better than the allometric and exponential model. The relationships between age (D) and BL was L = 1.380 + 0.255D (Figure 8A). Benthosema pterotum showed a constant growth rate of 0.26 mm d−1 during the larval stage. Since the smallest juvenile is about 12 mm BL, the larval stage duration was estimated to be 42 days. The weight-specific instantaneous growth coefficient (G w) was 0.172 d−1 (Figure 8B), and the weight-specific growth rate (K) was estimated to be 18.8% of dry body weight d−1 (Table 4).
Relationship between otolith radius (R) and body length (L) in Benthosema pterotum.

Relationship (A) between age (D) and body length (L) and (B) between age (D) and dry body weight (W) of Benthosema pterotum larvae in the shelf region of the East China Sea, based on daily increment counts of sagittal otoliths.

Summary of mean absolute growth rate (mm d−1) and weight specific growth rate (% of dry body weight d−1) of the subtropical–tropical myctophid species in the world oceans.
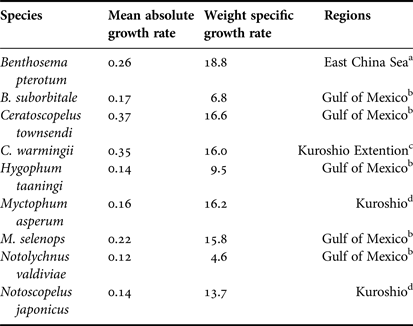
a, this study; b, Conley & Gartner (Reference Conley and Gartner2009); c, Takagi et al. (Reference Takagi, Yatsu, Moku and Sassa2006); d, C. Sassa (unpublished data). The weight specific growth rate of species in references b and c is estimated from age–body length (BL) relationship and dry weight–BL relationship by Conley & Gartner (Reference Conley and Gartner2009).
Mortality
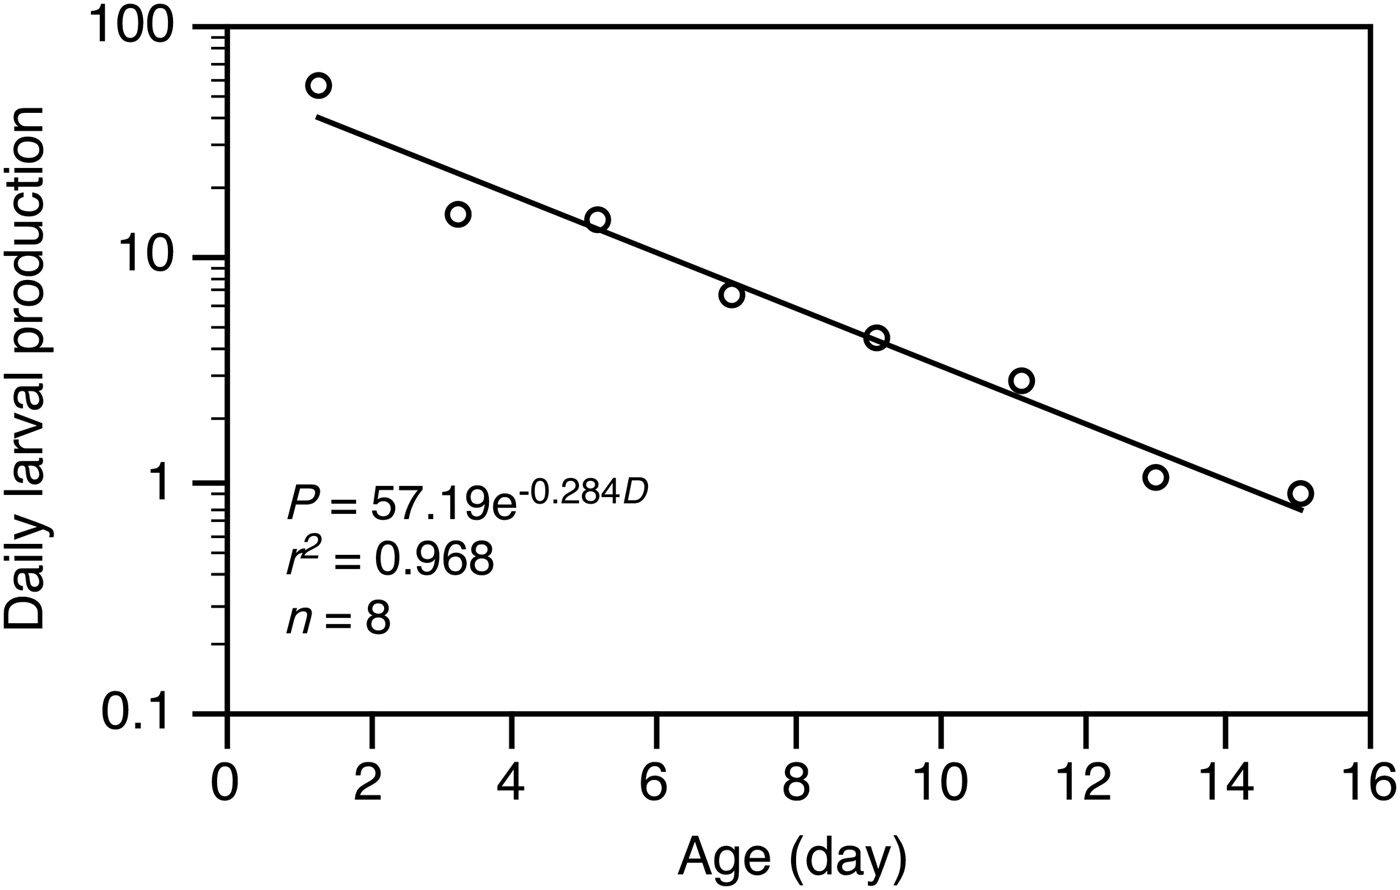
Before the calculation of the mortality, the abundance of B. pterotum larvae <2 mm BL was corrected by the size-dependent correction factor of 0.42 (Table 1). Since catches of the larvae by the Bongo net tows showed no significant difference during the diel periods, we used data from all stations. The decline in daily larval production (P) at age in days (D) was expressed by the exponential regression of P = 57.19e−0.284D (Figure 9). The daily instantaneous mortality coefficient (Z) was 0.28 d−1 during the first two weeks after hatching. This is equivalent to a 24.7% mortality d−1.
Relationship between age (D) and daily larval production (P) of Benthosema pterotum larvae in the shelf region of the East China Sea. An exponential model was fitted to the decline in the P to estimate the daily instantaneous mortality coefficients.

DISCUSSION
Net extrusion and avoidance
Net extrusion affects the results of larval mortality estimation because an unknown proportion of the population of small larvae is not sampled (Smith & Richardson, Reference Smith and Richardson1977). However, there is only limited information on net extrusion of myctophid larvae in the field (Hewitt et al., Reference Hewitt, Theilacker and Lo1985; Johnson & Morse, Reference Johnson and Morse1994). The only information on net extrusion of myctophid larvae available in the literature is for Ceratoscopelus maderensis, and the larvae of 3 and 4 mm BL are extruded through the 0.505 mm mesh net, with a retention ratio of 0.4 and 0.6, respectively (Johnson & Morse, Reference Johnson and Morse1994). In our study, B. pterotum larvae <2 mm BL were extruded through the 0.32 mm mesh net (retention ratio of 0.42), while all larvae ≥2 mm BL were collected. This was closely related to the body dimensions of the larvae. The body depth at the pectoral fin base of B. pterotum larvae of 2, 3, 4 and 5 mm BL was approximately 0.3, 0.5, 0.7 and 1.1 mm, respectively (Ozawa, Reference Ozawa1986; Sassa, unpublished data), thus a high percentage of the larvae <2 mm BL were extruded through the 0.32 mm mesh net. Similarly, the larvae <4 mm BL, the main component of Bongo net collected larvae, were rarely collected by the ORI net, since most of them would be extruded through the 1.0 mm mesh of ORI net.
In this study, most of the Bongo net collected larvae were at the preflexion stage of <4 mm BL, while most of the ORI net collected larvae were at the postflexion stage with a mode of 7.5–10.5 mm BL. In Bongo net samples there was no significant difference between day and night catchability of B. pterotum larvae. This would be mainly due to limited sensory perception of the net and avoidance reactions by the preflexion larvae. On the other hand, in ORI net samples, daytime catchability was much lower than that at night. This suggests that the postflexion larvae after complete formation of the caudal fin base have sufficient swimming ability to avoid our sampling gear (ORI net of 160 cm mouth diameter with the towing speeds of 1–1.25 m s−1) during daytime sampling.
When the BL distributions of the larvae collected by the Bongo and ORI net tows were combined there was a gap between 4 and 8 mm in the BL distribution of B. pterotum larvae during our study period. This gap is considered not to be due to the catchability of the mesh size for the following two reasons. Firstly, the BL distribution of the larvae collected by the Bongo net was bimodal, with modes of <4 and 8–10 mm BL, although the second mode was much lower. The second mode corresponded closely with the BL distribution of the ORI net samples. Secondly, based on the relationship between body depth of the larvae and mesh size, B. pterotum larvae <4 mm BL would pass through the 1.0 mm mesh of the ORI net, while the larvae >5 mm BL would be collected quantitatively. Therefore, the small number of larvae 5–8 mm BL in the ORI net samples was considered to be not caused by net extrusion. If a net with a smaller size mesh (e.g. 0.32 or 0.5 mm) was to be used in the ORI net towing, both the modes of the BL would occur in the samples.
Spatial distribution and maintenance mechanism of the larvae
In all seasons, dense distributions of adults of B. pterotum were mainly observed in the area south of Cheju Island (approximately 40–90 m depth) between 30° and 32°N and between 124° and 126°E (Sassa et al., Reference Sassa, Tsukamoto, Yamamoto and Tokimura2010). This is a markedly shallower depth than previous reports for adult B. pterotum and the other pseudoceanic myctophids (Sassa et al., Reference Sassa, Tsukamoto, Yamamoto and Tokimura2010; Dypvik & Kaartvedt, Reference Dypvik and Kaartvedt2013). The bottom sediments in this area are mainly composed of mud and are resuspended by the strong tidal current producing highly turbid waters. Because penetration of sunlight is greatly reduced, the dim light conditions in the benthopelagic layer enable the mesopelagic B. pterotum to live in such a shallow area (Sassa et al., Reference Sassa, Tsukamoto, Yamamoto and Tokimura2010). In this study, high abundances of B. pterotum larvae of <3 mm BL were observed in the area between 30° and 30°30′N and between 124°30′ and 126°E at the bottom depth between 60 and 80 m, based on the Bongo net towing. Since larvae of this size were less than one week after hatching, the distributional area represents the approximate location of the spawning ground. Larval distribution corresponded closely with the area of the adult habitat, although our study describes only the southern part of the entire larvae distribution. This close agreement between distribution patterns shows that B. pterotum reproduces in this area that is a markedly shallower area than previous reports for spawning grounds of myctophids (Gjøsæter & Kawaguchi, Reference Gjøsæter and Kawaguchi1980; Brodeur & Yamamura, Reference Brodeur and Yamamura2005).
Planktonic eggs of myctophids are collected infrequently, possibly because the thin chorion is broken during the tow and subsequently the embryo disintegrates and passes through the meshes (Moser & Ahlstrom, Reference Moser, Ahlstrom and Moser1996). Benthosema pterotum eggs were collected by vertical towing of a plankton net (0.35 mm mesh) in the Arabian Sea (Gjøsæter & Tilseth, Reference Gjøsæter and Tilseth1988), which is a rare case for myctophids. Egg diameter of B. pterotum is approximately 1.10 mm and the yolk is segmented with an oil droplet (Gjøsæter & Tilseth, Reference Gjøsæter and Tilseth1988). We tried to find B. pterotum eggs from our twin-NORPAC samples, but few eggs having the above characteristic occurred (C. Sassa, unpublished data). Since the hatching time of B. pterotum eggs is short (approximately 10 h) (Gjøsæter & Tilseth, Reference Gjøsæter and Tilseth1988) and occurrence of eggs would be much more restricted in both spatial and temporal scales compared to those of the larvae, it would be difficult to match the timing of samplings and the occurrence of eggs.
In the Arabian Sea where a huge biomass of B. pterotum is reported, habitat salinity of the larvae ranges from 35 to 37 psu (Röpke, Reference Röpke1993). On the other hand, on the ECS shelf, the habitat salinity of B. pterotum larvae was much lower than the value in the Arabian Sea, ranging from 33.5 to 33.9 psu (the WMS of 33.7 psu), which are the lowest values among the larvae of subtropical–tropical myctophid species previously reported (Badcock & Merrett, Reference Badcock and Merrett1976; Loeb, Reference Loeb1979; Sabatés & Masó, Reference Sabatés and Masó1990; Moser & Smith, Reference Moser and Smith1993b; Sassa et al., Reference Sassa, Moser and Kawaguchi2002, Reference Sassa, Kawaguchi, Hirota and Ishida2004; Conley & Gartner, Reference Conley and Gartner2009). In Sagami and Tosa bays, central Japan, the low salinity waters (33.5–34 psu) in the epipelagic layers due to the increase of river inflow in summer is considered to be unsuitable for mesopelagic fish larvae, possibly resulting in low egg and larval survival (Sassa & Kawaguchi, Reference Sassa and Kawaguchi2006; Sassa & Hirota, Reference Sassa and Hirota2013). Our results indicated that B. pterotum compared to other myctophid species is a more tolerant species to less saline conditions. Adaptation of low salinity waters during the larval stage would be one of the factors to enable B. pterotum to complete the life cycle in the study area.
In most mesopelagic fish species, the larvae were found in the mixed layer and at the top of the thermocline in the ocean (Ahlstrom, Reference Ahlstrom1959; Loeb, Reference Loeb1979; Sassa et al., Reference Sassa, Kawaguchi, Hirota and Ishida2004). In this study, B. pterotum larvae (mostly <4 mm BL) were distributed in the mixed layer of the upper 30 or 40 m depth, especially they tended to be concentrated in the lower part of the mixed layer. In the Arabian Sea where the mixed layer depth was shallower compared to our study area, B. pterotum larvae <4.4 mm BL occurred mainly from 35 to 55 m depth, just below the mixed layer in the upper pycnocline, during both day and night (Röpke, Reference Röpke1993). Larval habitat depth in the ECS was slightly shallower than that in the Arabian Sea, possibly relating to the difference in the depth and water properties of the spawning areas.
Generally, the larger-sized larvae gradually move into deeper waters compared to the habitat depth of the small-sized larvae in mesopelagic fish species, although vertical migration towards shallower layers during the daytime is also reported for the larger-sized larvae in some species (Loeb, Reference Loeb1979; Röpke, Reference Röpke1993; Watanabe et al., Reference Watanabe, Sassa and Ishida2010; Olivar et al., Reference Olivar, Sabatés, Alemany, Balbín, Fernández de Puelles and Torres2014). Although no clear relationship between mean BL and depth was observed, the largest larvae (>6 mm BL) occurred at the deepest layer at each station in this study. Should the distribution of the large larvae extend to the layer deeper than our MTD sampling layers, i.e. below the mixed layer, the WMT of the large larvae habitat would be lower and the WMS and WMC higher than the estimation of this study (Table 3). More discrete depth sampling for larger larvae with larger plankton nets is necessary to determine details of ontogenetic change in vertical distribution, since it might also be related to larval maintenance in the area of the adult habitat (e.g. Nakata et al., Reference Nakata, Fujihara, Suenaga, Nagasawa and Fujii2000; Bartsch & Coombs, Reference Bartsch and Coombs2004), due to different current velocities and directions between the upper and lower layers in the study area (Yanagi et al., Reference Yanagi, Shimizu and Matsuno1996).
Mesoscale hydrographic features would contribute to maintain B. pterotum larvae to recruit into the area of the adult habitat. A cyclonic eddy, 50–100 nautical miles across, is formed in the upper layer in the area south of Cheju Island with its centre at approximately 31°30′N 125°30′E (Yanagi et al., Reference Yanagi, Shimizu and Matsuno1996; Isobe, Reference Isobe2008), including the main distributional area of B. pterotum in the ECS (Sassa et al., Reference Sassa, Tsukamoto, Yamamoto and Tokimura2010). The eddy is expected to occur there during early spring to autumn (Yanagi et al., Reference Yanagi, Shimizu and Matsuno1996), also including the main spawning period of B. pterotum in the ECS (Sassa et al., Reference Sassa, Ohshimo, Tanaka and Tsukamoto2014a). Our study showed that B. pterotum larvae occurred in the pelagic layer for ~42 days. The eddy would entrain the B. pterotum larvae, keeping them within the cyclonic eddy area, enabling them to recruit into the area of adult habitat, thus forming a recruitment mechanism.
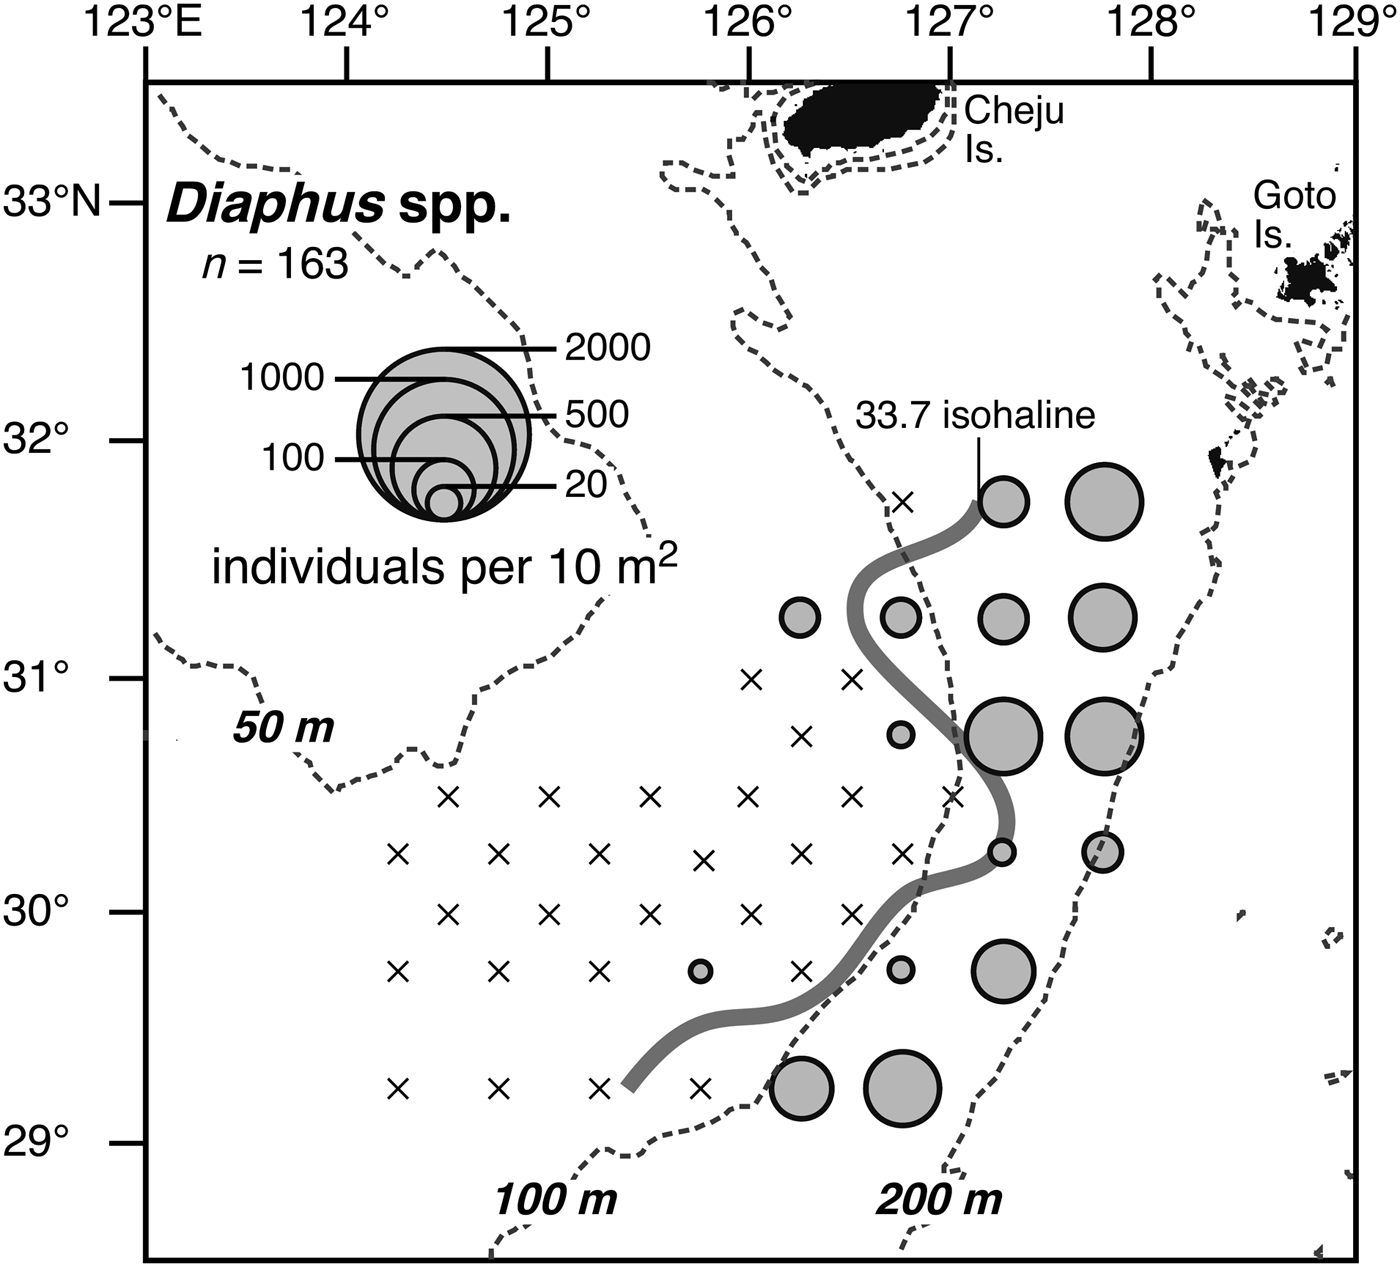
The salinity front at the shelf-break region of the ECS has a significant effect on the transport and distribution of fish eggs and larvae (Nakata, Reference Nakata1989; Okazaki & Nakata, Reference Okazaki and Nakata2007). In this study, occurrence of both small and large larvae of B. pterotum was restricted to the onshore side of the shelf-break salinity front. On the other hand, Diaphus spp. larvae, the second most abundant myctophid larvae in our samples, occurred in the offshore side of the salinity front (Figure 10). This clear difference in the distribution of the larvae of the two species that would have originated from different areas indicates that these two larval distributions are separated by this front. That is, this shelf-break salinity front acts as a barrier limiting the offshore extent of B. pterotum larvae and also contributes to the maintenance of the larvae within the shelf-break region. In the western Mediterranean, the existence of a salinity front along the shelf break is reported to be one of the most important factors to affect the distribution of the mesopelagic fish larvae (Sabatés & Masó, Reference Sabatés and Masó1990).
Horizontal distributions of Diaphus spp. larvae in the shelf region of the East China Sea, based on the Bongo net catch. Circles represent abundances (individuals 10 m−2) as a continuous range of values. Crosses indicate no catch. Grey line represents the 33.7 psu isohaline at 5 m depth. n, total number of larvae collected.

Hatch-dates
In this study, clear modes of hatch-date of B. pterotum were observed from mid to late September and from late August to early September when the temperature usually reaches the highest level of the year (Kondo, Reference Kondo1985; Sassa et al., Reference Sassa, Tsukamoto, Yamamoto and Tokimura2010). Based on monthly changes in the gonadosomatic index (GSI: gonadal weight/body weight × 100) of adult females, the main spawning season of B. pterotum is considered to be from August to September in this area, although a small percentage of mature females also occur during May to January (Sassa et al., Reference Sassa, Ohshimo, Tanaka and Tsukamoto2014a). The range of hatch-dates corresponded closely with the reported peak of GSI of adult females, i.e. August–September (Sassa et al., Reference Sassa, Ohshimo, Tanaka and Tsukamoto2014a). Our results suggested that large-scale spawning events occurred at least twice during the main spawning season.
In this study, mid to late September-hatched individuals coincided closely with the new moon period. Late August to early September-hatched individuals also roughly coincided with the new moon period, although they showed a small time lag between the peak occurrence and new moon period. This lag might be due to the underestimation of large-sized larvae >10 mm BL by the ORI net towing, resulting in the underestimation of mid August-hatched individuals. Our results suggested that B. pterotum might spawn periodically once a month around new moon. Synchronized spawning related to the lunar cycle has been observed in many teleosts including coastal, coral reef, fresh-water and deep-sea species (Thresher, Reference Thresher1984; Tsukamoto et al., Reference Tsukamoto, Otake, Mochioka, Lee, Fricke, Inagaki, Aoyama, Ishikawa, Kimura, Miller, Hasumoto, Oya and Suzuki2003; Wagner et al., Reference Wagner, Kemp, Mattheus and Priede2007; Takemura et al., Reference Takemura, Rahman and Park2010).
Generally, spawning during the new moon is considered to be an adaptation to synchronize spawning, resulting in efficient mating and fertilization. Since much lower GSI values of mature males than those of mature females have been reported for B. pterotum, as reported in some other myctophids (Young et al., Reference Young, Blaber and Rose1987; Gartner, Reference Gartner1993; Sassa et al., Reference Sassa, Ohshimo, Tanaka and Tsukamoto2014a), a mechanism related to efficient mating and fertilization is predicted (Sassa et al., Reference Sassa, Ohshimo, Tanaka and Tsukamoto2014a). Spawning during the new moon for B. pterotum would be one of the possible mechanisms for efficient mating. Myctophid adults are reported to occur 50–75 m deeper at full moon than at new moon, although species belonging to the genus Hygophum show a shallower nighttime distribution during full moon in subtropical–tropical oceans (Clarke, Reference Clarke1973; Linkowski, Reference Linkowski1996; Hayashi et al., Reference Hayashi, Kawaguchi, Watanabe and Ishida2001). This suggests that myctophid adults can detect the difference between full moon and new moon, although there is no information on the relationship between spawning behavior of adults and the lunar cycle. In the future, we need to conduct a similar analysis of hatch-date in other years and for other species of myctophids to clarify if spawning is related to the lunar cycle in this family or this relationship is unique to this shallow dwelling, pseudoceanic species.
Larval growth and mortality
In myctophids, the relationship between otolith radius and BL during the larval stage has been reported for only four species. An allometric equation was adopted for Diaphus theta during the larval and juvenile stages (Moku et al., Reference Moku, Ishimaru and Kawaguchi2001), while linear equations have been used for B. pterotum, Ceratoscopelus warmingii and Tarletonbeania crenularis (Ozawa & Peñaflor, Reference Ozawa and Peñaflor1990; Takagi et al., Reference Takagi, Yatsu, Moku and Sassa2006; Bystydzieńska et al., Reference Bystydzieńska, Phillips and Linkowski2010). Thus, it is possible that the otolith radius–BL relationship differs among species in myctophids. In this study, the otolith radius and BL relationship was described by allometric equations for B. pterotum larvae, based on specimens just after yolk-sac absorption to just before transformation to juveniles (1.3–11.4 mm BL). Although Ozawa & Peñaflor (Reference Ozawa and Peñaflor1990) indicated linear equations for B. pterotum larvae, their data set did not include specimens <2.5 mm BL of which otolith growth is much slower than the larger-sized larvae.
Although early growth is one of the most important factors determining early survival (Houde, Reference Houde1987), available information on larval growth of the subtropical–tropical myctophids is restricted to only eight species in the world oceans (Takagi et al., Reference Takagi, Yatsu, Moku and Sassa2006; Conley & Gartner, Reference Conley and Gartner2009; C Sassa, unpublished data) (Table 4). In this study, mean growth rate of B. pterotum larvae was 0.26 mm d−1 on the ECS shelf. In the congeneric B. suborbitale in the oligotrophic eastern Gulf of Mexico, the mean larval growth rate (0.17 mm d−1) (Conley & Gartner, Reference Conley and Gartner2009) is much slower than the rate of B. pterotum. Except for the genus Ceratoscopelus showing a growth rate of 0.35–0.37 mm d−1, the growth rate of myctophid larvae in the subtropical–tropical oceanic waters ranged from 0.12 to 0.22 mm d−1 (Table 4). The growth in length of B. pterotum larvae was faster compared to values of these species.
Myctophid larvae show high morphological diversity among species, and the variations in larval growth in length largely reflect the morphological characteristics of each species (Moser & Ahlstrom, Reference Moser, Ahlstrom and Moser1996; Conley & Gartner, Reference Conley and Gartner2009). Therefore, information on larval growth not only in length but also in weight is needed for conducting interspecific comparison of growth to discuss the early life history strategy of myctophid fish. In Table 4, we recalculated the weight-specific growth rate of the eight subtropical–tropical myctophids based on references of age–BL relationship and dry weight–BL relationship (Takagi et al., Reference Takagi, Yatsu, Moku and Sassa2006; Conley & Gartner, Reference Conley and Gartner2009; C Sassa, unpublished data). The growth in weight of B. pterotum larvae (18.8% of dry body weight d−1) was fastest among the myctophid species previously reported.
Higher growth of B. pterotum larvae would be related to higher food availability on the ECS shelf, compared to the subtropical–tropical oceanic waters. That is, distribution of B. pterotum larvae corresponded with the area of the high chlorophyll-a concentrations in this study. The concentration of chlorophyll-a is thought to control the abundance of prey organisms like copepod nauplii and copepodites that are considered to be the main prey of B. pterotum larvae (Röpke, Reference Röpke1993), since copepod egg production has generally been found to be correlated with the ambient chlorophyll-a concentration (Nakata et al., Reference Nakata, Nakano and Kikuchi1994; Prestidge et al., Reference Prestidge, Harris and Taylor1995). Therefore, food availability of B. pterotum larvae is expected to be favourable on the ECS shelf. In the Arabian Sea, the larvae occur in areas of high production (Gjøsæter & Tilseth, Reference Gjøsæter and Tilseth1988; Röpke, Reference Röpke1993), corresponding with the ECS. This is in contrast to most other myctophid larvae which occur in food-poor oceanic waters (Loeb, Reference Loeb1979; Sassa et al., Reference Sassa, Moser and Kawaguchi2002, Reference Sassa, Kawaguchi, Hirota and Ishida2004; Takagi et al., Reference Takagi, Yatsu, Moku and Sassa2006; Conley & Gartner, Reference Conley and Gartner2009).
In adult myctophids, annual mortality rates of Benthosema glaciale, Gymnoscopelus nicholsi, Lampanyctodes hectoris and Notoscopelus kroeyeri have been estimated to be 52–83, 36–50, 79 and 55% yr−1, respectively (Halliday, Reference Halliday1970; Gjøsæter, Reference Gjøsæter1973, Reference Gjøsæter1981; Linkowski, Reference Linkowski1985; Young et al., Reference Young, Bulman, Blaber and Wayte1988), although these values should be considered tentative, since they are based mainly on the age composition of samples collected by net sampling gears with considerable potential sampling bias related to fish size (Brodeur & Yamamura, Reference Brodeur and Yamamura2005). On the other hand, there is no information on larval mortality rates of myctophid fish (Gjøsæter & Kawaguchi, Reference Gjøsæter and Kawaguchi1980; Brodeur & Yamamura, Reference Brodeur and Yamamura2005), and this paper represents the first record of myctophid larval mortality from any ocean. Although the larval mortality is highly variable both temporally and spatially even within the same species (Watanabe et al., Reference Watanabe, Oozeki and Kitagawa1997; Sassa et al., Reference Sassa, Takahashi, Nishiuchi and Tsukamoto2014b), sampling bias of the larval fish is much smaller than that of the adults, and the larval mortality during the sampling period can be estimated realistically. In this study, the daily instantaneous mortality coefficient (Z) of B. pterotum larvae was estimated to be 0.28 d−1 (equivalent to 24.7% d−1 mortality rate) during the first two weeks after hatching. For epipelagic and demersal fish occurring on the shelf regions, mean Z during the larval stage has been estimated as 0.250 ± 0.029 (SE) d−1, based on information on 13 species (Houde & Zastrow, Reference Houde and Zastrow1993). The mortality of B. pterotum larvae showed a similar value to these shelf water species.
Generally, the early life stage is the most important period to affect the population dynamics of fish, so each myctophid species might develop a species-specific growth and survival strategy. Benthosema pterotum in the ECS shelf area is considered to show unique ecological characteristics for myctophids, since most other myctophid species occur in oceanic regions. However, due to the shallow distribution and therefore comparative ease of sampling, the data provided here can be considered as a reference point for future studies on this ecologically important but poorly understood group. In the future, information on larval growth and mortality of various species of oceanic myctophids is needed to try to understand the early life history strategy of this family in the ocean.
ACKNOWLEDGEMENTS
We are grateful to the captains, officers and crews of the RV ‘Yoko-Maru’ for their assistance in the field sampling. We also thank Ms N. Takahashi and Y. Kikitsu of Seikai National Fisheries Research Institute for helping with the measuring of the larval body length and the otolith reading.
FINANCIAL SUPPORT
This work was partially supported by grants from the Study of Kuroshio Ecosystem Dynamics for Sustainable Fisheries (SKED) programme of the MEXT (Ministry of Education, Culture, Sports, Science and Technology of Japan).