INTRODUCTION
Climate change has created a growing concern within the scientific community about how resultant environmental alterations will impact ecosystems. Paleontological evidence (for example Davis & Shaw Reference Davis and Shaw2001; Davies et al. Reference Davies, Purvis and Gittleman2009) and current observed trends (for example Parmesan Reference Parmesan2006; Thuiller Reference Thuiller2007; Thomas Reference Thomas2010) show that climate has the potential to influence species´ ranges. With the wide acceptance of global warming and rapid environmental change, the demand for accurate predictions of their effects has increased, especially in the field of conservation biology (Botkin et al. Reference Botkin, Saxe, Araújo, Betts, Bradshaw, Cedhagen, Chesson, Dawson, Etterson, Faith, Ferrier, Guisan, Hansen, Hilbert, Loehle, Margules, New, Sobel and Stockwell2007). In addition, climate change has become a central issue in worldwide conservation planning due to clear impacts of climate change on biodiversity (McCarty Reference McCarty2001; Olson & Lindsay Reference Olson and Lindsay2009).
Species distribution models (SDMs) have the capability to assess current distributions and simulate climate-induced range shifts under different global change scenarios at the single-species (Guisan & Thuiller Reference Guisan and Thuiller2005) and community (Ferrier & Guisan Reference Ferrier and Guisan2006) levels. Given that SDM outputs differ with different modelling techniques (Segurado & Araújo Reference Segurado and Araújo2004; Lawler et al. Reference Lawler, White, Neilson and Blaustein2006) and differences in climate change models and scenarios (Pearson & Dawson Reference Pearson and Dawson2003; Thuiller Reference Thuiller2004; Lawler et al. Reference Lawler, Shafer, White, Kareiva, Maurer, Blaustein and Bartlein2009), modellers are increasingly using ensemble (also known as consensus) modelling techniques that improve prediction accuracy over single models (Araújo & New Reference Araújo and New2006; Marmion et al. Reference Marmion, Parviainen, Luoto, Heikkinen and Thuiller2009). By combining different modelling techniques with different climate-change models, more robust predictions can be made with an appropriate interpretation of results (Araújo & New Reference Araújo and New2006; Buisson et al. Reference Buisson, Thuiller, Casajuss, Lek and Grenouillet2010). Although SDMs need to be used carefully and interpreted correctly, when an appropriate set of environmental predictor variables that account for natural and anthropogenic effects are used, SDMs are useful ecological tools for understanding how species distributions may respond to climate change (Pearson & Dawson Reference Pearson and Dawson2003; Lawler et al. Reference Lawler, White, Neilson and Blaustein2006). Such information is crucial in developing countries, where threats to natural landscapes are imminent and where monetary resources are limited for conservation planning.
The potential impact of climate change is of special concern in arid and semi-arid Patagonia, a >700 000 km2 region of steppe-like plains in Argentina. This arid landscape is irregularly interrupted by wetlands (Modenutti et al. Reference Modenutti, Balseiro, Diéguez and Queimaliños1998; Brinson & Malvárez Reference Brinson and Malvárez2002), covering approximately 5% of the total area (Iriondo Reference Iriondo1989). The most abundant wetlands are meadows and they occur along river valleys or hill sides, areas where superficial or underground water continually irrigates them (Mazzoni & Vázquez Reference Mazzoni and Vázquez2004). In Patagonia, a typical meadow is a wetland characterized by a central area of high moisture dominated by hydrophilic species, and a periphery dominated by mesic species that at the border becomes closer in vegetative composition to the surrounding steppes (Boelcke Reference Boelke1957). The structural diversity of meadows and the fact that they are three to five times more productive than the surrounding steppe (Irisarri et al. Reference Irisarri, Oesterheld, Paruelo and Texeira2012), make meadows important habitat for the biodiversity of this arid region (Ortega & Franklin Reference Ortega and Franklin1988; Mazzoni Reference Mazzoni, Mazzoni and García2000; Brinson & Malvárez Reference Brinson and Malvárez2002; Perotti et al. Reference Perotti, Diéguez and Jara2005; Puig et al. Reference Puig, Videla, Cona and Roig2008). However, meadows are under high anthropogenic pressures that cause degradation, mainly due to livestock overgrazing (Paruelo & Aguiar Reference Paruelo and Aguiar2003; Perotti et al. Reference Perotti, Diéguez and Jara2005). Furthermore, climate change may accelerate such degradation processes (Brinson & Malvárez Reference Brinson and Malvárez2002) owing to increases in temperature and changes in precipitation regimes.
In Patagonia, climate has historically greatly influenced the distribution of vegetation, mainly through precipitation patterns, and changes in climate during the next 50–100 years will likely impact vegetation distribution substantially. Relative abundance of grasses and shrubs is related to precipitation gradients (Bertiller et al. Reference Bertiller, Elissalde, Rostagno and Defosse1995; Jobbágy et al. Reference Jobbágy, Paruelo and León1996). It was recently suggested that precipitation and, to a lesser extent, temperature influence productivity of meadows (Buono et al. Reference Buono, Oesterheld, Nakamatsu and Paruelo2010; Irisarri et al. Reference Irisarri, Oesterheld, Paruelo and Texeira2012). The climate of Patagonia has already changed, exhibiting increased minimum and maximum temperatures (Rusticucci & Barrucand Reference Rusticucci and Barrucand2004) and reduced precipitation with a resultant decrease in river water flows (Fundación e Instituto Torcuato Di Tella 2006). Climate change predictions suggest that this trend will be accentuated, as southern Argentina might experience a mean temperature increase of 0.5–2.5 °C for the period 2081–2090 (Nuñez et al. Reference Nuñez, Solman and Cabré2009), and corresponding reductions in precipitation, especially on the Andes side of the country (Nuñez et al. Reference Nuñez, Solman and Cabré2009; Kitoh et al. Reference Kitoh, Kusunoki and Nakaegawa2011).
Protected areas shield biodiversity from the impact of human activities and mitigate potential climate-change effects (Botkin et al. Reference Botkin, Saxe, Araújo, Betts, Bradshaw, Cedhagen, Chesson, Dawson, Etterson, Faith, Ferrier, Guisan, Hansen, Hilbert, Loehle, Margules, New, Sobel and Stockwell2007). Protected areas are especially important in developing countries, where poverty increases the pressure to exploit natural resources and convert natural areas, such as wetlands, into agricultural use (Brinson & Malvárez Reference Brinson and Malvárez2002). In the Argentinean Patagonia, human pressure on meadows is high, mainly due to livestock production that results in severe degradation (Paruelo & Aguiar Reference Paruelo and Aguiar2003; Perotti et al. Reference Perotti, Diéguez and Jara2005). Under these threats, the current network of International Union for the Conservation of Nature (IUCN) category I, II and III reserves (see http://iucn.org/about/work/programmes/gpap_home/gpap_quality/gpap_pacategories/) is insufficient for conserving meadows in the medium to long term. Only a small portion of arid and semi-arid Patagonia is currently protected (Burkart et al. Reference Burkart, Carpinetti, Molinari, Carminati, Martín, Balabusic, Raffo, Machain, Almirón, Barreto, Ochoa, Melhem, Gazibe, Rodríguez, Monguillot, Somma, Moreno, de Ruiz, de Uribelarrea and Lunazzi2007) and an even smaller portion of meadows occurs inside such protected areas (Crego Reference Crego2012).
Crego (Reference Crego2012) assessed the current distribution of meadows in Patagonia, however no analysis of the potential effect of climate change on these meadows has been performed. Given that meadows are underrepresented within protected areas in Patagonia (Crego Reference Crego2012), information predicting how the distribution of meadows will respond to climate change is important to focus conservation efforts, design a system of natural reserves to protect threatened areas from human activities and target conservation activities to mitigate potential climate-change impacts. The objectives of this study were to (1) investigate how climate change may affect the current distribution of meadows in arid and semi-arid Patagonia by 2050, and (2) identify the main change trends and areas of desertification vulnerability using SDMs and climate-change models.
METHODS
Study area
Arid and semi-arid Patagonia (excluding the subantarctic andino-patagonic forest strip and the sea coast) covers an area of >700 000 km2 that extends from 39 ° to 55 °S and from the Atlantic Ocean to the Andean piedmont in the west. In the region, two major phytogeographic provinces can be distinguished: Patagonia, a mixture of grass-shrub steppes and semi-deserts in central and southern Patagonia, and the Monte, composed of shrub steppes in northern Patagonia (León et al. Reference León, Bran, Collantes, Paruelo and Soriano1998). The climate is cold-temperate. The mean annual temperature ranges from 12 °C in the north to 3 °C in the south, with absolute minimum temperatures below –20 °C (Paruelo et al. Reference Paruelo, Beltrán, Jobbágy, Sala and Golluscio1998). Annual precipitation presents a strong west-east gradient, with a mean annual precipitation for central Patagonia of 200 mm yr−1 (Paruelo et al. Reference Paruelo, Beltrán, Jobbágy, Sala and Golluscio1998).
Meadows presence/absence data
Between December 2011 and January 2012, we compiled a set of presence/absence data of meadows for the study area (Crego Reference Crego2012) by overlaying the region with a grid of 1-km2 cells and searching a sample of cells for meadows. We used an equal-stratified sampling design to randomly select cells for examination. We defined three strata for elevation (stratum 1: 0–400 m; stratum 2: 401–800 m; stratum 3: > 801 m) and two strata for distance from river (stratum 1: 0–2000 m; stratum 2: > 2001 m). From the entire grid, we randomly selected 167 cells per stratum (1002 cells in total) and examined each cell with high-spatial-resolution imagery (< 4 m) available on Google Earth 6.1 (Google, Inc. Mountain View, CA, USA). High-resolution imagery made it possible to differentiate meadows, which appeared as continuous patches of green coloration that differed from the grey and brown coloured surrounding steppe. We examined only cells with a clear high-resolution image and discarded cells covered by snow, clouds or low-quality image. We considered meadows as present if the cell was covered by ≥ 5% of meadow; otherwise, we considered that meadows were absent.
Climate data
We used the following seven climate variables to evaluate climate change impact on meadow distribution: maximum temperature of the warmest month, minimum temperature of the coldest month, mean temperature of wettest quarter, mean temperature of driest quarter, precipitation of the wettest month, precipitation of the driest month and precipitation seasonality. We selected precipitation and temperature variables because they represent important factors determining vegetation abundance and range in Patagonia (Bertiller et al. Reference Bertiller, Elissalde, Rostagno and Defosse1995; Jobbágy et al. Reference Jobbágy, Paruelo and León1996), as well as influencing productivity of meadows (Buono et al. Reference Buono, Oesterheld, Nakamatsu and Paruelo2010; Irisarri et al. Reference Irisarri, Oesterheld, Paruelo and Texeira2012). We preferred extreme variables rather than means because they better represented the ranges of conditions where species can occur (Zimmermann et al. Reference Zimmermann, Yoccoz, Edwards, Meier, Thuiller, Guisan, Schmatz and Pearman2009), hence climate change on those extremes will have more impact on meadow distribution. We simulated future meadow distributions using the same climate variables for the period 2040–2069 (referred to as 2050 hereafter), from four general circulation models (GCMs) derived from the Intergovernmental Panel on Climate Change's (IPCC) special report emission scenarios (SRES) (IPCC 2007). The GCMs were CGCM3.1(T47), MK3.0, HadCM3 and MIROC3.2(hires). We selected those four GCMs to capture existing variability among the different model predictions (Pearson & Dawson Reference Pearson and Dawson2003; Thuiller Reference Thuiller2004; Lawler et al. Reference Lawler, Shafer, White, Kareiva, Maurer, Blaustein and Bartlein2009), and because those models have been used in other climate-change studies in South America (Marini et al. Reference Marini, Barbet-Massin, Martinez, Prestes and Jiguet2010; Kitoh et al. Reference Kitoh, Kusunoki and Nakaegawa2011). We used the A2 SRES scenario, which assumes that global carbon emissions will continue unconstrained given an economy still dependent on fossil-fuel consumption (Nakicenovic et al. Reference Nakicenovic and Swart2000). Furthermore, this scenario is preferable because the current actual trajectory of emissions (1990 to present) corresponds to a high emission scenario (Nakicenovic et al. Reference Nakicenovic and Swart2000), and it is unlikely that such emission rates will change in the near future. Current and future climate data were obtained from the WorldClim database, at a 30 arc-seconds resolution (1 × 1 km; Hijmans et al. Reference Hijmans, Cameron, Parra, Jones and Jarvis2005; available at: http://www.worldclim.org/download). Future climate-data resolution was statistically downscaled from original coarse resolution (100–300 km) data by the delta method (Ramirez-Villegas & Jarvis Reference Ramirez-Villegas and Jarvis2010). It is important to notice that climate models for Patagonia have overestimated precipitation, likely due to an insufficient observation network (Kitoh et al. Reference Kitoh, Kusunoki and Nakaegawa2011). This potential error would make our predictions conservative (thus the actual impacts are likely to be larger that we predict) given the importance of precipitation for meadows.
We chose this relatively fine-scale resolution for modelling because meadows are rare in the landscape and relatively small cell sizes are needed to predict their presence or absence. In addition, climate change that occurs in small areas may have high impact on species locations, and fine-resolution grids are necessary to account for this in ecological models (Zhang Reference Zhang2005). When SDMs are used in conservation planning under future climate scenarios, high-resolution data sets are also needed to account for change in small regions (Kremen et al. Reference Kremen, Cameron, Moilanen, Phillips, Thomas, Beentje, Dransfield, Fisher, Glaw, Good, Harper, Hijmans, Lees, Louis, Nussbaum, Raxworthy, Razafimpahanana, Schatz, Vences and Vieites2008), and we calculated that in arid and semi-arid Patagonia 67% of recognized IUCN I-II-III level protected areas are < 150 km2 in area. This creates a problem when modelling future climate scenarios, because GCMs are often created with coarse resolutions (100 or 200 km), and downscaling such resolution incorporates uncertainties (Ramirez-Villegas & Jarvis Reference Ramirez-Villegas and Jarvis2010). However, given our goal of a broad-scale assessment of climate change impacts on meadows, and given the impossibility of using larger cell sizes for presence/absence data, we decided to use downscaled-climate models, and considered these limitations acceptable.
Environmental data
In addition to the climate variables described above, we included several ‘static’ variables in our modelling process (variables that we assumed will not change in the future, such as topography). Including static variables in SDMs when assessing climate-change effects on species distributions may improve model outputs (Stanton et al. Reference Stanton, Pearson, Horning, Ersts and Reşit Akçakaya2012). Stanton et al. (Reference Stanton, Pearson, Horning, Ersts and Reşit Akçakaya2012) suggested excluding static variables highly correlated with climate variables, but that have indirect effects on the species distribution, such as altitude. However, Stanton et al. (Reference Stanton, Pearson, Horning, Ersts and Reşit Akçakaya2012) suggested including static variables that interact with climate, such as soil, even under the unrealistic assumption that such variables will not change with time. Consequently, and because of the importance of river and soil characteristics to the presence of meadows (Mazzoni & Vázquez Reference Mazzoni and Vázquez2004), we included the variable distance to permanent rivers, which we calculated using river shapefiles provided by the Argentinean Geographic National Institute (C. Chehébar, personal communication 2011). In addition, we used a soil cover layer created by the National Institute of Agricultural Technology (INTA, Argentina), selecting soil order classification as the predictor variable (available at http://geointa.inta.gov.ar/). Finally, we included a human influence index (HII) variable to account for land-use changes driven by human activities (such as degradation by livestock farming or wetland drainage for agricultural purposes) in areas suitable for meadows. This layer was produced by the Wildlife Conservation Society (WCS) and the Center for International Earth Science Information Network (CIESIN). The HII was calculated from nine global data layers considering population density, human land use and infrastructure (built-up areas, night time lights, land use and land cover) and human access (coastlines, roads, railroads and navigable rivers) for the year 2000 (available at http://sedac.ciesin.columbia.edu/). Each layer was reprojected to UTM Zone 19 South. We used ArcGIS 9.3 (ESRI, Redlands, California, USA) for most geospatial operations.
Modelling procedure
To investigate potential climate-change effects on the distribution of areas that contain meadows, we used SDM techniques under the platform BIOMOD (Thuiller et al. Reference Thuiller, Lafourcade, Engler and Araújo2009), which works in the R programming language (version: 2.14.0; R Development Core Team, 2011). We used four modelling techniques that were shown to perform better than other modelling techniques (Segurado & Araújo Reference Segurado and Araújo2004; Araújo et al. Reference Araújo, Pearson, Thuiller and Erhard2005; Elith et al. Reference Elith, Graham, Anderson, Dudik, Ferrier, Guisan, Hijmans, Huettmann, Leathwick, Lehmann, Li, Lohmann, Loiselle, Manion, Moritz, Nakamura, Nakazawa, Overton, Peterson and Phillips2006; Cutler et al. Reference Cutler, Edwards, Beard, Cutler, Hess, Gibson and Lawler2007; Marmion et al. Reference Marmion, Parviainen, Luoto, Heikkinen and Thuiller2009) and performed well when modelling the current distribution of meadows (Crego Reference Crego2012). We used generalized linear models (GLM), generalized additive models (GAM), general boosting models (GBM) and random forest (RF) as the basis of a final mean ensemble method (Araújo & New Reference Araújo and New2006; Marmion et al. Reference Marmion, Parviainen, Luoto, Heikkinen and Thuiller2009). We ran GLMs and GAMs with a binomial variance and logistic link function. We fitted GLMs using linear, quadratic and polynomial terms (second and third order) and GAMs using cubic-smooth splines with a degree of smoothness of ≤ 4 degrees of freedom for each variable. In both methods, we used a stepwise procedure to select the most parsimonious models using Akaike's information criterion (AIC; Akaike Reference Akaike1973). We ran GBMs using a maximum of 5000 trees and five lambda fold-cross-validation to progressively grow models. We ran RF with 500 trees.
Model evaluation
We divided the dataset into two groups to train and validate models (70% training, 30% validation; Fielding & Bell Reference Fielding and Bell1997). To ensure robust estimations and assess the sensitivity of the models to initial conditions, we used a cross-validation procedure, running 10 iterations per model, each time with a different random split of the data for training and validation (Thuiller Reference Thuiller2009). We used the area under the curve (AUC) of the receiver-operating characteristic (ROC) plot to assess model accuracy (Fielding & Bell Reference Fielding and Bell1997). The AUC score varies between 0.5 (model predicted not better than random) and 1 (model predicted perfect). We interpreted AUC accuracy values following Swets (Reference Swets1988) as: excellent AUC > 0.9, good 0.9 > AUC > 0.8, fair 0.8 > AUC > 0.7, poor 0.7 > AUC > 0.6, and fail 0.6 > AUC > 0.5. Because AUC has been criticized as an accuracy assessment (see Lobo et al. Reference Lobo, Jiménez-Valverde and Real2008), when AUC values were > 0.7, we also estimated sensitivity (percentage of presence predicted correctly) and specificity (percentage of absence predicted correctly) using the whole data set (Crego Reference Crego2012). To transform probability values into a presence/absence format, we used the threshold that maximized the percentage of presence and absence cells correctly predicted for ROC curves.
Ensemble forecasting
To build the final model for current distribution of meadows, we used a mean ensemble approach, where the output model was calculated as the mean value of the outputs of all single runs (Marmion et al. Reference Marmion, Parviainen, Luoto, Heikkinen and Thuiller2009). To estimate the current meadow distribution of the entire study area and predict the future distribution under each GCM, we used each model trained to project the 40 individual models (10 using each technique) to the entire study area. Afterward, we calculated the mean ensemble model as the mean presence-probability value among the 40 individual models created. We then transformed the final ensemble model in a binary presence/absence format using a threshold calculated as the mean value of the threshold values obtained for the individual models. Overall, we produced one ensemble model projection for the year 2012 and four ensemble models for each of the four GCMs. We then combined those four models from the GCMs into a final mean ensemble model for the year 2050. To project future meadow distributions, we assumed that the plant species that compose meadows would be able to disperse into any new geographic range. Given that these species are highly dependent on water availability and soil composition (Mazzoni & Vázquez Reference Mazzoni and Vázquez2004), this is an acceptable assumption when forecasting changes in meadow range. These species will not be able to establish in new ranges without a permanent source of water provided by soil conditions and proximity to rivers.
To investigate the source of variation of the different predictions used in the ensemble forecast, we calculated uncertainty maps. We computed the standard deviation per cell within each global circulation model using the 40 single predictions coming from the 40 training models (the four techniques and 10 iterations). We also computed the standard deviation among the predictions for the four GCMs.
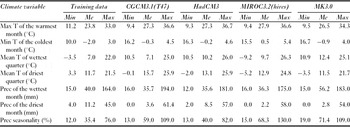
Predicting future distribution of species can be problematic when future climatic variables fall outside the range under which the model was trained. This is because the observed distribution does not provide information about how species might respond to this novel and non-analogue conditions, thus, such forecasting has been considered by several authors as ecologically and statistically invalid (Fitzpatrick & Hargrove Reference Fitzpatrick and Hargrove2009). In our study, all future variables had some values outside the training-value range (Table 1). To indicate non-analogue climatic areas (Fitzpatrick & Hargrove Reference Fitzpatrick and Hargrove2009), we created a map showing the total number of variables (seven variables × four GCMs) per cell that fell outside the training-value range. With this map, we attempted to caution readers about areas where predictions may be invalid due to the amount of non-analogue climatic conditions implicated compared with the training values.
Minimum (Min), mean (Me), and maximum (Max) values of the climate variables (T = temperature, Prec = precipitation) used for modelling current (2012) and future (2050) meadow distribution in arid and semi-arid Patagonia. Values correspond to variables used for model training (2012) and for four general circulation models (2050) (CGCM3.1(T47), HadCM3, MIROC3.2(hires), and MK3.0; see IPCC 2007).

Vulnerability analysis
We analysed changes in meadow distribution by contrasting the final ensemble model of current meadow distribution (2012) versus the final mean ensemble model for year 2050. In addition, to investigate shifts in meadow distribution, we first overlaid a grid over the study area with a cell size of 50 × 50 km. We used a large-cell resolution to obtain a broad-scale assessment and to account for potential error in the final model given the high resolution of the climate change models. We calculated meadow abundance given the percentage of 1-km2 cells with meadows present within each 50 × 50-km cell. We then compared the change of meadow abundance per cell and defined five categories: (1) areas without meadows: cells where < 10% of meadows were present, both currently and in the future; (2) areas with little or no change: cells with a ≤10% increase or decrease in meadow abundance; (3) areas with expansions: cells where there was a > 10% increase in meadow abundance; (4) areas with reductions: cells where there was a 10–50% decrease in meadow abundance; and (5) areas of severe reductions: cells with > 50% reduction in meadow abundance.
We used a layer of Patagonian protected areas provided by the National Park Administration, Argentina (C. Chehébar, personal communication 2012) to describe the viability of meadows currently under protection under climate change effects. On the basis of conservation goals and management strategies used to reach such conservation goals, the IUCN recognizes six reserve levels. Because only reserves included in IUCN levels I, II or III ensure strict and effective protection to the landscape (Burkart et al. Reference Burkart, Carpinetti, Molinari, Carminati, Martín, Balabusic, Raffo, Machain, Almirón, Barreto, Ochoa, Melhem, Gazibe, Rodríguez, Monguillot, Somma, Moreno, de Ruiz, de Uribelarrea and Lunazzi2007), we considered only those protected areas (national parks, provincial parks, province natural monuments, natural reserves and natural and cultural reserves) in our analysis.
RESULTS
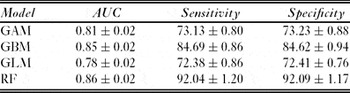
Overall, across all modelling techniques, observations of meadows using Google Earth corresponded well with predictions for the current distribution of suitable areas for meadows, however GBM and RF models performed consistently better than GLM and GAM models (Table 2). Based on AUC values, RF, GBM and GAM model performance was good on average and that of GLM models fair. Based on sensitivity and specificity values, RF performed better, followed by GBM, GAM and GLM models (Table 2). All runs were consistent, indicating low sensitivity to training datasets. The final current ensemble model improved accuracy considerably over single models (AUC = 0.95) measured on the total calibration dataset. This model also exhibited high sensitivity (93%) and specificity (82%) values measured on the calibration dataset. The four ensemble models of the GCMs demonstrated a similar pattern in meadow distribution. The uncertainty maps showed that the variation among different model techniques was higher than the variation among the four different GCMs (Appendix 1, Fig. S1, see supplementary material at Journals.cambridge.org/ENC). This indicates less consensus among modelling techniques than among the different GCMs, in terms of predicting the probability of meadow presence. The variation among GCMs was higher in the southern region of the study area.
Area under the curve (AUC), sensitivity and specificity mean (±SD) values for four modelling techniques with ten repetitions for each, used for calculating a mean ensemble model projection of current (2012) and future (2050) meadow distribution in arid and semi-arid Patagonia. AUC was calculated on 30% validation data (which differed from the 70% used for model training), while sensitivity and specificity were calculated for the whole data set (training + validation). GAM = general additive model; GBM = general boosting model; GLM = general linear model; RF = random forest; sensitivity = percentage of presence correctly predicted; specificity = percentage of absence correctly predicted.

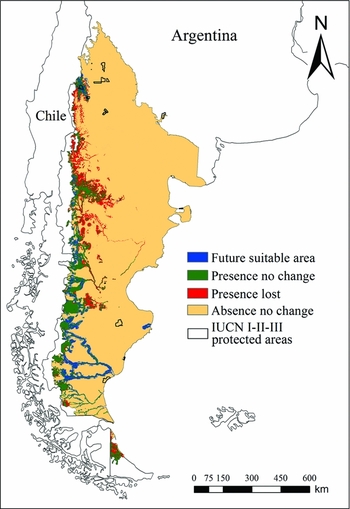
The final ensemble model for 2012 predicted that 11.43% of all 1-km2 cells were covered by ≥5% of meadows in arid and semi-arid Patagonia. Meadows were clustered along the western portion of the region and followed major river systems, especially in the south. The same general pattern was observed in the predicted distribution for 2050 under the A2 SRES scenario. Overall, based on the GCMs ensemble map (Fig. 1), there was a 7.85% reduction (from 90 633 cells in 2012 to 83 519 cells in 2050) in areas suitable for meadows by the year 2050. However two different major trends were observed: meadows contracted in central and northern Patagonia, while southern regions became more suitable for meadows (Fig. 1). A predicted reduction of 38.56% (34 950 cells) occurred largely in the north-central region and on Tierra del Fuego Island. In contrast, a predicted meadow expansion of 30.71% (27 836 cells) occurred in the south of Patagonia and in a small portion of north-western Patagonia. In general, areas where future climate conditions were non-analogue to the conditions used to train the models corresponded to regions where meadows are currently absent, such as north-east Patagonia, however precautions should be taken when interpreting predicted reductions in areas suitable for meadows in the east-central region of the study area (Appendix 1, Fig. S2, see supplementary material at Journals.cambridge.org/ENC).
Predicted distribution map for current (2012) and future (2050) areas suitable for meadows and IUCN level I, II and III protected areas in arid and semi-arid Patagonia. This map shows the distribution of cells (1-km2) that by the year 2050 were predicted to: maintain a cover ≥5% of meadows (green); maintain a cover < 5% of meadows (orange); lose cover ≥5% of meadows (red); or increase cover ≥5% of meadows (blue).

Of the 14 IUCN I-II-III category protected areas that constitute the effective reserve network of arid and semi-arid Patagonia, and based on the broad vulnerability analysis, 10 (71.4%) are located in areas where meadows were not predicted to be present, either currently or in 2050 (Fig. 2). Of the other four reserves, Domuyo and El Tromen Provincial Parks are located in areas where meadows will not be affected by climate change. Laguna Blanca National Park and the Natural Provincial Monument Cañada Molina may provide ineffective meadow protection, as they are located where areas suitable for meadows are predicted to decrease (Fig. 2).
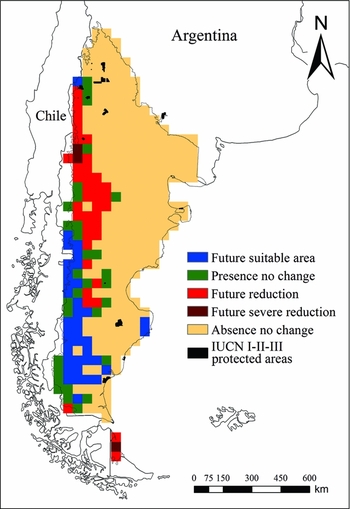
Map of vulnerability to climate change for meadow abundance in arid and semi-arid Patagonia on the basis of predictions of distribution change by the year 2050. This map shows: cells where < 10% of meadows were present, both currently and in the future (orange); cells with a ≤10% increase or decrease in meadow abundance (green); cells where there was a >10% increase in meadow abundance (blue); cells where there was a 10–50% decrease in meadow abundance (red); and cells with >50% reduction in meadow abundance (dark red). Abundance was calculated as the percentage of 1-km2 cells with meadows predicted to be present within a 50 × 50 km cell.

DISCUSSION
Climate change may have an important impact on the distribution of meadows in arid and semi-arid Patagonia. We determined overall that areas suitable for meadows are likely to decrease by the middle of the century, given current climate predictions. However, we found two contrasting trends: severe reductions in meadow areas in north-west Patagonia and Tierra del Fuego Island, and an expansion of areas suitable for meadows in the south and a small portion of the north-west (Fig. 1). The mean ensemble technique enabled us to obtain an accurate representation of the current distribution of meadows in arid and semi-arid Patagonia. By averaging projections produced by four different regression and machine-learning techniques, the robustness of model predictions increased and model accuracy was considerably improved (Araújo & New Reference Araújo and New2006; Buisson et al. Reference Buisson, Thuiller, Casajuss, Lek and Grenouillet2010). In addition, the ensemble projection of the four different GCMs produced a broad forecast pattern of meadow distribution for the year 2050 (Fig. 2). Such spatial and forecasting information on meadow vulnerability to climate change will be important for future conservation planning projects (Thuiller Reference Thuiller2007).
We primarily used climate predictor variables to model the distribution of meadows in Patagonia and investigate the potential impacts of climate change. However, we also included three static predictor variables (soil, distance to permanent rivers and HII), as the inclusion of static variables in SDMs to investigate climate-change effects was shown to improve model performance (Stanon et al. Reference Stanton, Pearson, Horning, Ersts and Reşit Akçakaya2011). In our study, the exclusion of an important predictor variable, such as the normalized difference vegetation index (NDVI), resulted in a reduction in the ability of models to accurately predict the current distribution, as compared to findings reported by Crego (Reference Crego2012). However, while NDVI measured during the growing season is useful for predicting the current distribution of meadows in places where ground observation data do not exist, we chose to exclude NDVI in our predictions of future meadow distribution. Although high NDVI values are a useful characteristic to ‘indicate’ meadow presence on satellite imagery and model their current distribution, we do not think NDVI should be considered a ‘causal’ variable that contributes to their presence. Thus, because NDVI is not likely to be a factor ‘causing’ presence of meadows in the future, we did not use it for future prediction. To include NDVI in future predictions would be highly unrealistic and would likely affect the interpretation of future meadow distribution.
Our predictions indicate that areas suitable for meadows in arid and semi-arid Patagonia will decline and shift mainly toward the south; this observation agrees with the predicted reduction in annual precipitation. While the surface air temperature is predicted to increase more or less constantly throughout the entire region (Nuñez et al. Reference Nuñez, Solman and Cabré2009), significant decreases in annual precipitation are predicted to occur in north-west Patagonia (Nuñez et al. Reference Nuñez, Solman and Cabré2009), especially during the summer (the growing season), that may lead to the reduction of meadows in the area. Water plays a key role in formation, persistence and productivity of meadows (Mazzoni & Vázquez Reference Mazzoni and Vázquez2004; Buono et al. Reference Buono, Oesterheld, Nakamatsu and Paruelo2010; Irisarri et al. Reference Irisarri, Oesterheld, Paruelo and Texeira2012), therefore reductions in the amount of water that percolates into river flows and the groundwater system will diminish the area suitable for meadows. In Tierra del Fuego, together with decreased annual precipitation, the surface air temperature is predicted to increase more than in the rest of Patagonia (Nuñez et al. Reference Nuñez, Solman and Cabré2009); these factors will not only reduce the amount of water available in the system, but also increase the amount of evapotranspiration, and taken together may explain the strong projected reduction of areas suitable for meadows in that region. Conversely, southern regions will become more suitable for meadows. The combination of predicted increases in surface air temperature together with no change in annual or seasonal precipitation (Nuñez et al. Reference Nuñez, Solman and Cabré2009) may create better conditions for the establishment of new meadows, similar to those currently found in northern areas. The increase in temperature will increase the length of the growing season, which together with the amount of water received by the meadows, may benefit meadow productivity (Buono et al. Reference Buono, Oesterheld, Nakamatsu and Paruelo2010; Irisarri et al. Reference Irisarri, Oesterheld, Paruelo and Texeira2012). A small portion of northern Patagonia may also experience an increase in the area suitable for meadows. This increase in suitable areas could be a response to increased precipitation on the Chilean side of the Andes (Nuñez et al. Reference Nuñez, Solman and Cabré2009).
Although precipitation changes may be important drivers of future changes in meadow distribution, there are two other important sources of water in Patagonia that contribute to the formation and maintenance of meadows: deep percolation from steppes and high mountain snowmelt (Irisarri et al. Reference Irisarri, Oesterheld, Paruelo and Texeira2012). We were not able to include variables to represent percolation and snowmelt, as they were not available for our study area, but we suggest modellers consider them, when available, to improve the accuracy of climate change predictions. Future field research is needed to test some of the hypotheses derived from our study to gain better understanding of how meadows will respond to climate change.
Climate change may impact the distribution of meadows in arid and semi-arid Patagonia, probably reducing the current low level of meadow protection, as two of the four IUCN I-II-III reserves are predicted to be located in areas unsuitable for long-term meadow persistence. An increase in the area under protection and improved management of the current network of IUCN I-II-III reserves is necessary to protect biodiversity in general (Burkart et al. Reference Burkart, Carpinetti, Molinari, Carminati, Martín, Balabusic, Raffo, Machain, Almirón, Barreto, Ochoa, Melhem, Gazibe, Rodríguez, Monguillot, Somma, Moreno, de Ruiz, de Uribelarrea and Lunazzi2007) and meadows in particular (Crego Reference Crego2012). Despite the inherent uncertainty that limits the use of SDMs (Thuiller Reference Thuiller2004), our models provide important spatial and forecasting information to incorporate in conservation planning and conservation decisions (Thuiller Reference Thuiller2007; Groves et al. Reference Groves, Game, Anderson, Cross, Enquist, Ferdaña, Girvetz, Gondor, Hall, Higgins, Marshall, Popper, Schill and Shafer2012). In addition, we implemented an ensemble approach to reduce the amount of uncertainty coming from different GCMs and, with that, the likelihood of making incorrect conservation decisions (Araújo & New Reference Araújo and New2006). We also highlighted those areas where future climate conditions will be non-analogue to the conditions in which the models were trained. Our approach to spatially representing the uncertainty in our projections has some limitations, because it does not account for how far values in future predictor layers are from values used to train models, given that that uncertainty probably increases as the predicted value is further from the training values. Nevertheless, our map showing areas that have non-analogue conditions should guide potential users of the model to correctly interpret maps and make conservation decisions that account for uncertainty in climate-change predictions (Fitzpatrick & Hargrove Reference Fitzpatrick and Hargrove2009).
Conservation planning is an effective tool to develop or improve existing reserve networks (Margules & Pressey Reference Margules and Pressey2000). However, in practice, protected areas are often created opportunistically, without any specific biodiversity objectives (Margules & Pressey Reference Margules and Pressey2000). Moreover, opportunistic procedures of reserve design may be more costly than the use of systematic procedures based on model information (Pressey & Cowling Reference Pressey and Cowling2001). To avoid this bias in future land protection, a new multi-agency project is currently attempting to use systematic methodologies of conservation planning to prioritize and, ultimately, create new reserves on the arid side of Patagonia (Chehébar et al. Reference Chehébar, Novaro, Iglesias, Walker, Funes, Tammone and Didier2012). We recommend that such future conservation-planning efforts consider both current and potential future distribution of meadows at the time of prioritizing and selecting new areas for conservation. The information we provide on current meadow distribution and potential impacts of climate change is particularly valuable for conservation planning efforts given the significance of meadows for providing habitat for several species (Ortega & Franklin Reference Ortega and Franklin1988; Mazzoni Reference Mazzoni, Mazzoni and García2000; Brinson & Malvárez Reference Brinson and Malvárez2002; Perotti et al. Reference Perotti, Diéguez and Jara2005; Puig et al. Reference Puig, Videla, Cona and Roig2008). Protection of meadows will help, and in some cases may be necessary, to maintain these species in Patagonia.
Given the potential reduction in the extent of meadows in northern regions of Patagonia, conservation efforts should first favour establishing conservation and management actions in areas (a) where meadows will likely be resilient to climate change and (b) that are threatened by processes, such as livestock overgrazing (Paruelo & Aguiar Reference Paruelo and Aguiar2003; Perotti et al. Reference Perotti, Diéguez and Jara2005), that management actions could feasibly prevent or mitigate. For example, with the goal of protecting meadows, central and southern Patagonia appears to contain important areas to prioritize for the creation of new reserves, which currently do not exist. These areas would likely not be affected or even favoured by climate change, and management plans could prevent livestock degradation. However, regions where meadows are more vulnerable to degradation by climate change, such as north-west Patagonia (where current reserves are located) and Tierra del Fuego Island, represent a risky investment for conservation, at least in terms of prioritizing areas for meadow conservation, and should receive relatively less investment. In these areas, it may be a better investment to perform management actions on existing lands rather that spending a large amount of resources or political capital trying to increase the amount of formal protected areas. The best goal of such management action may be to reduce the constant pressure to convert these wetlands into agricultural areas (Brinson & Malvárez Reference Brinson and Malvárez2002), effectively reducing or delaying the likely future degradation that will be caused by climate-change.
CONCLUSION
Besides providing a general report on climate change for Argentina (see Fundación e Instituto Torcuato Di Tella 2006), our study is, to our knowledge, the first research that assesses the potential climate change impacts on any biological element of Patagonia. In general, there is limited information available on climate change effects on species for the Southern Hemisphere (IPCC 2007). Therefore, future studies should investigate such climate impacts on other Patagonian species and include this information in conservation planning projects, which together will help to guide more efficient investment of limited existing resources. Based on our predicted changes in the distribution of areas suitable for meadows and the low representation of meadows in current reserves, we emphasize the need to expand and improve implementation of the conservation network in arid and semi-arid Patagonia as a key step in ensuring the long-term protection of meadows and associated biodiversity.
ACKNOWLEDGEMENTS
We thank the Cooperative Wildlife Research Laboratory, Department of Forestry, Graduate School, and College of Agricultural Sciences at Southern Illinois University Carbondale; and the Wildlife Conservation Society for funding and logistical support. We are grateful to Claudio Chehébar and Mauro Tammone, from the Argentinean National Park Administration and Gustavo Iglesias from The Nature Conservancy for providing important datasets. Lastly, we thank two anonymous reviewers and associate editor who provided valuable comments that improved our manuscript.