INTRODUCTION
Reactive nitrogen (Nr) is an essential element for plants and animals as a key component of proteins, but excess Nr threatens the quality of air, soil and water (Sutton et al. Reference Sutton, Oenema, Erisman, Leip, van Grinsven and Winiwarter2011a , Reference Sutton, Billen, Bleeker, Erisman, Grennfelt, Van Grinsven, Grizzetti, Howard, Leip, Sutton, Howard, Erisman, Billen, Bleeker, Grennfelt, van Grinsven and Grizzetti b ). Currently, about half of the nitrogen (N) added to farm fields in Europe ends up as pollution to air and water, or as molecular nitrogen (N2) (Sutton et al. Reference Sutton, Billen, Bleeker, Erisman, Grennfelt, Van Grinsven, Grizzetti, Howard, Leip, Sutton, Howard, Erisman, Billen, Bleeker, Grennfelt, van Grinsven and Grizzetti2011b ). The main Nr types are ammonia (NH3), nitrous oxide (N2O) and nitrogen oxides (NOx) emissions to the air and leaching and runoff of nitrate (NO3 −) and other N compounds to ground and surface water. Over the last century both the use and emissions of Nr in the European Union (EU) have increased markedly (Erisman et al. Reference Erisman, Sutton, Galloway, Klimont and Winiwarter2008). This is due mainly to increased use of mineral fertilizer in Europe, in combination with the parallel increase of livestock production and associated import of soybean meal. A large share of the Nr losses in the EU is related to livestock production (Leip et al. Reference Leip, Achermann, Billen, Bleeker, Bouwman, de Vries, Dragosits, Döring, Fernall, Geupel, Herolstab, Johnes, Le Gall, Monni, Nevečeřal, Orlandini, Prud'homme, Reuter, Simpson, Seufert, Spranger, Sutton, van Aardenne, Voß, Winiwarter, Sutton, Howard, Erisman, Billen, Bleeker, Grennfelt, van Grinsven and Grizzetti2011a , Reference Leip, Britz, Weiss and de Vries b ; Sutton et al. Reference Sutton, Billen, Bleeker, Erisman, Grennfelt, Van Grinsven, Grizzetti, Howard, Leip, Sutton, Howard, Erisman, Billen, Bleeker, Grennfelt, van Grinsven and Grizzetti2011b ). However, the exact distribution of losses between the different food commodity groups has not been properly quantified. Quantification of this distribution would allow determining the effect of substitution between food products, for example a shift from livestock products to cereals and pulses. Insight into the distribution of N losses over the main food products could help to set research and policy priorities. Moreover, information on specific N footprints has also been shown to be an important communication tool for individuals’ diet choices (Leach et al. Reference Leach, Galloway, Bleeker, Erisman, Kohn and Kitzes2012).
The objective of the current paper was to determine (i) the N footprint of 12 main food categories for member countries of the European Union, and (ii) the distribution of the total Nr losses over these 12 food categories. Uncertainty was estimated by comparing the outputs from two models, CAPRI and MITERRA. Both models already have been used to calculate greenhouse gas emissions related to food production in Europe (Lesschen et al. Reference Lesschen, van den Berg, Westhoek, Witzke and Oenema2011; Weiss & Leip Reference Weiss and Leip2012).
For practical reasons, including the availability of data and suitable models, the current study was confined to food production systems of the EU27, but taking into account the effects of N losses for feed production outside its territory. Livestock production and consumption in the EU are tightly linked and EU livestock production is largely for European consumption with relatively little trade across the EU's border (Westhoek et al. Reference Westhoek, Rood, van den Berg, Janse, Nijdam, Reudink and Stehfest2011).
METHODOLOGY
Products considered
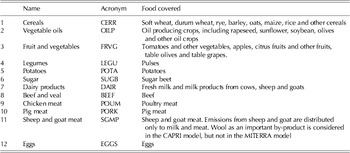
Twelve agricultural food categories were considered, divided into six categories of vegetable products and six of livestock products (Table 1). These food categories cover virtually all livestock production in Europe, except fish and seafood products, which are not simulated in CAPRI or MITERRA. Also most vegetable food products in the EU27 were considered, excluding production of wine and hops for beer, as well as non-food crop production, such as fibre crops. Overall, the analysis covered 0·97 of EU27 food crop production.
Food categories considered and corresponding crops or products

Nitrogen indicators
Nitrogen budgets for agriculture in the EU27
A full N budget was calculated for agriculture according to Leip et al. (Reference Leip, Britz, Weiss and de Vries2011b , Reference Leip, Weiss, Britz and Flichman c ). An N-budget for agriculture represents all major N-flows in the major agricultural sub-pools: livestock production systems, manure management systems, soil cultivation systems, and their links to other pools, in particular human society (consumption, trade) and environment (UNECE 2013; Eurostat 2013).
N footprint
The N footprint (Φ) was used as an indicator of the total direct N-losses to the environment that occur for the production of one unit of (food) product, measured in g N/kg food product. In accordance with Leach et al. (Reference Leach, Galloway, Bleeker, Erisman, Kohn and Kitzes2012) the N footprint was calculated as total N emission intensity for one unit of product. Nitrogen emissions were calculated based on a soil N-budget approach for vegetable food products, or an ‘extended soil budget’ approach for livestock products, referred to in the following as a Nitrogen Footprint Budget (NBΦ). In contrast to the farm N-budget (NBF) (Leip et al. Reference Leip, Britz, Weiss and de Vries2011b ), NBΦ uses feed imports to the ‘farm’ as throughput flow and ‘replaces’ it in the calculation with the specific soil N-budget of the feed product.
As such, the N footprint budget NBΦ was based on a partial life-cycle assessment (LCA), however, without considering other Nr losses such as NOx emissions from energy use or N2O emissions from land use change, which are considered in a full cradle-to-gate LCA. The quantification of the N footprint in the current paper did not include wastage that might occur during further processing, retail or preparation of the food products, which are considered in the N footprint of Leach et al. (Reference Leach, Galloway, Bleeker, Erisman, Kohn and Kitzes2012). Thus, a ‘farm-gate’ Nitrogen Footprint ΦG was quantified, in contrast to the ‘farm-to-fork’ Nitrogen Footprint ΦF as estimated by Leach et al. (Reference Leach, Galloway, Bleeker, Erisman, Kohn and Kitzes2012).
As product units, the biomass of the product at farm gate
 $m_{\,product}^G $
was used to calculate φG
[kg N/kg product].
 $$\phi ^G = \displaystyle{{N_{in}^S - N_{out}^G} \over {m_{\,product}^G}} $$
where
 $N_{in}^S $
is the sum of the input N flows according the definition of a soil N budget and
 $N_{out}^G $
is the sum of the useful outputs generated.
Input flows were the application of fertilizers, biological N fixation and atmospheric deposition. Fertilizers included both mineral and organic fertilizers, considering only external inputs and discounting throughput flows from both input and output sides (e.g. manure). The main useful output was the product for which the N footprint was being calculated (see earlier), but ‘waste’ streams N waste that are recycled and used as input for other processes were included as well. These flows include N accumulating in the soil – soil stock changes (ssc) – that are available for future crop growth (for a discussion of accounting of soil stock changes see Leip et al. Reference Leip, Britz, Weiss and de Vries2011b ), crop residues (cr) used to fertilize other fields or used as feed, manure (man) used to fertilize other fields and ‘pre-gate’ food processing wastes (waste) recycled in a food processing chain or used in the production of other durable goods. The latter concerned mainly slaughter house wastes (which were considered to be within the ‘farm gate’ boundaries), modelled here as the difference between animal live weight and animal carcass. The recycled N-flows were expressed as a fraction of the total waste flows that were recycled as given in Eqn (2).
 $$N_{out}^G = N_{\,product}^G + N_{rec}^G = N_{\,product}^G + \mathop \sum \limits_{{ {x = ssc,cr,} \atop {man,waste} \cr}} \{ f_{x,rec} \; \times N_{x,waste\;} \} $$
For the current study, the fractions f
x,rec
of recycled N streams were set to zero for surplus-manure, since – even if applied to another crop – it is not necessarily needed in a situation of general over-supply of N for European agriculture. Crop residues are beneficial for soil fertility (McIntyre et al. Reference McIntyre, Herren, Wakhungu and Watsn2009) and were therefore considered completely as useful output with a f
cr,rec
of one. A shift of crop residues between crop activities occurs mainly through the application of solid manure (bedding material) and following crop rotation. Also for increases in soil N stocks f
ssc,rec
=1 was assumed. In CAPRI and MITERRA, soil stock changes were not quantified but may result in the case of
 $N_{out}^S \gt N_{in}^S $
, in which case soil depletion occurs.
Nitrogen investment factor
In addition, a dimensionless Nitrogen investment factor was calculated at the farm gate (NIFG ) which measures the total (external) N required to produce one unit of product in terms of N contained. Thus, in contrast to the N footprint which is expressed per unit biomass of product, the N investment factor is expressed per unit N of product, facilitating the comparison of different products. Also, in contrast to the N footprint, the N investment factor is an index for total N use, including both N losses and N recovered in the product.
 $$NIF^G = \displaystyle{{N_{in}^S - N_{rec}^G} \over {N_{\,product}^G}} = \phi ^G \times \left( {\displaystyle{{N_{\,product}^G} \over {m_{\,product}^G}}} \right)^{ - 1} + 1$$
The N investment factor for sugar and oils (which do not have significant quantities of N) were calculated based on the N:biomass ratio in the primary crop (thus sugar beet and oilseeds). The N contained in sugar beet and oilseeds ends up in by-products as molasses and oilseed meals, which are usually used as feed.
Models
Calculations were carried out with the CAPRI and MITERRA models. The reference year was 2004, which was the available base year of CAPRI. All statistical input data were based on 3-year averages of the period 2003–2005. Data from EU25 are presented, covering all the countries of EU27 apart from Malta and Cyprus, for which the quality of data was insufficient. The N footprint and the N investment factor were estimated for the supply of food products, whereby a weighted average is calculated between regional domestic production and imported products.
CAPRI
The CAPRI model (Britz & Witzke Reference Britz and Witzke2012) is an agricultural policy impact assessment tool focusing on the European Union. Apart from the simulation model, the CAPRI system includes a complete and consistent modelling database, combining information from official and harmonized data sources such as EUROSTAT, FAOSTAT and OECD. For the EU27, the database has a spatial resolution of 225 regions. Data gaps are closed and data inconsistencies are removed by changing affected data according to their estimated uncertainty. The resulting database is complete and consistent with respect to agricultural crop and livestock production activities as well as the required inputs (farm inputs, costs) and outputs (production, return etc.) and can be used for the quantification of a series of agri-environmental indicators, among others all relevant N flows in the agricultural sector of EU countries.
Livestock feed was calculated in a feed distribution tool of CAPRI using feed data aggregates from market balances on a country level, regional fodder availability and animal requirements. Sources of N to soils are atmospheric deposition, biological N-fixation, and returns from agricultural production systems (crop residues, manure, soil N stock changes) as described in Leip et al. (Reference Leip, Britz, Weiss and de Vries2011b ). Briefly, N-deposition was from the European-scale EMEP MSC-W Chemical transport model (Simpson et al. Reference Simpson, Fagerli, Jonson, Tsyro, Wind and Tuovinen2003, Reference Simpson, Aas, Bartnicki, Berge, Bleeker, Cuvelier, Dentener, Dore, Erisman, Fagerli, Flechard, Hertel, van Jaarsveld, Jenkin, Schaap, Shamsudheen Semeena, Thunis, Vautard, Vieno, Sutton, Howard, Erisman, Billen, Bleeker, van Grinsven, Grennfelt and Grizzetti2011). N-fixation was based on fixed coefficients for pulses and grass, taking into consideration the share of clover in grasslands according to data from the Farm Structure Survey. National mineral fertilizer data were from the International Fertilizer Association (IFA; www.fertilizer.org/ifa/ifadata/search) and the European Fertiliser Manufacturers Organization (EFMA). Manure excretion was calculated with an animal budget accounting for N in feed, N in products and N-retention. Fertilizer was distributed to crops according to crop needs and N availability in N-sources and factors on manure and crop residues availability, minimum share of N obtained from mineral sources and ‘luxury’ factors accounting for expected N losses and farmer's ‘security margin’ (Britz & Witzke Reference Britz and Witzke2012).
An LCA approach, implemented in CAPRI for greenhouse gas accounting (Leip et al. Reference Leip, Weiss, Wassenaar, Perez-Dominguez, Fellmann, Loudjani, Tubiello, Grandgirard, Monni and Biala2010; Weiss & Leip Reference Weiss and Leip2012), was adapted slightly for calculation of the N footprint. The following feed and forage categories were included in CAPRI: feed cereals, protein rich feeds (e.g. soybean meal), energy rich feeds (e.g. cassava meal, sugar beet molasses), maize and grass forages from arable land and grass from permanent grassland, straw, feed arising from dairy products (e.g. whey, milk) and by-product feed (e.g. citrus pulp). Nitrogen-flows from feed cultivation were allocated to livestock products in three steps. First, for some processed feedstuffs (such as soybean cake and soybean oils, etc.), flows were allocated from primary product to the feedstuff based on mass weight. Then all the N-flows from feed were allocated to the animals ingesting the feed according to the ratios estimated in the feed distribution tool. As part of the feed is imported from countries outside the EU, for which a full soil N-budget cannot be calculated, EU-averages were used as a default for imported crop products and feed concentrates. Finally, N-flows from animals were allocated to animal products using the outputs per animal production activity and the N contents of the animal products.
MITERRA
MITERRA-Europe is an environmental impact assessment model, which calculates emissions of N and greenhouse gases on a deterministic and annual basis using emission and leaching factors (Velthof et al. Reference Velthof, Oudendag, Witzke, Asman, Klimont and Oenema2009; Lesschen et al. Reference Lesschen, van den Berg, Westhoek, Witzke and Oenema2011). The model was developed to assess effects and interactions of policies and measures in agriculture on N losses at a regional level (NUTS2) in the EU27 (Velthof et al. Reference Velthof, Oudendag, Witzke, Asman, Klimont and Oenema2009). MITERRA-Europe is partly based on the models CAPRI (Britz & Witzke Reference Britz and Witzke2012) and GAINS (Klimont & Brink Reference Klimont and Brink2004), supplemented with an N leaching module, a soil carbon module and a mitigation module for greenhouse gas and NH3 emissions and NO3 leaching measures. Input data consists of activity data (e.g. livestock numbers, crop areas), spatial environmental data (e.g. soil and climate data) and emission factors (IPCC and GAINS).
The main input data for MITERRA-Europe were crop areas, animal numbers and feed use at the regional level. Crop areas and feed use were taken directly from CAPRI (see earlier section on CAPRI). The N content of each feed type was assumed to be the same among EU countries. Country-specific N contents were used only for grass (Velthof et al. Reference Velthof, Oudendag, Witzke, Asman, Klimont and Oenema2009). Animal numbers were from GAINS at a national level, and distributed over the NUTS2 regions according to CAPRI livestock data. Data on primary animal and crop production and annual N fertilizer consumption were collected from FAOSTAT at national level. Since animals are not always slaughtered in the same country where they are raised, corrections were made for the export and import of live animals as described in Lesschen et al. (Reference Lesschen, van den Berg, Westhoek, Witzke and Oenema2011).
For the calculation of N input and N emissions in terms of animal products, the feed consumption was allocated to crop areas as described in Lesschen et al. (Reference Lesschen, van den Berg, Westhoek, Witzke and Oenema2011). For soybean, which is the main feed product from outside the EU, representative N inputs and N emissions from Brazil were used, based on Smaling et al. (Reference Smaling, Roscoe, Lesschen, Bouwman and Comunello2008).
Country-specific N excretion rates of livestock were obtained from the GAINS model (Klimont & Brink Reference Klimont and Brink2004). The total manure N production was calculated at the NUTS2 level using the number of animals and the N excretion per animal, then corrected for N losses in housing and storage. Manure was distributed over arable crops and grassland according to Velthof et al. (Reference Velthof, Oudendag, Witzke, Asman, Klimont and Oenema2009), taking into account the maximum manure application of 170 kg N/ha, or higher in the case of a derogation from the Nitrates Directive. Mineral N fertilizer was distributed over crops relative to their N demand, taking account of the amount of applied manure and grazing manure and their respective fertilizer equivalents. The N demand was calculated as the total N content of the crop (harvested part plus crop residue), multiplied by a crop-specific uptake factor, set at 1·0 for grass and 1·1 and 1·25 for cereals and other arable crops respectively (Velthof et al. Reference Velthof, Oudendag, Witzke, Asman, Klimont and Oenema2009). Further N inputs include biological N fixation, which was estimated as a function of land use and crop type (legumes), and N deposition that was derived at NUTS2 level from the European-scale EMEP MSC-W Chemical transport model (Simpson et al. Reference Simpson, Aas, Bartnicki, Berge, Bleeker, Cuvelier, Dentener, Dore, Erisman, Fagerli, Flechard, Hertel, van Jaarsveld, Jenkin, Schaap, Shamsudheen Semeena, Thunis, Vautard, Vieno, Sutton, Howard, Erisman, Billen, Bleeker, van Grinsven, Grennfelt and Grizzetti2011).
Nitrogen flows
Nitrogen (NH3, N2O, N2, NOx, N-leaching and runoff) emissions were calculated following a mass-flow approach in both CAPRI and MITERRA models, based on the MITERRA-Europe model (Velthof et al. Reference Velthof, Oudendag, Witzke, Asman, Klimont and Oenema2009). It represents the N cycle in agricultural systems (de Vries et al. Reference De Vries, Leip, Reinds, Kros, Lesschen and Bouwman2011; Leip et al. Reference Leip, Britz, Weiss and de Vries2011b , Reference Leip, Weiss, Britz and Flichman c ). Any N-emissions occurring in earlier stages, such as during the storage of manure, were subtracted from the N pool before calculating emissions at a later stage, such as following the application of manure.
Emissions of NH3 from livestock manure take place during housing and manure storage, after application to the soil, and from grazed land. Country-specific emission factors and estimates of the efficiency of ammonia abatement measures were taken from the GAINS model (Klimont & Brink Reference Klimont and Brink2004). Emissions of N2O from agriculture consist of emissions from manure management, soil emissions from the application of mineral fertilizer and animal manure, crop residues, grazing, and indirect emissions from N lost due to leaching and runoff, and from volatilized and re-deposited N. All N2O emissions were calculated using emission factors from the IPCC (Reference Eggleston, Buendia, Miwa, Ngara and Tanabe2006) guidelines. The emission factor for NOx was derived from Skiba et al. (Reference Skiba, Fowler and Smith1997) and was set at 0·3% of the N input. In MITERRA, N leaching was calculated by multiplying the soil N surplus by a region-specific leaching fraction, based on soil texture, land use, precipitation surplus, soil organic carbon content, temperature and rooting depth. Surface runoff fractions were calculated based on slope, land use, precipitation surplus, soil texture and soil depth (Velthof et al. Reference Velthof, Oudendag, Witzke, Asman, Klimont and Oenema2009).
In CAPRI, leaching rates including surface runoff were taken from IPCC (Reference Eggleston, Buendia, Miwa, Ngara and Tanabe2006) but related to the N soil surplus instead of N application. Therefore, leaching is restricted to the level of the N soil surplus corrected by a minimum denitrification rate, which is assumed to be 2·5 times the N2O emissions. The share of agricultural land affected by leaching is derived via the land where access supply of water (rainfall in rainy season minus potential evapotranspiration) is larger than the water holding capacity of the soils, not taking into account irrigation. Data sources applied are 5×5 maps on long-term average of monthly rainfall (Hijmans et al. Reference Hijmans, Cameron, Parra, Jones and Jarvis2005), long-term average of monthly potential evapo-transpiration (PET) of the reference land use ‘grassland’ (R. Hiederer, 2010, personal communication, based on data from Hijmans et al. Reference Hijmans, Cameron, Parra, Jones and Jarvis2005) and soil water holding capacity provided along with the ISRIC-WISE soil properties data set (Batjes Reference Batjes2006).
RESULTS
A N-budget for European agriculture
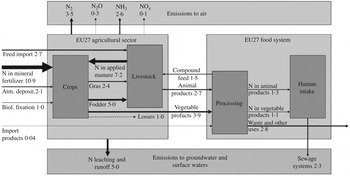
The flow of N through agricultural pools and the food sector of the EU27 (Fig. 1) shows the close link between livestock and crop production systems through the exchange of feed and manure with emissions of N compounds to the environment from both sub-systems. According to the data used in the current paper, in 2004 c. 15 metric tons of N (Mt N, or Tg N) were taken up annually by biomass on agricultural land and used as livestock feed, food, fibre or fuel. This was driven by a supply of N to agricultural land of 21·2 Mt N/year, mainly in the form of mineral fertilizers (10·9 Mt N/year) and the input of manure N (7·2 Mt N/year). The main net N inputs into the EU agricultural sector were mineral fertilizer, N in feed imports (2·7 Mt), biological fixation (1·0 Mt) and a part of the atmospheric deposition (2·1 Mt). Another part of this deposition originated from NH3 losses from the agricultural sector and thus was not a net input. At the same time, only c. 7·0 Mt N/year was extracted from agricultural production for other societal use. Finally, only 2·3 Mt N/year was consumed by European citizens, while more than 10 Mt N/year was emitted from agricultural systems to the atmosphere or hydrosphere in Europe. Supply of food for human consumption at the farm gate accounted for 4·2 Mt N/year, embedded in 409 Mt of products, hence with an average N-content of c. 10 g N/kg product.
Nitrogen flows (Mt N/year) in the agricultural sector of EU27. Reference year: 2004.

N footprint of food categories at country basis
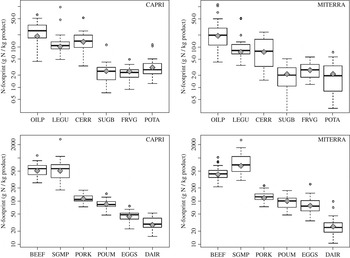
Data on the N footprint(φG ) for the 12 food commodity groups are given in Fig. 2, showing information on the distribution of N footprints for EU25 countries as well as a EU25 N footprint calculated as weighted average from country data. There was a clear distinction between livestock products, which were generally above 20 g N/kg product, and vegetable products which had an N footprint below 20 g N/kg product, even though oilseeds, in particular, had an N footprint up to c. 70 g N/kg product for some countries estimated by CAPRI, or even more than 100 g N/kg product in the MITERRA dataset. On average, N footprints from livestock products were about one order of magnitude higher than vegetable food products, with a larger difference if the product groups were weighted by their share in human consumption than if by production quantities.
Nitrogen footprint for the 12 main food commodity groups (g N/kg product). Left: CAPRI; right: MITERRA. The box-whisker diagram shows the median and lower and upper quartiles (boxes) and the minimum and maximum of the sample (whiskers) excluding outliers. Outliers (more than 1·5 times the quartiles) are shown as circles. The values for EU25, calculated as weighted average, are shown as diamonds. Note the logarithmic scale of the y-axis.

Vegetable products that have high protein contents such as oilseeds, pulses and cereals also had a distinctly higher N footprint than the protein-poor products like sugar beet, fruits and vegetables, and potatoes, with a cut-off at c. 5 g N/kg product, with only individual countries crossing this threshold. With regard to the livestock products, ruminant meat exhibited the highest N footprint in both models of c. 500 g N/kg product with peak values for Latvia (CAPRI) or Greece (MITERRA) at c. 1000 g N/kg product. Dairy products and eggs had the lowest N footprint.
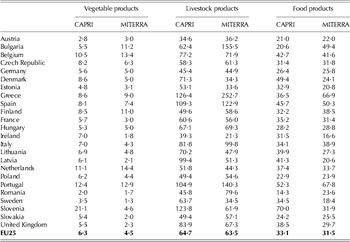
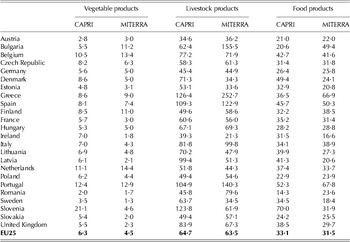
Data on the N footprint are summarized in Table 2 by country for vegetable products and livestock products as estimated by the CAPRI and the MITERRA models. The data were aggregated weighted by ‘human consumption’. Thus, production for export or other domestic uses did not impact on the weighted average. Also, the data for all food products considered were calculated. The data showed that, even though differences between CAPRI and MITERRA were relatively small at EU25 level, MITERRA associated a 5% smaller N footprint with food products and the N footprint for vegetable products was 28% smaller than that estimated by CAPRI. However, a better agreement was found for livestock products with a difference of only 2% for EU25.
Nitrogen footprint estimated with the CAPRI and the MITERRA models for vegetable and livestock products, and total food products supplied by EU countries for human consumption (g N/kg product)
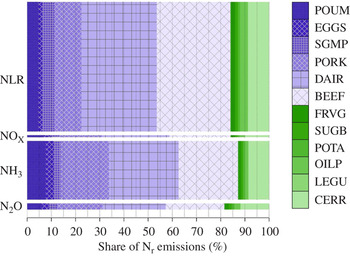
A split of total losses of reactive N (NH3, NOx, N2O, and N leaching and runoff) for EU27 is shown in Fig. 3, differentiated by food categories, as calculated by CAPRI. Livestock products dominated Nr losses, with a share of 82–88%. The highest contribution of livestock products was for NH3 emissions, due to the higher NH3 emissions from manure than from other N-sources and additionally high NH3 emissions from housing and manure storage systems. The lowest contribution was for N2O emissions, being largely proportional to N-input and thus close to the use of new N for the production of vegetable v. livestock products.
Share of reactive nitrogen emissions for the 12 main food commodity groups as calculated with the CAPRI model (reference year 2004). The width of the bars is proportional to the emissions. Total emissions are N2O: 0·29 Tg N/year; NH3: 2·8 Tg N/year; NOx: 0·09 Tg N/year; N leaching and run-off (NLR): 6·3 Tg N/year; other nitrogen considered in the N footprint losses (N2 emissions, manure and animal wastes), but not shown: 5·3 Tg N/year. (colour version available online)

Nitrogen investment factor
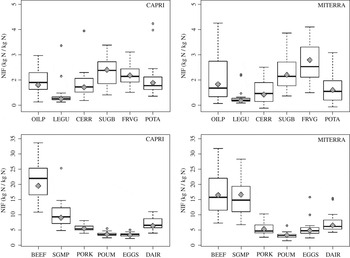
The N investment factors for the 12 food categories considered, calculated by CAPRI and MITERRA, are shown in Fig. 4 as EU25 average and the distribution of the N investment factor for all countries. As for the N footprint, there was a clear cut-off between vegetable and livestock products at 3 kg N input/kg N in product; however, the ranking within the food category classes differed from the N footprint. Vegetable foods with a low N-content such as sugar beet (1·8 g N/kg product) and fruits and vegetables (1·6–2·5 g N/kg product) showed a relatively high N investment factor of 2·2–2·8 for EU25, with values twice as high in some countries. However, differences in the N investment factors between vegetable food categories were small and variability across the countries dominated. Ruminant meat had the highest N investment factor with similar values calculated by MITERRA for beef, sheep and goat meat, and lower values for sheep and goat meat calculated by CAPRI allocating part of the N input to wool. Sheep and goat production is concentrated in a few countries (with two thirds of production being in the UK, Spain, France and Greece). Nitrogen investment factors for poultry meat in both models and eggs in CAPRI were at a ‘competitive’ level with respect to vegetable food products with an EU25 average of c. 3·5.
Nitrogen investment factor for the 12 main food categories (kg N input/kg N in product). Left: CAPRI; right: MITERRA. The box-whisker diagram shows the median and lower and upper quartiles (boxes) and the minimum and maximum of the sample (whiskers) excluding outliers. Outliers (more than 1·5 times the quartiles) are shown as circles. The values for EU27, calculated as weighted average, are shown as diamonds.

DISCUSSION
Nitrogen footprint v. other footprints
There is a multitude of definitions of the term ‘footprint’. Wiedmann & Minx (Reference Wiedmann, Minx and Pertsova2007) define carbon footprint as ‘[…] a measure of the exclusive total amount of carbon dioxide emissions that is directly and indirectly caused by an activity or is accumulated over the life stages of a product.’ The water footprint is ‘[…] the volume of freshwater used to produce the product, measured over the full supply chain’ (Mekonnen & Hoekstra Reference Mekonnen and Hoekstra2011). The water footprint is a multi-dimensional indicator measuring different types of pollution and is geographically and temporally disaggregated (Mekonnen & Hoekstra Reference Mekonnen and Hoekstra2011). Indeed the concept of the water and carbon footprints also diverge in terms of their scope (water input v. carbon equivalents output; weighting by regional water stress v. global warming potential…) or research questions. While the water footprint focuses on the human appropriation of a natural resource, the carbon footprint measures the impact of greenhouse gas emissions (Galli et al. Reference Galli, Wiedmann, Ercin, Knoblauch, Ewing and Giljum2012) and requires thus the application of a LCA to quantify emissions comprehensively (ENVIFOOD 2012). The N footprint, as defined by Leach et al. (Reference Leach, Galloway, Bleeker, Erisman, Kohn and Kitzes2012), is analogous to the water footprint concept as human appropriation of N and encompasses total N input, taking into consideration all streams that leave the agrosphere via atmospheric or hydrospheric transport.
The environmental impact of a product has many dimensions, from which the N footprint, the water footprint (Hoekstra & Mekonnen Reference Hoekstra and Mekonnen2012; Vanham & Bidoglio Reference Vanham and Bidoglio2013) and the carbon footprint (Weiss & Leip Reference Weiss and Leip2012) are just a few. In a comprehensive impact assessment, other ecosystem services (Maes et al. Reference Maes, Paracchini, Zulian, Dunbar and Alkemade2012) need to be addressed as well. The N footprint or N investment factors are not yet included in a comprehensive life-cycle impact assessment (European Commission 2010a , 2012). The need for an integrated indicator for N is also suggested by Pelletier & Leip (Reference Pelletier and Leip2013) as a separate impact category in process-based life-cycle inventories.
N footprints and Nitrogen investment factor
The N footprint calculated in the current paper considers only N losses up to the farm gate; however, losses and wastage of food products in processing, retail and food preparation might be significant. Bellarby et al. (Reference Bellarby, Tirado, Leip, Weiss, Lesschen and Smith2013) reviewed available information on waste streams in Europe and estimated that c. 0·20 of food is wasted in Europe. This is consistent with data compiled by the European Commission (2010b ), which indicated a total food waste generation in Europe in the manufacture, household, retail and catering sectors of c. 89 Mt and a total supply in Europe of 434 Mt, whereby major, and about equal, losses occur in the manufacture and household sectors (72 Mt). Thus, the N footprint data calculated in the current paper should be increased by c. 25%, which should be taken as a conservative value since the N-content of wastes might contain a higher share of low-protein biomass (e.g. peelings), and recycling (composting) of food wastes that would reduce the N footprint.
The assumptions of the current paper are conservative since recycling of ‘surplus’ manure was not considered, in those cases when manure excretion – net of losses from housing and manure management systems – is higher than the manure input required to grow the feed. The use of this N on food crops in combined systems improves the N footprint, if substituting for other N-sources. However, as most manure is used for feed crops, this has little effect on the calculated N footprint.
The N investment factor is comparable to the virtual N factor defined by Leach et al. (Reference Leach, Galloway, Bleeker, Erisman, Kohn and Kitzes2012), which gives the total N lost to the environment per unit of N consumption; the virtual N factor is thus smaller than the N investment factor calculated in the current paper, which gives the total N input required. Leach et al. (Reference Leach, Galloway, Bleeker, Erisman, Kohn and Kitzes2012) assessed industrialized food production systems common in developed countries on the example of average U.S. conventional production systems for four vegetable product categories and five livestock product categories. The vegetable categories considered (and their virtual N factor) were grains (1·4), legumes (0·7), starchy roots (1·5) and vegetables (10·6). The livestock categories considered were poultry (3·4), pork (4·7), beef (8·5), milk (5·7), and fish and seafood (3·0). A comparison with values for EU25 data shows that the data are very similar for starchy roots (sugar beet and potato), pork, milk and also poultry (meat and eggs), while the N investment factor in the current paper for beef is 19·5, almost double that estimated by Leach et al. (Reference Leach, Galloway, Bleeker, Erisman, Kohn and Kitzes2012). One of the main differences between the models might be the assumed N use efficiency (NUE) in cattle, which is 20% in Leach et al. (Reference Leach, Galloway, Bleeker, Erisman, Kohn and Kitzes2012), but is calculated in the current paper to be only 8% for beef (however >20% for pork and milk, and >30% for poultry products, with an average of 18% for all livestock products). However, Leach et al. (Reference Leach, Galloway, Bleeker, Erisman, Kohn and Kitzes2012) assume lower recycling rates for crop residues and manure (35%) than in the current calculations.
Nguyen et al. (Reference Nguyen, Hermansen and Mogensen2010) calculated a farm gate N surplus for four representative beef systems in Europe, i.e. on a suckler cow–calf system and three different dairy–bull-calf systems. The NUE of the suckler cow–calf system was 9% and for the dairy–bull-calf systems ranged from 9 to 24%. The corresponding total N surplus ranged from 130 to 440 g N/kg product. Considering that imported feed is used as input and not substituted with the corresponding soil N budget, those results compare well with the current results of 440 g N/kg product.
Chatzimpiros & Barles (Reference Chatzimpiros and Barles2013) calculated an NUE for beef production in France of 10 and 24% for milk and pork production, respectively, which are close to the current values, even though the present results showed a slightly lower NUE for beef. The overall NUE drops considerably, if also considering the NUE of feed production, down to values of 7% for beef and 13% for milk and pork in France (Chatzimpiros & Barles Reference Chatzimpiros and Barles2013). The corresponding N investment factors (which are the inverse of the NUE calculated) compare very well with the current data for France in the case of milk, but are higher or lower for pork and beef, respectively.
Thus, while the NUE used by Leach et al. (Reference Leach, Galloway, Bleeker, Erisman, Kohn and Kitzes2012) has been derived for typical U.S. beef production systems, the current study used values that are within, although at the lower end of, the reported range for European conditions. One reason for a slight under-estimation of average NUE in beef cattle (and consequently a slight over-estimation of the N investment factor) might be a small over-supply of feed in CAPRI (cf. Weiss & Leip Reference Weiss and Leip2012; S. Vannucini, FAOSTAT, 2013, personal communication).
Model comparison: CAPRI v. MITERRA
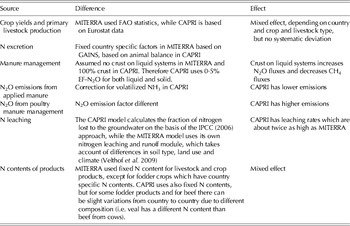
A list of differences in methodology between CAPRI and MITERRA with relevance to the calculation of the N footprint and Nr emissions is given in Table 3. One of the main differences is that in MITERRA the feed intake and excretion were from different sources, i.e. feed intake from CAPRI and N excretion from GAINS, which can lead to mismatches for some countries and animal types. CAPRI on the other hand has, by definition, a closed animal N budget, as the excretion is the result of the feed intake minus the N in livestock products and waste. The feed intake in CAPRI was calculated endogenously having to meet the total national feed position in the EU farm and market balance statistics for each feed product and the protein and energy requirements of the animals depending on the output. Similarly, N inputs have to meet the plant needs depending on, yield, N content and some assumptions on crop residues and over-fertilization, the constrain that all manure produced and mineral fertilizer in the official statistics has to be applied or emitted.
Differences between CAPRI and MITERRA estimation of the N footprint

The CAPRI approach is very flexible since the strong link to statistical sources combined with endogenous calculation of N-transfer factors allows the propagation of changes/differences in animal nutrition to N supply for crop production and vice versa. However, the downside of this approach is that errors in statistical data or N flows unaccounted for in CAPRI, which cannot be detected and corrected in the CAPRI data assimilation tool, are bound to ‘remain in the system’. For example, differences in fertilizer data obtained from IFA and EFMA for Slovenia by almost a factor of two created considerable uncertainty and were responsible for most of the outlier-data in the CAPRI data in Figs 2 and 4. Also, the relatively high N footprint values for Denmark might be related to the over-estimation of fishmeal in agriculture in FAO data (S. Vannucini, FAOSTAT, 2013, personal communication).
Results on the level of EU27 are fairly similar in CAPRI and MITERRA (Fig. 2), but differences at country level can be considerable and are not systematic (Table 2). For example, MITERRA estimated an N footprint for crop products consumed in Bulgaria of 11 g N/kg product, which is about twice the CAPRI estimate of c. 5·5 g N/kg product. In Bulgaria, MITERRA estimated higher N footprints for all vegetable products. On the other hand, the higher N footprint estimated of livestock products consumed in Latvia by CAPRI (99 g N/kg product v. 51 g N/kg product in MITERRA) is due mainly to higher N footprint values calculated for beef (factor 2·4) and dairy products (factor 1·5), while lower N footprint values are estimated by the CAPRI model for pork, eggs and sheep or goat meat.
The apparent low correlation between results of the two models for the food categories was dominated by outlier values visible in both CAPRI and MITERRA data. However, ignoring outliers, which are probably linked to input data problems rather than spatial variability, leads to coefficients of correlation of 0·38–0·78 for crops (including legumes), and 0·15–0·53 for animal products.
CAPRI is a distinct ‘top-down’ model which relies strongly on the quality of official statistics. The analysis of outlier values often leads to the identification of deficiencies or inconsistencies in these data sources. However, such uncertainties are product-specific and are concentrated in a few countries, which are not the same for CAPRI and MITERRA. In general, there was agreement in inter-country differences between the models in the current paper. The analysis also showed that the more complex the quantification becomes (as in the case of animal products), the more important uncertainties are, and the less there is to gain from estimates on a disaggregated level. Tackling these problems is not an easy task, and it is suggested that until more rigorous validation of all data sources has been done, the differences in results across countries for certain indicator/products should be interpreted with caution.
Relevance of N footprints
The calculated footprints and distribution of Nr losses over the different agricultural sectors are relevant for a number of reasons. Differences in footprint give an indication of the environmental effects of switching from one food product to another, especially when expressed per unit of N (being equivalent to protein) or unit of energy. As the current paper has shown, livestock products in general have higher N footprints, especially beef, sheep and goat meat. However, as the continuation of use and management of grasslands is one of the key objectives in the EU Common Agricultural Policy, not all ruminant production can be discontinued. Grasslands might serve other ecosystem services, e.g. biodiversity (European Council 2007) and carbon sequestration (Soussana et al. Reference Soussana, Tallec and Blanfort2010).
Differences in N footprints between countries of similar food products might serve as benchmarking and indication of potential improvement. Interpretation of the results should, however, be done carefully, since methodological issues might explain some of the differences, as well as differences in production conditions that are difficult to change, such as climate or soil conditions. A third reason for using the outcomes in the current study is for setting policy and research priorities, as it is clear which food products dominate the Nr losses. If policies and research would focus on reducing the losses from the production of these products, by stimulating technical solutions or implementing targeted policies, much progress can potentially be made to reduce these losses.
Full N footprint calculators, such as proposed by Leach et al. (Reference Leach, Galloway, Bleeker, Erisman, Kohn and Kitzes2012), are important tools for consumers enabling them to include the N footprint in the portfolio of food characteristics, on which to base their dietary decisions. The current study, although estimating the N footprint at the farm gate only and thus not considering further N losses and increases in the N footprint at the retail and consumption stages, could be used in such tools addressing European farming conditions.
CONCLUSION
There is robust evidence that both the N footprint and the N investment factor of ruminant meat are highest among all food categories considered. For EU25, the N footprint for those food products was c. 500 g N/kg product, while the N footprint for all other products was considerably lower, with a consistent ranking of the product categories: pork and poultry meat at c. 100 g N/kg product and eggs and milk between 30 and 50 g N/kg product. For the vegetable products, the ranking was oilseeds (c. 20 g N/kg product)>cereals and pulses (at c. 10 g N/kg product)>sugar beet, fruits and vegetables, and potatoes (2–3 g N/kg product). Both ranking and relative differences were smaller when looking at the N investment factor, due to the different protein contents in the products and there was a clear cut-off between vegetable and livestock products at 3 kg N input/kg N in product). While 1·2 kg of new N was required for the consumption of 1 kg protein-N in pulses, 15–20 kg N was required for the consumption of 1 kg of protein-N in beef (EU25 averages from CAPRI and MITERRA). Amongst the losses of reactive N, N leaching and run-off and ammonia volatilization dominated, with 83 and 88%, respectively, due to consumption of livestock products.
While the order of magnitude of the results and also the differences between the products at EU25 level agree well between the two models, there was more variation in the results at country level, which is product- and country-specific and often highlights problems in statistical sources which need careful consideration.
The N footprint and the N investment factor are important indicators which give comprehensive information not only on potential emissions to atmosphere and hydrosphere, but also for the degree of wasteful production systems.
The authors would like to thank the European Commission funded research project ANIMALCHANGE (FP7-266018) and the UNECE Task Force on Reactive Nitrogen, including from the Dutch Ministry (WOT-04-008-010) for supporting the research and collaboration underpinning the results presented in the current paper.