Implications
National genetic evaluation of Jersey cattle in Mexico relies on the absence of interaction between genotype and feeding system. In this paper, it is shown that the magnitude of the interaction depends on the indicator variable used. The results indicated that national analyses are relatively safe to use in confinement and grazing systems. Further research should evaluate the adjustment of variances from records in confinement and grazing. Generalization of these results should consider the magnitude of differences between specific genotypes and environments.
Introduction
Genotype–environment interaction (GEI) occurs when genotypes differ in expression among different environments. Several studies in dairy cattle (mostly Holstein) to determine the magnitude of GEI between breeding values and different environments (countries, production levels and management systems) have been carried out. The results have varied depending on the specific genotypes and environments studied (Cerón et al., Reference Cerón, Tonhati, Costa and Benavides2001; Boettcher et al., Reference Boettcher, Fatehi and Schutz2003; Valencia et al., Reference Valencia, Montaldo and Ruíz2008). Thus, knowing the magnitude of some specific GEI could be important to identify the best genotypes for specific environments.
National genetic evaluations of Jersey cattle have been performed in Mexico since 2004. Predicted breeding values are used in the whole population, under the assumption that ranking of animals based on national evaluation is independent of the environment where they will be utilized. The presence of GEI could have important economic implications, since it can reduce the response to selection (Robertson, Reference Robertson1959; Carabaño et al., Reference Carabaño, Van Vleck and Wiggans1989; Cerón et al., Reference Cerón, Tonhati, Costa and Benavides2001). Most of the Jersey cattle are fed in total confinement; however, some of them are fed on intensive grazing. Some breeders have become concerned that the current national genetic evaluation cannot rank cattle correctly for grazing systems; then, a separate selection program might be implemented. Therefore, it is important to determine whether the shown superiority of confined cattle is expressed in herds under grazing.
The objective of this study was to determine the magnitude of genotype by environment (confinement and grazing) interaction, in the Mexican genetic evaluation of Jersey cattle for milk yield (MY).
Material and methods
Data
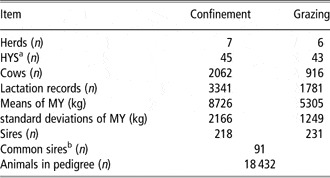
Performance and pedigree data were obtained from the national database of the Mexican Jersey Breeder Association. Most of the herds are located in the central region of Mexico, where the prevailing climate is temperate. The individual daily yield of milk was recorded monthly for lactations from 1998 to 2008. General information about data used for confinement and grazing is shown in Table 1.
Ten-year milk yield (MY) data (1998 to 2008) for feeding systems: confinement and grazing

aHerd, year and season of calving.
bSires with daughters in both feeding systems.
Genotypes studied were defined as the individual breeding values of the animals. Two environments were defined by feeding system: confinement or grazing. In the confinement system, herds were fed total mixed rations throughout the year, whereas in the grazing system cattle were under pasture-based management (intensive rotational grazing) for at least 6 months/year. Some herds in the grazing system were under partial or complete confinement during the dry season.
Statistical analyses
Lactations of 305-days mature equivalent DHI-Provo records were used. Estimates of lactations with less than eight monthly records or lactation yields exceeding ± 3 s.d. from the mean were discarded. Contemporary groups were formed by combining the effects of herd, year and season of calving. Seasons were defined according to average temperature and rainfall registered monthly throughout 10 years in the weather stations closest to each herd; the seasons were: rainy (June to October) and dry (November to May). Genetic connectedness among contemporary groups was determined using the AMC program (Roso and Schenkel, Reference Roso and Schenkel2006).
The statistical analyses to estimate genetic parameters and to predict breeding values were performed using an animal model and the MTDFREML program (Boldman et al., Reference Boldman, Kriese, Van Vleck, Van Tassell and Kachman1995). A conventional univariate model was used to select the random and fixed effects, according to the methodology followed by Domínguez-Viveros et al. (Reference Domínguez-Viveros, Núñez-Domínguez, Ramírez-Valverde and Ruíz-Flores2003). The final model was:

where y is the vector of yield records; b is the vector of fixed herd-year-season effects; u is the vector of additive genetic effects; pe is the vector of permanent environmental effects; e is the vector of residual effects; and X, Z, and W are incidence matrices relating yield records to the corresponding vectors. Assumptions were:

and

where V is the number of cows; N is the number of yield records; A is the additive genetic relationship matrix among the animals; and IV and IN are identity matrices of order V and N.
For the preliminary detection of GEI, a second univariate model was used to account for any preferential treatment of sire progeny within a herd. In this model, a random effect of the interaction sire by herd-year-season (sire × hys) was added to the conventional model (model 1). Using this approach, the proportion of the phenotypic variance due to sire × hys variance (c 2) was an indicator of this specific GEI. The matrix representation of this model (interaction model; model 2) was:

where t is the vector of random effects of interaction sire × hys, and I is the incidence matrix relating yield records to the interaction vector t. This model had the same assumptions as model 1, and also E[t] = 0 and variance of t = Isσ 2t, with Is representing an identity matrix of order equal to the levels of interaction sire × hys, and σ 2t representing the variance of random effects of the interaction.
The effectiveness of including the interaction sire × hys in the model was tested by the likelihood ratio test according to the methodology used by Domínguez-Viveros et al. (Reference Domínguez-Viveros, Núñez-Domínguez, Ramírez-Valverde and Ruíz-Flores2003).
Based on the conventional model (model 1) of the previously described univariate analysis, a bivariate analysis was performed for the trait studied. In this case, the two ‘traits’ were measurements of the same biological parameter in the two feeding systems. Thus, MY of cows in confinement was considered as the first trait and MY of grazing cows was considered as the second trait. In this model, each cow had the information reported for a given trait in one environment and missing for the other. The matrix representation in the bivariate model was:

where subscripts 1 and 2 represent the two feeding systems (confinement or grazing) for MY.
Approach to evaluate genotype by feeding system interaction
The results with the bivariate model (model 3) were used to determine the size of genotype by feeding system interaction, using the following indicator variables:
1. Magnitude of the genetic correlation. Estimate of the genetic correlation (r g) was the indicator of the magnitude of GEI, where r g < 1 indicated the presence of GEI. Likelihood ratio statistic was used to test whether the genetic correlation between the two feeding systems was less than unity (Robert et al., Reference Robert, Foulley and Ducrocq1995).
2. Correlation coefficient between predicted breeding values. Correlation coefficients between breeding values obtained from confinement or grazing were estimated (SAS, 2002) using rank and product-moment correlations. However, rank correlations are not reported in this study because the estimates were like those obtained in product-moment correlations. This indicator variable was used to determine the magnitude of GEI, and it showed the re-ranking of the predicted breeding values for all the animals evaluated from confinement or grazing data.
To determine the impact of using one national genetic evaluation (model 1) v. separate evaluations for confinement and grazing (model 3), correlation coefficients between breeding values of the animals were estimated from models 1 and 3.
3. Frequency of coincidence in ranking of top sires. The frequency of coincidence in top sires was used as an indicator of re-ranking of top sires in confinement and grazing, a form of considering the possible GEI in animals with more impact in genetic improvement. In this study, the frequency of coincidence was computed for the 100 sires with the highest predicted breeding values obtained from analysis in the two environments studied.
Results and discussion
Variance of the interaction sire × hys
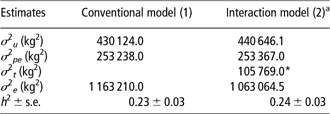
The estimates of heritability and variance components for conventional and interaction models (models 1 and 2) are shown in Table 2. The variability of the data was explained better (P < 0.05) when the random effect of the interaction sire × hys was added. The proportion of the phenotypic variance due to the sire × hys effect (c 2) was 5.7%. The estimate of c 2 from this study suggested that the interaction sire × hys could be an indicator of a possible genotype by feeding system interaction, and it is within range (1% to 7%) of other estimates in dairy cattle (Banos and Shook, Reference Banos and Shook1990; Calus et al., Reference Calus, Groen and De Jong2002; Vargas and Gamboa, Reference Vargas and Gamboa2008).
Variance estimates for the effects: additive genetic (σ 2u), permanent environmental (σ 2pe), sire × hys interaction (σ 2t) and residual (σ 2e); and heritability estimate (h 2) for milk yield, using two univariate models

aInteraction model (2) includes the effects of conventional model and sire x herd, year and season interaction effect (σ 2t).
The estimates of additive genetic variance from the interaction model (model 2) were only slightly higher than those from the conventional model (model 1), while the residual variances were only slightly lower (Table 2). Therefore, the heritability estimates obtained with the two models showed only marginal differences, which suggested a partial explanation to the presence of a possible interaction between genotypes and feeding systems considered. However, Banos and Shook (Reference Banos and Shook1990) noted that exclusion of an important sire × environment interaction could overestimate the accuracy of sire evaluations, although the changes in their rankings would not be considerably affected.
Genetic correlation
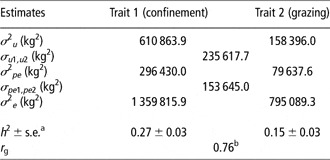
The estimate of r g between the two environments (model 3) was 0.76 (Table 3). Genetic correlation was <1.0 (P < 0.05), indicating the presence of genotype by feeding system interaction and at least some re-ranking of the animals. However, a larger and better-structured database is required for definitive conclusions.
Variance estimates for the effects: additive genetic (σ 2u), permanent environmental (σ 2pe) and residual (σ 2e); covariance estimates for the effects: additive genetic (σu 1,u 2) and permanent environmental (σpe1 ,pe 2); and heritability (h 2) and genetic correlation (r g) estimates for milk yield, using a bivariate model (trait 1 = confinement and trait 2 = grazing)

aStandard errors from univariate models.
bEstimate different of unity (P < 0.05).
In confinement and grazing Holstein systems in the United States (Weigel et al., Reference Weigel, Kriegl and Pohlman1999) and Canada (Boettcher et al., Reference Boettcher, Fatehi and Schutz2003) the estimated values of r g for MY were 0.92 and 0.93, respectively, indicating that GEI was not important (r g = 1.0, P < 0.05). Kearney et al. (Reference Kearney, Schutz, Boettcher and Weigel2004) and Fahey et al. (Reference Fahey, Schutz, Lofgren, Schinckel and Stewart2007) estimated r g in grazing v. confinement of US Holstein herds with data divided into variance quartiles based on variance of MY. These authors concluded that GEI occurred for only some traits and levels of production of the herds. The estimate of our genetic correlation was lower than those of the studies already mentioned. This might be explained mainly by the differences in the production level per cow between confinement and grazing systems (Boettcher et al., Reference Boettcher, Fatehi and Schutz2003). In this study, cows yielded 64% more milk in confinement than in grazing (Table 1), whereas this difference was only 6% to 16% in other studies (Weigel et al., Reference Weigel, Kriegl and Pohlman1999; Boettcher et al., Reference Boettcher, Fatehi and Schutz2003; Kearney et al., Reference Kearney, Schutz, Boettcher and Weigel2004; Fahey et al., Reference Fahey, Schutz, Lofgren, Schinckel and Stewart2007).
In this study, the heritability estimate using confinement data (0.27 ± 0.03) was higher than that obtained using grazing data (0.15 ± 0.03). The additive genetic variance from confinement was 4.1 times higher than that from grazing and the residual variance was only 2.3 times higher. This agrees with the reported phenotypic means from confinement and grazing of our study (Table 1) and with studies that have shown less genetic variation in lower production herds (Cromie et al., Reference Cromie, Kelleher, Gordon and Rath1998; Cienfuegos-Rivas et al., Reference Cienfuegos-Rivas, Oltenacu, Blake, Schwager, Castillo-Juárez and Ruiz1999; Kearney et al., Reference Kearney, Schutz, Boettcher and Weigel2004). Boettcher et al. (Reference Boettcher, Fatehi and Schutz2003) estimated higher heritability using herds in confinement than in grazing, and suggested that genetic differences among animals were better expressed in herds under confinement. The difference could result from a more complete expression of the true genetic value in a ‘better’ environment (Cerón-Muñoz et al., Reference Cerón-Muñoz, Tonhati, Costa, Rojas-Sarmiento and Echeverri2004). Boldman and Freeman (Reference Boldman and Freeman1990) mentioned that sires with most of their daughters in herds showing higher variances could be over-evaluated.
Because of the differences in estimates of variance and heritability from the two feeding systems, means and standard deviations of the predicted breeding values were higher in confinement than in grazing. This suggested that Jersey cattle selected in favorable environments will not perform as well in less favorable feeding conditions. Therefore, the problem would be to transfer correctly the genetic progress from high-input level farms to low-input level farms in temperate climate. Boettcher et al. (Reference Boettcher, Fatehi and Schutz2003) reported higher breeding values when predicted from confinement data and attributed it to a scaling effect. When herds in two environments show differences in additive genetic variances, Carabaño et al. (Reference Carabaño, Van Vleck and Wiggans1989) mentioned that a scaling effect is expected.
Estimates of genetic and phenotypic variances, heritability and means of breeding values higher in confinement than grazing suggested a possible heterogeneity of variances for the two environments, and a possible scaling effect in variances. Hill (Reference Hill1984) reported that ignoring the heterogeneity of variances might cause a higher proportion of animals to be selected from herds with larger variability, resulting in a long-term decrease in genetic progress. The results of this study indicated that further research is needed to assess the advantage of adjusting variances from records in confinement and grazing.
Correlation between predicted breeding values
The estimates of correlations between predicted breeding values of the cattle under confinement and grazing (0.96) were higher than the r g value (0.8) suggested by Robertson (Reference Robertson1959) to be considered as biologically important GEI. Therefore, this estimated r g suggested only a low re-ranking of animals.
In addition, the estimated correlation coefficient between predicted breeding values of animals obtained from the conventional model (model 1) and confinement system (model 3) was 0.99, whereas for the conventional model (model 1) and grazing system (model 3) it was 0.93. These high correlation estimates indicated that the breeding values predicted with the conventional model could be safely used for both feeding systems; therefore, separate genetic evaluations for each system seem not to be justified.
Coincidence between breeding values of top sires
The frequency of coincidence between breeding values of common sires within the top 100 from confinement and grazing was 0.86. This indicated that re-ranking was low-to-moderate in top sires. This finding agrees with the results of Mulder et al. (Reference Mulder, Groen, De Jong and Bijma2004), who reported that the re-ranking effect is most likely observed for top sires.
The frequencies of coincidence between breeding values of top sires, when using the conventional and bivariate analyses, was 0.98 for the conventional model and confinement system, and 0.87 for the conventional model and grazing system. These results suggested that ranking of top sires would be similar when selection is carried out under any of the conventional, confinement or grazing analyses. The similarity between breeding values predicted with conventional and confinement evaluations indicated that the problem, if any, of using nationally predicted breeding values could be more severe for herds in grazing systems.
This study arrived at different conclusions in terms of the presence and magnitude of genotype by feeding system interaction, depending on which the indicator variable was considered. However, for both environments, the evidence suggested low-to-moderate re-ranking of animals of practical importance.
Intensive grazing systems are gaining popularity as a low input form of management of dairy herds (Weigel et al., Reference Weigel, Kriegl and Pohlman1999). In general, a more complete database and dairy breeding research are needed to benefit farmers with grazing systems to improve feeding efficiency and profit. Weigel et al. (Reference Weigel, Rekaya, Zwald and Fikse2001) mentioned that detection of GEI may reflect real differences of management systems, or a lack of information due to poor genetic connectedness among environments. Generalization of results from this study to other breeds or feeding systems should require proper consideration of the magnitude of differences between specific genotypes and environments.
Conclusions
The presence and magnitude of the genotype by feeding system interaction for genetic evaluation of MY of Jersey cattle in Mexico depend on the indicator variable used. The genetic correlation suggests the presence of genotype by feeding system interaction; however, the correlation coefficient between breeding values from confined and grazing animals and the frequency of coincidence between breeding values of common sires within the top 100 in confinement and grazing indicate a low-to-moderate proportion of practical re-ranking of animals or top sires. Rank changes between breeding values from animals evaluated in separate management systems are not large enough to justify independent national genetic evaluations for each system.
Acknowledgments
The authors thank the Asociación Mexicana de Criadores de Ganado Jersey de Registro for allowing the use of their performance and pedigree databases for this study. The authors also thank CONACYT for the financial support to the second author during her Master of Science studies and Barbara Gastel for the editing of this paper.