1. Introduction.
The curve fitting problem has a long history in both statistics and philosophy of science, and it's often viewed as a formal way to encapsulate the many dimensions and issues associated with inductive inference, including the underdetermination and the reliability of inference problems.
In its simplest form the curve fitting problem is how to choose among the multitude of ways to fit a curve through any scatter plot of data points
 $\{ (x_{k},\, y_{k}),\, k=1,\,\ldots,\, n\} $
in a way that would capture the ‘regularities’ in the data adequately. Since there is an infinity of possible curves (models) that can be thought to be ‘consistent with any data’, the crucial problem is what criteria to use to direct the choice from among the wealth of possible curves. Establishing high goodness-of-fit between the data and a curve is obviously far too easy to achieve. The crucial question is: Which among the variety of rules for winnowing down the selection should be followed in order to arrive at reliable inductive inferences? Philosophers have despaired of solving this problem via any purely a priori, logical means, and appeals to pragmatic criteria, such as simplicity, proved highly equivocal (Salmon Reference Salmon1967; Glymour Reference Glymour1981; Skyrms Reference Skyrms2000).
As philosophers of science increasingly appealed to formal methods used in scientific practice, a new avenue for addressing this thorny problem was opened. Given a class of models, one can use a formal model selection procedure, such as the Akaike Information Criterion (AIC) and related procedures based on the likelihood function, to select a fittest model by trading goodness-of-fit against simplicity (see Forster and Sober Reference Forster and Sober1994 and Kieseppa Reference Kieseppa1997, inter alia). The appeal of such automatic selection procedures is enticing because it provides a formal and objective way to choose among the multitude of possible curves (Rao and Wu Reference Rao, Wu and Lahiri2001). Although it is understandable that such algorithms would galvanize philosophers to see in them the long sought for solution to core problems of induction, what is really needed is a scrutiny of the epistemic credentials of these procedures by both statisticians and philosophers.
The main aim of this paper is to revisit the curve fitting problem using the reliability of inductive inference as a primary criterion for the ‘fittest’ curve. Viewed from this perspective, it is argued that a crucial concern with the current framework for addressing the curve fitting problem is, on the one hand, the undue influence of the mathematical approximation perspective, and on the other, the insufficient attention paid to the statistical modeling aspects of the problem. Using goodness-of-fit as the primary guiding criterion, the mathematical approximation perspective undermines the reliability of inference objective by giving rise to selection rules which pay insufficient attention to ‘accounting for the regularities in the data’. It is argued that high goodness-of-fit, however tempered, is neither necessary nor sufficient for reliable inference. A more appropriate framework is offered by the error-statistical approach (Mayo Reference Mayo1996), where (i) statistical adequacy provides the criterion for assessing when a curve accounts for the regularities in the data adequately, and (ii) the relevant error probabilities can be used to assess the reliability of inductive inference.
Broadly speaking, the fittest curve (statistically adequate) is not determined by the smallness if its residuals, tempered by simplicity or other pragmatic criteria, but by the nonsystematic (e.g. white noise) nature of its residuals. The advocated error-statistical arguments are illustrated by comparing the Kepler and Ptolemaic models on empirical grounds, showing that the former is statistically adequate but the latter is not. Indeed, the Ptolemaic model constitutes the quintessential example of ‘best’ in a mathematical approximation sense, that gives rise to systematic (nonwhite noise) residuals, and thus, it does not ‘save the phenomena’.
Section 2 brings out the undue influence of the mathematical approximation perspective on the current discussions of the curve fitting problem. It is argued that this perspective can be both inadequate and misleading if reliable inductive inference is a primary objective. This is elaborated upon by comparing Legendre's (Reference Legendre1805) mathematical approximation with Gauss's (Reference Gauss1809) statistical modeling perspective, bringing out the potential conflict between ‘best’ in the former (goodness-of-fit), and in the latter (statistically adequate) perspective. Section 3 summarizes the basic tenets of the error-statistical approach, viewed as a modern refinement of Gauss's pioneering empirical modeling perspective, emphasizing the role of statistical adequacy as the cornerstone of reliable inductive inference. In Section 4 this perspective is used to shed light on a number of issues associated with the curve fitting problem including goodness-of-fit, predictive accuracy, projectible regularities, simplicity, overfitting and underdetermination. These arguments are illustrated by comparing the Kepler and Ptolemaic models on empirical grounds.
2. Mathematical Approximation vs. Statistical Modeling.
2.1. A Summary of the Curve Fitting Problem.
Curve fitting, in its simplest form, assumes that there exists a true relationship between two variables, say

and the problem is to find an approximating curve, say
 $g_{m}(x) $
, that fits the data
 $\{ (x_{k},\, y_{k}),\, k=1,\,\ldots,\, n\} $
‘best’ and ensures predictive accuracy. The problem, as currently understood, is thought to comprise two stages.
Stage 1. The choice of a family of curves, say

where
 $\mathstrut{{\mbox{\boldmath $\alpha$}}} \mathrel{\mathop:}= (\mathstrut{{\mbox{\boldmath $\alpha$}}} _{0},\,\mathstrut{{\mbox{\boldmath $\alpha$}}} _{1},\,\ldots,\,\mathstrut{{\mbox{\boldmath $\alpha$}}} _{m}) $
, are unknown parameters and
 $\{ \phi _{i}(x),\, i=0,\, 1,\,\ldots,\, m\} $
are known functions, for example, ordinary polynomials
 $\phi _{0}(x) =1,\,\phi _{1}(x) =x,\,\ldots,\,\phi _{m}(x) =x^{m}$
, or even better, orthogonal polynomials (Isaacson and Keller Reference Isaacson and Keller1994).
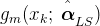
Stage 2. The selection of the ‘best’ fitting curve within (2) using a certain goodness-of-fit criterion. Least squares (LS), which chooses
 $g_{m}(x_{k}\mathrm{;}\,\:\hat{\mathstrut{{\mbox{\boldmath $\alpha$}}} }_{LS}) $
by minimizing the sum of squares of the errors

is the preferred method, yielding the LS estimator
 $\hat{\mathstrut{{\mbox{\boldmath $\alpha$}}} }_{LS}$
of
 $\mathstrut{{\mbox{\boldmath $\alpha$}}} $
and minimum
 $\ell (\hat{\mathstrut{{\mbox{\boldmath $\alpha$}}} }_{LS}) .$
A crucial problem with the above approximation argument is that goodness-of-fit cannot be the sole criterion for ‘best’, because
 $\ell (\mathstrut{{\mbox{\boldmath $\alpha$}}}) $
can be made arbitrarily small by choosing m large enough, giving rise to overfitting. Indeed, as the argument goes, one can render the approximation error zero (
 $\ell (\hat{\mathstrut{{\mbox{\boldmath $\alpha$}}} }_{LS}) =0$
) by choosing
 $m=n-1$
(Isaacson and Keller Reference Isaacson and Keller1994).
Viewing the curve fitting problem in terms of the two stages described above is largely the result of (inadvertently) imposing a mathematical approximation perspective on the problem. The choice of a ‘best’ curve
 $g_{m}(x_{k}\mathrm{;}\,\:\hat{\mathstrut{{\mbox{\boldmath $\alpha$}}} }) $
by minimizing
 $\ell (\mathstrut{{\mbox{\boldmath $\alpha$}}}) $
in (3) would often give rise to a statistically misspecified model, and thus inappropriate as a basis for inductive inference. To shed further light on this issue one needs to compare and contrast the mathematical approximation and statistical modeling perspectives.
2.2. Legendre's Mathematical Approximation Perspective.
The problem of curve fitting as specified by (1)–(3) fits perfectly into Legendre's (Reference Legendre1805) least square approximation perspective. Developments in mathematical approximation theory since then ensure that under certain smoothness conditions on the true function
 $h(\cdot) $
, the approximating function

provides a mathematical solution to the problem in the sense that the error of approximation,
 $\varepsilon (x_{k},\, m) =h(x_{k}) -g_{m}(x_{k}\mathrm{;}\,\,\mathstrut{{\mbox{\boldmath $\alpha$}}}) $
, converges to zero on
 $\mathstrut{\Bbb G} _{n}(\mathbf{x}) $
as
 $m\rightarrow \infty $
:

The convergence in (5), known as convergence in the mean, implies that for every
 $\epsilon > 0$
there exists a large enough integer
 $M(\epsilon) $
such that:

One can achieve a stronger form of convergence, known as uniform convergence, by imposing additional smoothness restrictions on
 $h(x) $
, say, continuous second derivatives (Isaacson and Keller Reference Isaacson and Keller1994). This ensures that for
 $(\epsilon,\, M(\epsilon)) $
as given above

The driving force behind the results (4)–(7) is the maximization of a goodness-of-fit criterion, or equivalently, the minimization of a norm whose general form is

 $p=2$
for (6), and
 $p=\infty $
for (7). These are well-known results in mathematics.
What is less well known, or appreciated enough, is that there is nothing in the above approximation results which prevents the residuals
 $\hat{\varepsilon }(x_{k},\, m) =(y_{k}-g_{m}(x_{k}\mathrm{;}\,\hat{\mathstrut{{\mbox{\boldmath $\alpha$}}} })),\,k=1,\,\ldots,\, n$
, from varying systematically with
 $x_{k}$
and m. Indeed, a closer scrutiny of these theorems reveals that the residuals usually do vary systematically with
 $k,\, x_{k}$
, and m. Let us take a closer look at a typical theorem in this literature.
Theorem 1. Let
 $h(x) $
be a continuous function on
 $[ a,\, b] \subset \mathstrut{\Bbb R} $
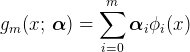
; then a polynomial,
 $g_{m}(x\mathrm{;}\,\,\mathstrut{{\mbox{\boldmath $\alpha$}}}) =\sum_{i=0}^{m}\mathstrut{{\mbox{\boldmath $\alpha$}}} _{i}\phi _{i}(x) $
, will provide a best (and unique) approximation to
 $h(x) $
on
 $[ a,\, b] $
if and only if the error of approximation
 $\varepsilon (x,\, m) =h(x) -g_{m}(x\mathrm{;}\,\,\mathstrut{{\mbox{\boldmath $\alpha$}}}) $
, takes values
 $\mathrm{\max}_{x\in [ a,\, b] }\left|\varepsilon (x,\, m) \right|$
with alternating changes in sign at least
 $m+2$
times over the interval
 $[ a,\, b] $
. (See Isaacson and Keller Reference Isaacson and Keller1994.)
Two things stand out from this theorem. First, the a priori nature of the smoothness conditions on
 $h(x) $
renders them unverifiable. Second, the if and only if condition almost guarantees that the residuals would usually contain systematic information; the presence of cycles (
 $m+2$
changes in sign, m being the degree of the fitted polynomial) in the residuals
 $\{ \hat{\varepsilon }(x_{k},\, m),\, k=1,\,\ldots,\, n\} $
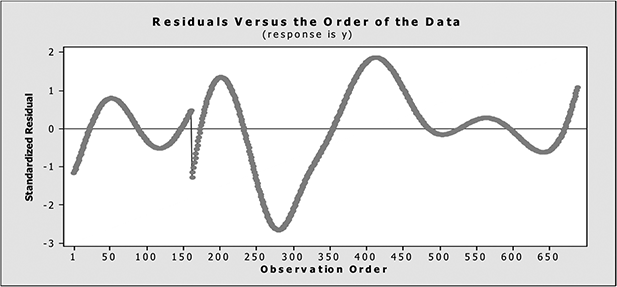
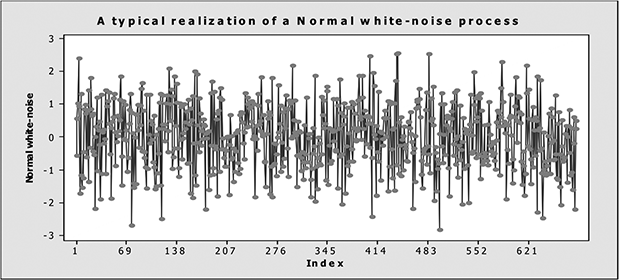
, indicates dependence over k (Spanos Reference Spanos1999, 215). A typical plot of such systematic residuals is given in Figure 3 (in Section 4) exhibiting such cycles. The systematic nature of these residuals is clearly brought out by comparing Figure 3 to Figure 4, which represents a typical realization of nonsystematic (normal, white noise) residuals; these intuitive notions are made precise in Section 3.
To get some idea as to how the mathematical approximation error term varies systematically with
 $(x,\, m) $
, consider the case of the Lagrange interpolation polynomial:

defined on a net of points
 $\mathstrut{\Bbb G} _{n}(\mathbf{x}) \mathrel{\mathop:}= \{ x_{k},\, k=1,\,\ldots,\, n\},\: n\geq m$
, and the interpolation points
 $(x^{*}_{0},\,\ldots,\, x^{*}_{m},\, x) \in [ a,\, b] $
are chosen to be distinct. For a smooth enough function
 $h(x) $
—derivatives up to order
 $m+1$
exist—the error takes the form

that is,
 $\varepsilon (x,\, m) $
is an
 $(m+1) $
degree polynomial in x over
 $[ a,\, b] $
with roots
 $(x^{*}_{0},\,\ldots,\, x^{*}_{m}) $
:

Such an oscillating curve is also typical for errors arising from least squares approximations (Dahliquist and Bjorck Reference Dahliquist, Bjorck and Anderson1974, 100).
In summary, a mathematical approximation method will yield a ‘best’ curve
 $g_{m}(x_{k}\mathrm{;}\,\,\hat{\mathstrut{{\mbox{\boldmath $\alpha$}}} }_{LS}) $
, but the results in (5)–(7), provide insufficient information for assessing either (i) its statistical appropriateness or (ii) the reliability of any inference based on it; as argued below, the two are interrelated. Typically, the approximation residuals
 $\{ \hat{\varepsilon }(x_{k},\, m) =y_{k}-g_{m}(x_{k}\mathrm{;}\,\,\hat{\mathstrut{{\mbox{\boldmath $\alpha$}}} }_{LS}),\, k=1,\,\ldots,\, n\} $
will vary systematically with x and m as in (11), rendering any inductive inference based on
 $g_{m}(x_{k}\mathrm{;}\,\,\hat{\mathstrut{{\mbox{\boldmath $\alpha$}}} }_{LS}) $
unreliable.
2.3. Mathematical vs. Probabilistic Convergence.
A problem with the current understanding of the curve fitting problem arises when the convergence results in (5)–(7) are (unwittingly) conflated with probabilistic convergence needed to establish asymptotic properties for
 $\hat{\mathstrut{{\mbox{\boldmath $\alpha$}}} }_{LS}$
, such as consistency. The former are based on
 $m\rightarrow \infty $
, m being the degree of the approximating polynomial
 $g_{m}(x\mathrm{;}\,\,\mathstrut{{\mbox{\boldmath $\alpha$}}}) $
, but the latter are associated with the sample size
 $n\rightarrow \infty $
.
Conflating these two convergence results is best exemplified by the argument that in curve fitting one can always choose the degree m of
 $g_{m}(x\mathrm{;}\,\,\mathstrut{{\mbox{\boldmath $\alpha$}}}) $
to be one less than the number of observations (
 $m=n-1) $
, rendering the approximation error zero. Although such a choice is perfectly legitimate from the mathematical approximation perspective, it is statistically meaningless, because it will yield
 $m+1$
estimated coefficients
 $\hat{\mathstrut{{\mbox{\boldmath $\alpha$}}} }_{LS}\mathrel{\mathop:}= (\hat{\mathstrut{{\mbox{\boldmath $\alpha$}}} }_{0},\,\hat{\mathstrut{{\mbox{\boldmath $\alpha$}}} }_{1},\,\ldots,\,\hat{\mathstrut{{\mbox{\boldmath $\alpha$}}} }_{m}) $
which are inconsistent estimators of
 $\mathstrut{{\mbox{\boldmath $\alpha$}}} \mathrel{\mathop:}= (\mathstrut{{\mbox{\boldmath $\alpha$}}} _{0},\,\mathstrut{{\mbox{\boldmath $\alpha$}}} _{1},\,\ldots,\,\mathstrut{{\mbox{\boldmath $\alpha$}}} _{m}) $
; there is one observation for each parameter! This brings out the highly misleading nature of the argument that one can just fit an infinite number of curves through the n data points
 $\{ (x_{k},\, y_{k}),\, k=1,\,\ldots,\, n\} $
that can be ‘equally consistent with the data’. Nothing can be further from the truth; any curve that passes through all, or even most, of these points will be estimating nothing statistically meaningful—some feature of a statistical model, such as a parameter or a moment. It is no wonder that the curve fitting problem cannot be addressed in such a mathematical approximation frame-up. In practice, for inductive inference purposes one needs at least consistent estimators of
 $\mathstrut{{\mbox{\boldmath $\alpha$}}} $
, and that requires m fixed and n to be much larger than m.
Having said that, a consistent estimator for
 $\mathstrut{{\mbox{\boldmath $\alpha$}}} $
is necessary but not sufficient for reliable inductive inference (Cox and Hinkley Reference Cox and Hinkley1974). In frequentist statistics, one needs error probabilities to assesses the reliability of inference, and neither (5)–(7), nor just a consistent estimator, would provide that. What is missing is a certain probabilistic structure stating the circumstances under which
 $\varepsilon (x_{k},\, m) $
would not vary systematically with
 $k,\, x$
and m, and giving rise to a sampling distribution for
 $\hat{\mathstrut{{\mbox{\boldmath $\alpha$}}} }_{LS}$
; even securing consistency necessitates that
 $E[ x_{k}\cdot \varepsilon (x_{k},\, m) ] \rightarrow 0$
as
 $n\rightarrow \infty $
.
2.4. Gauss's Statistical Modeling Perspective.
Gauss's (Reference Gauss1809) path breaking contribution was to provide such a probabilistic structure by embedding the mathematical approximation formulation into a statistical model. He achieved that by transforming the approximation error term

into a generic (free of
 $x_{k}$
and m) statistical error:

where
 $\mathsf{NIID}(0,\,\sigma ^{2}) $
stands for ‘Normal, Independent and Identically Distributed with mean 0 and variance
 $\sigma ^{2}$
’. The error in (13) is nonsystematic in a probabilistic sense, and free from its dependence on
 $(x_{k},\, m) $
.
Gauss recast the original mathematical approximation into a statistical modeling problem based on what is nowadays called the Gauss Linear model:

What makes his contribution all important from today's vantage point is that the statistical model in (14) provides the probabilistic framework which enables one (i) to assess the validity (statistical adequacy) of the premises for inductive inference, and (ii) to provide relevant error probabilities for assessing the reliability of inference. Indeed, (i) enables one to operationalize when a curve
 $g_{m}(x\mathrm{;}\,\,\hat{\mathstrut{{\mbox{\boldmath $\alpha$}}} }) $
‘captures the regularities in the data’ adequately.
Broadly speaking,
 $g_{m}(x\mathrm{;}\,\,\hat{\mathstrut{{\mbox{\boldmath $\alpha$}}} }) $
is ‘fittest’ when the residuals
 $\{ \hat{\varepsilon }_{k}(x_{k},\, m) =[ y_{k}-g_{m}(x_{k}\mathrm{;}\,\,\hat{\mathstrut{{\mbox{\boldmath $\alpha$}}} }) ],\, k=1,\,\ldots,\, n\} $
are nonsystematic. This way of characterizing statistical adequacy, however, is ambiguous because (a) there are numerous ways one can define ‘nonsystematic’ probabilistically, and (b) securing statistical adequacy by focusing on the error assumptions (e.g.,
 $\varepsilon _{k}\backsim \mathsf{NIID}(0,\,\sigma ^{2}) $
), usually provides an incomplete picture of the task (see Spanos Reference Spanos2000 on ‘veiled’ assumptions). This facet of empirical modeling has, unfortunately, received inadequate attention in the traditional statistics literature, but it constitutes one of the basic tenets of the error-statistical approach in the context of which the ambiguities (a)–(b) are clarified.
3. The Error-Statistical Approach: A Summary.
The term ‘Error-Statistical’ was coined by Mayo (Reference Mayo1996) to denote a modification and extension of the framework for frequentist inductive inference, usually associated with Fisher, Neyman and Pearson. The rationale for coining this new term was to identify a collection of fundamental ideas and concepts associated with these frequentist approaches, quite apart from their philosophical differences, revolving around the central axis of being able to calculate and use error probabilities to assess the reliability of inference. Since it is precisely this key recognition that will allow me to identify the criteria that I argue need to be satisfied, I will employ this notion throughout, understanding that it is the rationale and the difference in emphasis, and not the methods and procedures themselves, that may differ from the traditional discussions.
Modifications and extensions identifying the error-statistical approach are:
i. Emphasizing the learning from data (about the phenomenon of interest) objective of empirical modeling.
ii. Paying due attention to the validity of the premises of induction by securing statistical adequacy, using thorough misspecification testing and respecification.
iii. Emphasizing the central role of error probabilities in assessing the reliability of inference, both pre-data as well as post-data.
iv. Supplementing the original Neyman-Pearson framework with a post-data assessment of inference in the form of severity evaluations (Mayo Reference Mayo1991).
v. Bridging the gap between theory and data using a sequence of interconnected models, theory (primary), structural (experimental), statistical (data) built on two different, but related, sources of information: substantive subject matter and statistical information (chance regularity patterns; see Spanos Reference Spanos1999).
vi. Encouraging thorough probing of the different ways an inductive inference might be in error, by localizing the error probe in the context of the different models in (v); see Mayo Reference Mayo1996.
3.1. Embedding a Structural Model into a Statistical Model.
In the curve fitting problem, the approximating function
 $g_{m}(x\mathrm{;}\,\,\mathstrut{{\mbox{\boldmath $\alpha$}}}) $
provides an example of a structural model,
 $y_{k}=g_{m}(x_{k}\mathrm{;}\,\,\mathstrut{{\mbox{\boldmath $\alpha$}}}) +\varepsilon (x_{k},\, m) $
,
 $k=1,\, 2,\,\ldots $
, whose form is suggested by some substantive subject matter information, including mathematical approximation theory. In this section, the problem of embedding a structural model into a statistical model is discussed in broader generality, in an attempt to shed further light on the problems and issues raised by the dependence of the error
 $\varepsilon (x_{k},\, m) $
on
 $x_{k}$
and m.
In postulating a theory model to explain the behavior of an observable variable, say
 $y_{k}$
, one demarcates the segment of reality to be modeled by selecting the primary influencing factors
 $\mathbf{x}_{k}$
, well aware that there might be numerous other potentially relevant factors
 $\xi _{k}$
(observable and unobservable) influencing the behavior of
 $y_{k}$
. This reasoning is captured by a generic theory model of the form

Indeed, the potential presence of
 $\xi _{k}$
explains the invocation of ceteris paribus clauses. The guiding principle in selecting the variables in
 $\mathbf{x}_{k}$
is to ensure that they collectively account for the systematic behavior of
 $y_{k}$
and the omitted factors
 $\xi _{k}$
represent nonessential disturbing influences, which have only a nonsystematic effect on
 $y_{k}$
. This line of reasoning transforms the theory model (15) into a structural (estimable) model of the form

where
 $h(\cdot) $
denotes the postulated functional form,
 $\phi $
stands for the structural parameters of interest. The structural error term, defined to represent all unmodeled influences,

is viewed as a function of both
 $\mathbf{x}_{k}$
and
 $\xi _{k}$
. For (17) to provide a meaningful model for
 $y_{k}$
the error term needs to be nonsystematic, say a white noise stochastic process
 $\{ \epsilon (\mathbf{x}_{k},\,\xi _{k}),\, k\in \mathstrut{\Bbb N} \} $
satisfying the probabilistic assumptions:

[iv] ensures that the generating mechanism (16) is ‘nearly isolated’ (see Spanos Reference Spanos1995).
The problem with assumptions [i]–[iv] is that they are empirically nontestable, since their verification would require one to show that they hold for all possible values of
 $\mathbf{x}_{k}$
and
 $\xi _{k}$
. To render them testable, one needs to embed the structural model (or material experiment) into a statistical model, a crucial move that usually goes unnoticed. The form and justification of the embedding itself depends crucially on whether the data
 $\{ (y,\,\mathbf{x}_{k}),\, k=1,\,\ldots,\, n\} $
are experimental or observational in nature.
3.2. Experimental Data.
In the case where one can perform experiments, controls and ‘experimental design’ techniques such as randomization and blocking can often be used to ‘isolate’ the phenomenon from the potential effects of
 $\xi _{k}$
by ‘neutralizing’ the uncontrolled factors (see Fisher Reference Fisher1935). The objective is to transform the structural error into a generic (zero mean) IID error process by applying controls and experimental design techniques:

This embeds the structural model (16) into a statistical model of the form

where the statistical error term
 $\varepsilon _{k}$
in (20) is qualitatively very different from the structural error term
 $\epsilon (\mathbf{x}_{k},\,\xi _{k}) $
in (16);
 $\varepsilon _{k}$
is free of
 $(\mathbf{x}_{k},\,\xi _{k}) $
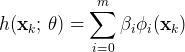
, and its assumptions are rendered empirically testable. A widely used special case of (20), where
 $h(\mathbf{x}_{k}\mathrm{;}\,\,\theta) =\sum_{i=0}^{m}\beta _{i}\phi _{i}(\mathbf{x}_{k}) $
, specifies the Gauss Linear model (see Spanos Reference Spanos1986, Chapter 18).
3.3. Observational Data.
When the observed data
 $\{ \mathbf{z}_{t}\mathrel{\mathop:}= (y_{k},\,\mathbf{x}_{k}),\, k=1,\,\ldots,\, n\} $
are the result of an ongoing actual data generating process, the experimental control and intervention are replaced by judicious conditioning on an appropriate conditioning information set,
 $\mathstrut{\frak D} _{t}$
, to transform the structural error into a generic martingale difference error:

Spanos (Reference Spanos1999) demonstrates how sequential conditioning provides a general way to decompose a stochastic process
 $\{ \mathbf{Z}_{t},\, t\in \mathstrut{\Bbb T} \} $
into a systematic component
 $\mu _{t}$
and a martingale difference process
 $u_{t}$
relative to a conditioning information set
 $\mathstrut{\frak D} _{t}$
. An error martingale difference process
 $\{ (u_{t}\mid \mathstrut{\frak D} _{t}),\, t\in \mathstrut{\Bbb T} \} $
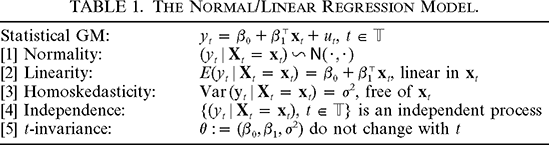
constitutes a more modern form of a white noise process (see Spanos Reference Spanos, Mills and Patterson2006a, Reference Spanos2006b for further details). A widely used special case of (21) is the Normal/Linear Regression model, given in Table 1, where the model assumptions [1]–[5] are specified in terms of the observable process
 $\{ (y_{t}\mid \mathbf{X}_{t}=\mathbf{x}_{t}),\, t\in \mathstrut{\Bbb T} \} $
,
 $\{ (u_{t}\mid \mathbf{X}_{t}=\mathbf{x}_{t}),\, t\in \mathstrut{\Bbb T} \} $
being the corresponding error process.

| Statistical GM: |
 $y_{t}=\beta _{0}+\beta ^{\top }_{1}\mathbf{x}_{t}+u_{t},\,t\in \mathstrut{\Bbb T} $ |
| [1] Normality: |
 $(y_{t}\mid \mathbf{X}_{t}=\mathbf{x}_{t}) \backsim \mathsf{N}(\cdot,\cdot) $ |
| [2] Linearity: |
 $E(y_{t}\mid \mathbf{X}_{t}=\mathbf{x}_{t}) =\beta _{0}+\beta ^{\top }_{1}\mathbf{x}_{t}$
, linear in  $\mathbf{x}_{t}$ |
| [3] Homoskedasticity: |
 $\mathrm{Var}\,(\mathrm{y}\,_{t}\mid \mathbf{X}_{t}=\mathbf{x}_{t}) =\sigma ^{2}$
, free of  $\mathbf{x}_{t}$ |
| [4] Independence: |
 $\{ (y_{t}\mid \mathbf{X}_{t}=\mathbf{x}_{t}),\,t\in \mathstrut{\Bbb T} \} $
is an independent process |
| [5] t-invariance: |
 $\theta \mathrel{\mathop:}= (\beta _{0},\,\beta _{1},\,\sigma ^{2}) $
do not change with t |
3.4. Statistical Induction and the Validity of Its Premises.
A statistical model, denoted by
 $\mathstrut{\cal M} _{\theta }(\mathbf{y}) $
(see Table 1), plays a central role in statistical induction by providing the premises of statistical induction when viewed in conjunction with the observed data
 $\mathbf{y}_{0}\mathrel{\mathop:}= (y_{1},\, y_{2},\,\ldots,\, y_{n}) $
. Statistical adequacy is tantamount to the claim that data
 $\mathbf{y}_{0}$
constitute a ‘truly typical realization’ of the stochastic mechanism described by
 $\mathstrut{\cal M} _{\theta }(\mathbf{y}) $
. In practice, statistical adequacy is assessed using thorough Misspecification (M-S) testing: probing for departures from the probabilistic assumptions comprising
 $\mathstrut{\cal M} _{\theta }(\mathbf{y}) $
vis-à-vis data
 $\mathbf{y}_{0}$
(Spanos Reference Spanos1999).
An important provision of the error-statistical approach for securing statistical adequacy is the specification of a statistical model in terms of a complete set of probabilistic assumptions [1]–[5] (see Table 1) pertaining to the observable stochastic process
 $\{ (y_{t}\mid \mathbf{X}_{t}=\mathbf{x}_{t}),\, t\in \mathstrut{\Bbb T} \} $
(Spanos Reference Spanos2000). This proviso is designed to deal with the ambiguity of defining statistical adequacy in terms of nonsystematic residuals. For instance, the assumptions [1]–[5] define precisely what is meant by ‘nonsystematic’, and also provide a unequivocal way to secure statistical adequacy by rendering all model assumptions directly empirically testable. Statistical model specifications in terms of error assumptions are often incomplete, and the assumptions are not directly verifiable because the error process
 $\{ \varepsilon _{k},\, k\in \mathstrut{\Bbb T} \} $
is unobservable. For instance, the error assumptions
 $\varepsilon _{k}\backsim \mathsf{NIID}(0,\,\sigma ^{2}) $
for the Gauss linear model, when recast in terms of the observable process
 $\{ y_{k},\, k\in \mathstrut{\Bbb T} \} $
, take a form similar to assumptions [1]–[5]; but in terms of
 $D(y_{k}\mathrm{;}\,\,\theta) $
with
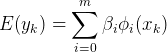 $E(y_{k}) =\sum_{i=0}^{m}\beta _{i}\phi _{i}(x_{k}) $
(Spanos Reference Spanos2006b). In addition, this way of specifying statistical models obviates the need to invoke a priori presuppositions like the ‘uniformity of nature’ (Salmon Reference Salmon1967). Indeed, the invariant features of the phenomenon of interest are reflected in the t-invariant parameters (see assumption [5]), rendering it empirically verifiable vis-à-vis data
 $\mathbf{y}_{0}$
.
It is well known in statistics that the reliability of any inference procedure (estimation, testing and prediction) depends crucially on the validity of the premises. Taking the latter as given, the optimality of inference procedures in frequentist statistics is defined in terms of their capacity to give rise to valid inferences, which is assessed in terms of the associated error probabilities, that is, how often these procedures lead to erroneous inferences (Mayo Reference Mayo1996). In frequentist statistics, the unreliability of inference is reflected in the difference between the nominal error probabilities, derived under the assumption of valid premises, and the actual error probabilities, derived by taking into consideration the departure(s) from the model assumptions.
4. The Error-Statistical Approach and Curve Fitting.
In the context of the error-statistical approach the fittest curve
 $g_{m}(x_{k}\mathrm{;}\,\,\hat{\mathstrut{{\mbox{\boldmath $\alpha$}}} }) $
is the one that, when embedded in a statistical model, turns out to be statistical adequate: its probabilistic assumptions (Table 1) are valid for the data in question. The validity of these assumptions operationalizes when a curve captures the ‘regularities’ in the data and formalizes the intuitive notion of the residuals containing systematic information.
The reliability of inference in the context of the error-statistical approach is achievable because (i) the premises of inductive inference are rendered empirically testable, and (ii) statistically adequate premises ensure that the nominal error probabilities approximate closely the actual error probabilities (Spanos and McGuirk Reference Spanos and McGuirk2001).
Adopting the statistical adequacy criterion for the choice of the fittest curve addresses the reliability of inference problem, but also elucidates several issues associated with the curve fitting problem, including goodness-of-fit, predictive accuracy, simplicity, overfitting and underdetermination. In principle, statistical adequacy provides a much more stringent criterion for choosing the fittest curve than the traditional tradeoff between goodness-of-fit and simplicity because it requires one to test thoroughly all model assumptions and detect no departures. Securing statistical adequacy is often a daunting task, because probabilistic assumptions such as the t-invariance of the statistical parameters (see [5] in Table 1) are particularly difficult to satisfy in practice (Spanos Reference Spanos1999).
High degree of goodness-of-fit is neither necessary nor sufficient for statistical adequacy, although some degree of fit is desirable for the precision (not the reliability) of inference. On the other hand, statistical adequacy is necessary for goodness-of-fit measures, such as the
 $R^{2}$
and the estimated log-likelihood function
 $\mathrm{ln}\,L(\hat{\theta }\mathrm{;}\,\,\mathbf{y}_{0}) $
, to be statistically meaningful (Spanos Reference Spanos2000). Viewing predictive accuracy in terms of ‘small’ prediction error is nothing more than goodness-of-fit projected beyond the observation period. As such, it suffers from the same weaknesses: prediction errors, like the residuals, can vary systematically over the prediction period.
A statistically adequate curve
 $g_{m}(x\mathrm{;}\,\,\hat{\mathstrut{{\mbox{\boldmath $\alpha$}}} }) $
captures all the systematic (recurring) information in the data, and it gives rise to nonsystematic prediction errors. Indeed, such a curve determines what regularities in the data are projectible (Skyrms Reference Skyrms2000), because the model assumptions capture precisely such recurring regularities from three broad categories: distributional, dependence, and heterogeneity (Spanos Reference Spanos1999). A statistically adequate model will give rise to systematic prediction errors only when the invariant structure of the underlying data generating process change between the observation and prediction periods. In such a case, one can use this very discrepancy to diagnose changes in the invariance structure. In contrast, a statistically inadequate curve
 $g_{m}(x\mathrm{;}\,\,\hat{a}) $
is likely to overpredict or underpredict, rendering it weak on predictive grounds. This is contrary to the traditional view, which usually invokes simplicity as the way to ensure predictive accuracy by counterbalancing the danger of overfitting.
What is the role of simplicity in the context of the error-statistical approach? The approximating function
 $g_{m}(x\mathrm{;}\,\,\mathstrut{{\mbox{\boldmath $\alpha$}}}) $
is chosen to be as elaborate as necessary to ensure statistical adequacy, but no more elaborate. This is in the spirit of Einstein's 1933 often paraphrased comment that “it is the grand object of all theory to make these irreducible elements as simple and as few in number as possible, without having to renounce the adequate representation of any empirical content whatever” (see Einstein Reference Einstein1954, 272).
A simple but statistically misspecified model is of little value for inference purposes, because its inadequacy will give rise to unreliable inferences; the nominal and actual error probabilities will differ. A simple model, however, might be of some value in probing for possible misspecifications and using the results to respecify.
Statistical adequacy provides an effective safeguard against overfitting. Overfitting, such as the unnecessary inclusion of higher degree polynomials, or additional lags, is likely to give rise to systematic residuals (Spanos Reference Spanos1986, 479). One can guard against such overfitting by thorough M-S testing (Mayo and Spanos Reference Mayo and Spanos2004).
In a related paper, Spanos (Reference Spanos2006c) argues that the AIC-type model selection procedures constitute a modest variation on the mathematical approximation frame-up with the norm (goodness-of-fit measure) defined by

Despite the fact that the likelihood function presupposes a certain probabilistic structure, the capacity of AIC-type procedures to ensure the reliability of inference is severely impaired, because these probabilistic assumptions are taken at face value; their validity is not assessed. Indeed, assessing the validity of these assumptions to secure statistical adequacy, would render these model selection procedures redundant; finding a statistically adequate model determines the fittest curve. Be that as it may, when these procedures are viewed in the context of the above discusssion, they raise two distinct concerns: (a) they require starting with a family of models assumed to contain the correct model, without supplying any criteria for model validation; and (b) even within an assumed family of models, satisfying AIC-type criteria does not ensure fulfilling requirements of low error probabilities for any inferences reached.
When the fittest curve is selected on statistical adequacy grounds it becomes clear that the problem of underdetermination is unlikely to be as pervasive as often claimed. Indeed, finding a single statistically adequate model for a particular data is often a daunting task, because probabilistic assumptions such as the t-invariance of the statistical parameters ([5] in Table 1), are particularly difficult to satisfy in practice (Spanos Reference Spanos1999). Empirical equivalence on statistical adequacy grounds is rare but possible, raising the prospect of comparing such models using additional criteria including substantive adequacy: the validity of the structural model (confounding factors, causal claims, external validity, etc.) vis-à-vis the phenomenon of interest. As argued in Spanos Reference Spanos2006b, statistical adequacy is necessary, but not sufficient, for ensuring substantive adequacy. To exemplify the above error-statistical assertions, two widely discussed models of planetary motion, Kepler's and Ptolemy's, are compared on empirical grounds.
4.1. Kepler's Model of Planetary Motion.
Kepler's model for the elliptical motion of Mars turned out to be a real empirical regularity because the statistical model, in the context of which the structural model was embedded, can be shown to be statistically adequate.
Consider Kepler's first law of motion in the form of the structural model

where
 $y\mathrel{\mathop:}= (1/ r) $
,
 $x\mathrel{\mathop:}= \mathrm{cos}\,\vartheta $
,
 $r=$
the distance of the planet from the sun, and
 $\vartheta =$
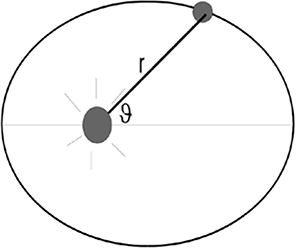
the angle between the line joining the sun and the planet and the principal axis of the ellipse (see Figure 1).
Elliptical motion of planets.

It is important to emphasize that historically this law was originally proposed by Kepler as just an empirical regularity that he ‘deduced’ from Brahe's data. Newton provided a structural interpretation to Kepler's first law using his law of universal gravitation
 $F=[ G(m\cdot M) / r^{2}] $
, where F is the force of attraction between two bodies of mass m (planet) and M (sun); G is a constant of gravitational attraction (Linton Reference Linton2004). This law gave a clear structural interpretation to the parameters:
 $\mathstrut{{\mbox{\boldmath $\alpha$}}} _{0}=MG/ 4\kappa ^{2}$
, where κ denotes Kepler's constant, and
 $\mathstrut{{\mbox{\boldmath $\alpha$}}} _{1}=[ (1/ d) -\mathstrut{{\mbox{\boldmath $\alpha$}}} _{0}] $
, where d is the shortest distance between the planet and the sun.
Moreover, the error term
 $\epsilon (x_{k},\,\xi _{k}) $
also enjoys a structural interpretation in the form of ‘deviations’ from the elliptic motion due to potential measurement errors as well as other unmodeled effects. Hence, the white noise error assumptions [i]–[iv] in (18) will be inappropriate in cases where (i) the data suffer from ‘systematic’ observation errors; (ii) the third body problem effect is significant; and (iii) the general relativity terms turn out to be important.
Embedding (23) into the Normal/Linear Regression model (Table 1), and estimating it using Kepler's original data (
 $n=28$
) yields

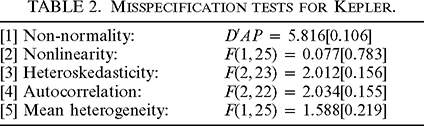
The misspecification tests (Spanos and McGuirk Reference Spanos and McGuirk2001) reported in Table 2 indicate that the estimated model is statistically adequate; the p-values in square brackets indicate no significant departure from assumptions [1]–[5].

| [1] Non-normality: |
 $D^{\prime }AP=5.816[ 0.106] $ |
| [2] Nonlinearity: |
 $F(1,\, 25) =0.077[ 0.783] $ |
| [3] Heteroskedasticity: |
 $F(2,\, 23) =2.012[ 0.156] $ |
| [4] Autocorrelation: |
 $F(2,\, 22) =2.034[ 0.155] $ |
| [5] Mean heterogeneity: |
 $F(1,\, 25) =1.588[ 0.219] $ |
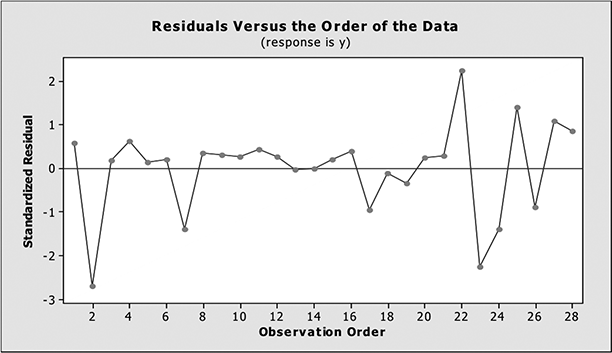
A less formal but more intuitive verification of the statistical adequacy of (24) is given by the residual plot in Figure 2, which exhibits no obvious departures from a typical realization of a normal, white noise process.
Residuals from the Kepler regression.

4.2. Ptolemy's Model of Planetary Motion.
The prevailing view in philosophy of science is that Ptolemy's geocentric model, despite being false, can ‘save the phenomena’ and yield highly accurate predictions. Indeed, the argument goes, one would be hard pressed to make a case in favor of Kepler's model and against the Ptolemaic model solely on empirical grounds. Hence, one needs to use other internal and external virtues (Laudan Reference Laudan1977). This view is questioned by showing that the Ptolemaic model does not account for the regularities in the data; it is shown to be statistically inadequate—in contrast to Kepler's model.
The Ptolemaic model of the motion of an outer planet based on a single epicycle, with radius a rolling on the circumference of a deferent of radius A and an equant of distance c, can be parameterized in polar coordinates by the following model:

where
 $d_{t}$
denotes the distance of the planet from the earth,
 $\varphi _{t}$
the angular distance measured eastward along the celestial equator from the equinox, and
 $\delta =A/ a$
. Ptolemy's model does not enjoy a structural interpretation, but one can interpret the coefficients
 $(\mathstrut{{\mbox{\boldmath $\alpha$}}} _{0},\,\ldots,\,\mathstrut{{\mbox{\boldmath $\alpha$}}} _{5}) $
in terms of the underlying geometry of the motion (Linton Reference Linton2004).
The data used are daily geocentric observations for Mars (from the U.S. Naval Observatory) of sample size
 $T=687$
, chosen to ensure a full cycle for Mars. Estimating (25) by embedding it into the Normal/Linear Regression model (Table 1) yields

with
 $R^{2}=0.992$
,
 $s=0.21998$
, and
 $T=687$
.
 $\delta =1.3$
was chosen on goodness-of-fit grounds; Ptolemy assumed
 $A/ a=1.5$
.
A cursory look at the standardized residuals (Figure 3) confirms the excellent goodness-of-fit (
 $R^{2}=0.992$
)—none of the residuals lies outside an interval of 2.5 standard deviations. Despite being relatively small, a closer look reveals that the residuals exhibit systematic statistical information. The cycles exhibited by the residuals plot reflect a departure from the independence assumption (Spanos Reference Spanos1999, Chapter 5). These patterns are discernible using analogical reasoning based on comparing Figure 3 with a t-plot of a typical (zero mean) NIID realization given in Figure 4. It is interesting to note that Babb's (Reference Babb1977) plot of the residuals from the Ptolemy model for Mars, ordered according to the angle of observation
 $(0^{\circ }-360^{\circ }) $
, looks very similar to Figure 3.
t-plot of the residuals from (26).

t-plot of a Normal white noise realization.

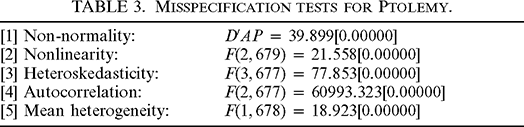
The various departures from assumptions [1]–[5] are formally exposed using the misspecification tests shown in Table 3. The tiny p-values in square brackets indicate strong departures from all the statistical assumptions—the estimated Ptolemy model is seriously statistically misspecified.

| [1] Non-normality: |
 $D^{\prime }AP=39.899[ 0.00000] $ |
| [2] Nonlinearity: |
 $F(2,\, 679) =21.558[ 0.00000] $ |
| [3] Heteroskedasticity: |
 $F(3,\, 677) =77.853[ 0.00000] $ |
| [4] Autocorrelation: |
 $F(2,\, 677) =60993.323[ 0.00000] $ |
| [5] Mean heterogeneity: |
 $F(1,\, 678) =18.923[ 0.00000] $ |
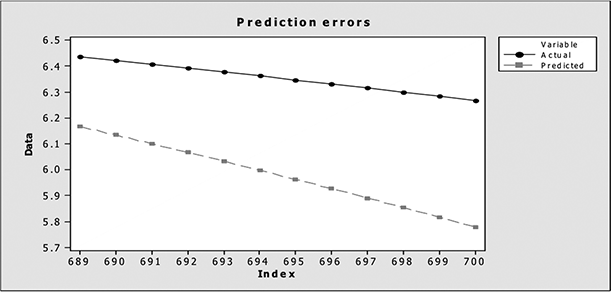
The Ptolemaic model has been widely praised as yielding highly accurate predictions. To assess that claim, the estimated model in (26) was used to predict the next 13 observations (688–700). On the basis of Theil's coefficient,

where
 $y_{t}$
is the actual value and
 $\hat{y}_{t}$
is the predicted value. Its predictive accuracy seems excellent:
 $0\leq U\leq 1$
, the closer to zero the better—see Spanos Reference Spanos1986, 405. However, the plot of the actual and fitted values in Figure 5 reveals a different picture: the predictive accuracy of the Ptolemaic model is problematic since it underpredicts systematically, a symptom of statistical inadequacy.
Actual vs. predicted data for Ptolemy.

The discussion in Section 2 explains the above empirical results associated with the Ptolemaic model as a classic example of how curve fitting, as a mathematical approximation method, would usually give rise to systematic residuals (and prediction errors), irrespective of the goodness-of-fit. In this case, the use of epicycles is tantamount to approximating a periodic function
 $h(x) $
using orthogonal trigonometric polynomials; that is,
 $g_{m}(x\mathrm{;}\,\,\theta) $
takes the general form (Isaacson and Keller Reference Isaacson and Keller1994)

As first noted by Bohr (Reference Bohr1949), every additional epicycle increases m to
 $m+1$
.
5. Summary and Conclusions.
The current perspective dominating discussions on curve fitting is that of mathematical approximation theory, which provides an inadequate framework for reliable inductive inference. In particular, it provides no adequate basis for (i) testable assumptions to ensure the validity of the premises for inductive inference and (ii) dependably ascertainable error probabilities to assess the reliability of inference. Both (i) and (ii) are attainable in the context of the error-statistical approach, by embedding the approximation problem into a statistical model,
 $\mathstrut{\cal M} _{\theta }(\mathbf{y}) $
, whose premises are empirically testable, and selecting the ‘fittest’ curve
 $g_{m}(x\mathrm{;}\,\,\hat{\theta }) $
to be one that gives rise to a statistically adequate model—its probabilistic assumptions are valid for the data in question—formalizing the conditions under which the fitted curve captures the ‘regularities’ in data,
 $\mathbf{y}_{0}$
, adequately. These error-statistical assertions are affirmed by demonstrating that Kepler's law of planetary motion gives rise to a statistically adequate model, but Ptolemy's epicycles model does not. Indeed, the latter constitutes an example of a ‘best’ curve, in a mathematical approximation sense, that does not account for the regularities in the data; it yields systematic residuals.