I. INTRODUCTION
Thermoelectric materials have been getting more and more extensively used in many cooling and power generating applications, such as in microelectronic devices, waste heat harvesting, etc.Reference Slack and Hussain1, Reference Vining2 Significant research has been focused on further improving the comprehensive properties of thermoelectric materials to obtain higher conversion efficiency. One of the adoptable ways to achieve this purpose is to fabricate p- or n-type semiconductors by doping.Reference Xu, Jiang, Zhang, Wu and Niu3–Reference Xu, Xu and Ge7 Particularly, in recent years, the influence of rare earth doping on thermoelectric materials has been extensively studied.Reference Fuda and Sugiyama8, Reference Nong, Liu and Ohtaki9 For example, the power factor of the Dy-substituted NaxCo2O4 sample was found to be remarkably higher than that of the nonsubstituted sample due to the enhancement of electrical conductivity.Reference Ito, Nagira and Hara10 The carrier concentration decreased with the increasing amount of Gd dopant in n-type Bi2Te3 alloys. The dopant, Gd, therefore, was considered as an acceptor.Reference Ren, Wu, Zhang and Xu11 The dopants of rare earth metals, Dy and Er, could improve the thermoelectric properties of MyCoSb3 by enlarging the lattice parameters.Reference Xu, Niu, Zhang and Ge12 SalesReference Sales13 showed that the thermal conductivity at room temperature was lowered by the presence of the rare earth rattlers filled in skutterudite structures.
Among the various kinds of thermoelectric materials, SiGe alloys, used in thermoelectric power generators for space flights,Reference Rowe14 have been attracting much attention. SiGe alloys were considered as potential thermoelectric materials for their wide energy gaps and low thermal conductivities. The physical properties were found to be closely dependent on the compositions of the alloys.Reference Xu, Xu and Ge6 Hence, composition adjustment could be practiced in an attempt to manipulate the performances of SiGe alloys.Reference Abeies, Beers, Cody and Dismukes15 Conventional dopants (B, P, GaP, AlP, etc) were reported to be useful in tailoring the figure of merit (ZT).Reference Min and Rowe16–Reference Fleurial, Caillat and Borshchevsky20 For example, the p-type SiGe alloys applied to radioisotope thermoelectric generators (RTGs) were reported to have a peak ZT ∼0.5 (at 850 °C).Reference Dismukes, Ekstrom, Steigmeier, Kudman and Beers4 The peak of ZT has reached 0.95 (at 800 °C) in p-type nanostructured SiGe bulk alloys.Reference Joshi, Lee and Lan21 Being the promising dopant, rare earth, has frequently been reported to play an important role in enhancing ZT of other thermoelectric materials, but less so in SiGe alloys. Gibbons’ group found that the deep-donor-like centers most probably were produced by rare earth impurities in Tm- and Nd-doped Si crystals.Reference Gibbons, Moll and Meyer22 The Tm and Yb dopants exhibited as deep donors in the Si lattice, but were of little use due to the low solubilities.Reference Sclar23 It is therefore believed that, adding rare earth elements to the bulk SiGe alloys could have similar effects on improving their comprehensive properties. The objective of this study is to investigate the effects of small amount of Er addition on the transport properties of Si80Ge20B0.6 alloys, among which particular focus was placed on its influences on the electrical performance since significant enhancement of the carrier concentration was observed.
Spark plasma sintering (SPS) was lately believed to be a reliable processing technique in the rapid fabrication of many bulk samples. SPS-fabricated thermoelectric materials also exhibited enhanced properties as compared to those prepared by conventional methods.Reference Jiang, Chen, Bai and Yao24–Reference Jiang, Chen, Bai, Yao and Wang26 The samples fabricated and characterized in this study were all fabricated with optimized SPS parameters.
II. EXPERIMENTAL PROCEDURE
Silicon (Si) bulk and germanium (Ge) bulk with purity of 99.999 wt% were used as raw materials. Both the Si and Ge bulks were grinded in a ball milling jar. Next, boron (B) powder with purity of 99 wt% and Er powder with purity of 99.5 wt% were added into the mixture in a glove box with an argon atmosphere to obtain a nominal proportion of Si80Ge20B0.6Erx (x = 0, 0.075, 0.085, and 0.125). Then, the whole mixture was put in the ball milling jar and milled for 50 h to obtain alloyed powders. After that, the mechanically prepared powders were put in graphite dies and sintered at temperatures of 1100–1150 °C under a pressure of 30 MPa by SPS. The resulting compacts were 20 mm in diameter. The relative densities of the batch of samples are in the range of 97–98.6%.
The samples were characterized by x-ray diffraction (XRD) and x-ray fluorescence (XRF). X-ray photoelectron spectroscopy (XPS) was utilized to analyze the chemical state of SiGe alloy with 0.4 at.%Er addition. Because the test limitation of the x-ray photoelectron spectrometer is 0.1%, the sample with 0.4% Er addition was applied for the test to obtain a clear result. It should be noticed that all samples were fabricated using a similar process sequence. The XPS measurement was performed by a ULVAC PHI Quantera SXM x-ray photoelectron spectrometer (ULVAC Inc., Chigasaki, Japan) using a monochromatic Al Kα (1486.6 eV) radiation source. The C1s peak at 284.6 eV was taken as the internal standard. The samples applied for XPS measurement were cut from compacts and were polished. Electrical conductivities were measured by four-probe technique from 400 to 900 K using ULVAC ZEM-2 (ULVAC Inc.). The thermoelectric electromotive force E was measured between both ends of the sample, as published earlier.Reference Xu, Xu, Liu and Ge27 The Seebeck coefficients were determined by ΔE/ΔT. Thin slices of 5 × 5 × 1 mm3 were cut from the samples for Hall effect measurement. The carrier mobility was determined by R H/ρ, where R H was Hall coefficient and ρ was electrical resistance. The carrier concentration was calculated by 1/(R H × 1.6 × 10⁻¹⁹). To measure the thermal diffusion coefficient (λ) and specific heat (C p), the laser flash method was used (ULVAC TC-7000; ULVAC Inc.). The thermal conductivity (κ) was computed by κ = C pλd, where d was the density of the compact tested on Archimedes principle.
III. RESULTS AND DISCUSSION
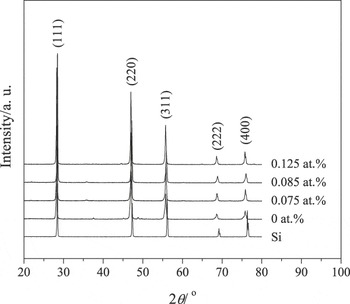
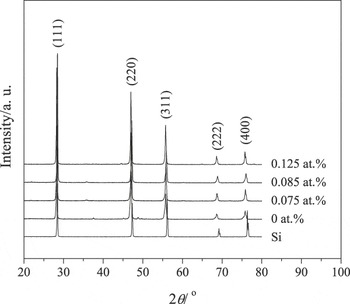
Figure 1 shows the XRD patterns for samples after SPS. The patterns confirm that every sample is in a single phase. The peak positions of each sample deviate from the corresponding peak positions of Si. Such deviation suggests that part of the Si atoms have been substituted by Ge atoms. The mixture has been converted to SiGe alloy during the ball milling and SPS fabrication process. Neither Er peaks nor Er-containing compound peaks were found from the XRD analysis because of the too little amount of Er addition.
X-ray diffraction patterns for samples with different amounts of Er addition in comparison to Si.
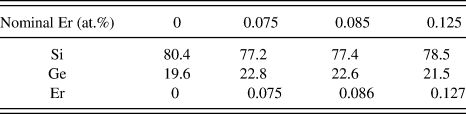
The actual elemental contents of the samples after SPS are similar to the nominal composition, as listed in Table I. The discrepancy in the content of Si may be attributed to the sticking of Si powder to the inner wall of the milling jar.
Elemental content for samples after spark plasma sintering (SPS).
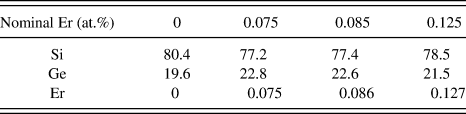
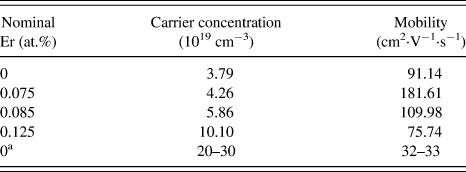
Table II presents the carrier concentration and mobility (at 300 K) for samples after SPS fabrication in comparison to those reported in a literature. As can clearly be seen, the carrier concentrations tend to increase with the increasing amount of Er addition. However, the mobility goes down with higher content of Er addition, or, in other words, with higher carrier concentration. It is considered that such trends are primarily caused by the strong scattering of carriers. Furthermore, when the carrier concentration reaches a certain high value, a number of carriers will transfer to the energy band with higher energy levels, which leads to low mobility due to the intervalley carrier scattering.Reference Xu, Xu, Liu and Ge27 Bajgar et al.Reference Bajgar, Masters, Scoville and Vandersande28 have presented that optimum carrier concentrations are in the range of 2 × 10²⁰–3 × 1020 cm−3 at room temperature while Hall mobility values are close to 32–33 cm2·V−1·s−1 for hot-pressed Si80Ge20 alloys containing 0.24–3.0 at.%B. The mobility values for the samples in this study are higher than those in Ref. Reference Bajgar, Masters, Scoville and Vandersande28 as a result of the lower carrier concentrations.
Carrier concentration for samples after SPS in comparison to the values in the literature (at 300 K).
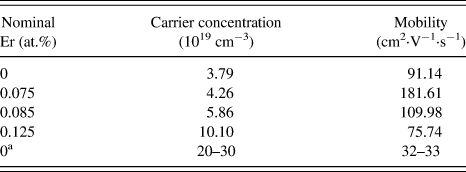
a The 0.5 at.%B-doped Si80Ge20 alloys heated 61 h at 1270 °C (Ref. Reference Bajgar, Masters, Scoville and Vandersande28).
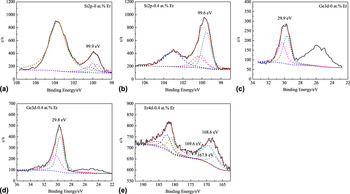
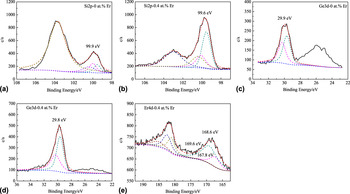
Figures 2(a)–2(e) show the XPS narrow spectra (solid line) of Si2p [Figs. 2(a) and 2(b)], Ge3d [Figs. 2(c) and 2(d)], and Er4d [Fig. 2(e)] for the samples containing 0 at.% and 0.4 at.%Er addition, respectively. It can be observed that the Si2p peaks of the samples with and without Er addition are located at 99.6 eV and 99.9 eV, respectively. The binding energy of the sample with Er is 0.3 eV less than that of the one without Er addition, which seems to indicate that the bonding between nucleus and inner electron has getting looser. The binding energy of Ge3d of the sample (0.4 at.%Er) is about 0.1 eV less than that of 29.9 eV of the sample (0 at.%Er) as shown in Figs. 3(c) and 3(d). The difference energy, 0.1 eV, is within the limits of experimental error. The binding energy of Er4d peak is about 168.6 eV as shown in Fig. 3(e). Both the binding energies of Er4d5 and Er4d3 of the sample are 0.5 eV more than those of elemental Er, which indicates that the elemental Er has ionized during the fabricating process. A reaction performed by SiGe and Er will create compounds with different composition. From the Er–Si phase diagram,Reference Luzan, Listovnichii, Buyanov and Martsenyuk29β-ErSi2-b forms when the content of Si is over 63.5 at.%, where the value of b is ∼0.33. The Er atoms donate electrons and Si atoms accept electrons in the reaction. According to the results of XPS, the decrease of binding energy of Si2p may be because the Si atoms have acquired electrons from Er atoms. The foreign electrons will contribute to the enhancement of Fermi level. In heavily doped semiconductors, the Fermi level is close to or gets into the conduction band (valance band), which contributes to the degeneracy of energy level. And a part of impurity will donate holes in degenerate semiconductors.Reference Li, Tu, Zheng, Deng and Luo30 There is a slight possibility that the enhancement of Fermi level will be beneficial to increase the amount of holes, as reflected in a corresponding increase in carrier concentration.
The x-ray photoelectron spectroscopy images of (a, b) Si2p, (c, d) Ge3d, and (e) Er4d for samples containing 0 at.% and 0.4 at.%Er addition.
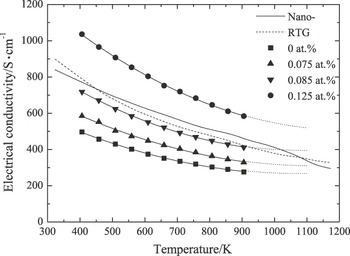
Temperature dependence of electrical conductivity for samples with 0, 0.075, 0.085, and 0.125 at.% Er addition (solid squares, solid triangles, inverted triangles, and circles) in comparison to a direct current (dc) hot-pressed nanostructured p-type Si80Ge20 alloy sample (solid line) and p-type SiGe bulk alloy sample used in radioisotope thermoelectric generators (RTGs) (dashed line) for space flights.
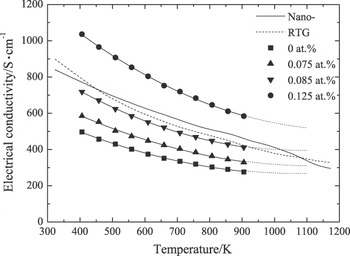
Figure 3 shows the temperature dependence of electrical conductivity for samples with different amounts of Er addition in comparison to those of a direct current (dc) hot-pressed nanostructured p-type Si80Ge20 alloy sampleReference Joshi, Lee and Lan21 (solid line) and a p-type SiGe bulk alloy sampleReference Dismukes, Ekstrom, Steigmeier, Kudman and Beers4 used in RTGs (dashed line) for space flights. The electrical conductivity is a function of carrier concentration, mobility, and temperature.Reference Hutner and Rittner31 It is clear that the electrical conductivities for all samples decreased along with increasing temperature. The results exhibit the same trend as those reported in former literaturesReference Dismukes, Ekstrom, Steigmeier, Kudman and Beers4, Reference Joshi, Lee and Lan21 (solid and dashed lines in Fig. 3). The vibration of lattice will be intensified at elevated temperature, which increases the scattering of carriers, thus appearing as the decreasing trend of electrical conductivity. The values of electrical conductivity go up with more addition of Er, which reflected the same tendency in carrier concentration since the electrical conductivity is positive over the carrier concentration.Reference Bhandari and Rowe32, Reference Rowe and Williams33 And the electrical conductivity at 0.125 at.%Er reaches a maximum value of over 1000 S·cm−1 at 400 K. It is much higher than those of the nanostructured alloy and the RTG sample.
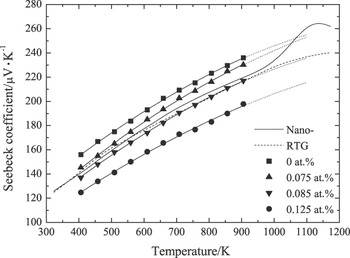
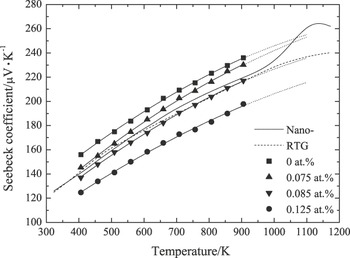
The temperature dependence of Seebeck coefficient for the same batch of samples is illustrated in Fig. 4. The samples can be identified as p-type semiconductors from the positive values of Seebeck coefficient. It is known that the Seebeck coefficient is a function of carrier concentration, mobility, and temperature.Reference Hutner and Rittner31 Generally, the values of Seebeck coefficient decrease with the increasing carrier concentration. It is found that the increase in carrier concentration with the increasing amount of Er addition in the alloys is reflected in a corresponding decline in Seebeck coefficient. The values of all samples fall in the range of 125–235 μV·K−1 and are comparable to those of the nanostructure alloy and the RTG sample.
Variable temperature Seebeck coefficient for samples with 0, 0.075, 0.085, and 0.125 at.%Er addition (solid squares, solid triangles, inverted triangles, and circles) in comparison to a dc hot-pressed nanostructured p-type Si80Ge20 alloy sample (solid line) and p-type SiGe bulk alloy sample used in RTGs (dashed line) for space flights.
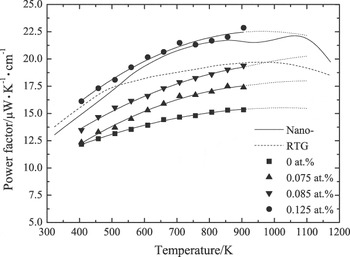
The power factor calculated by electrical conductivity and Seebeck coefficient is shown in Fig. 5. With higher temperature, the power factor tends to increase. Additionally, in the whole temperature range, the power factors show upward tendency with increasing content of Er addition. The maximum value reaches about 22.8 μW·K−1·cm−1 at 900 K with 0.125 at.%Er addition and is about 50% improvement over that of the pristine sample in this study. Such a power factor value is slightly higher than that of the nanostructured alloy and much higher than that of the RTG sample. Nevertheless, it is obvious that all samples, excluding 0.125 at.%Er-added sample, perform more poorly than the nanostructured alloy and RTG sample. This may be the result of the lower electrical conductivity.
Variable temperature power factor for samples with 0, 0.075, 0.085, and 0.125 at.%Er addition (solid squares, solid triangles, inverted triangles, and circles) in comparison to a dc hot-pressed nanostructured p-type Si80Ge20 alloy sample (solid line) and p-type SiGe bulk alloy sample used in RTGs (dashed line) for space flights.
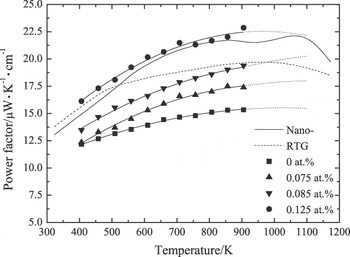
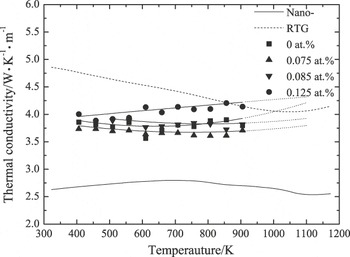
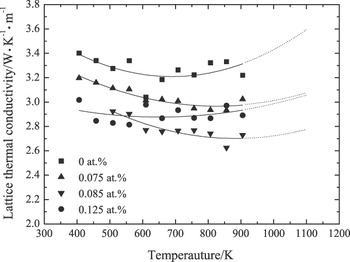
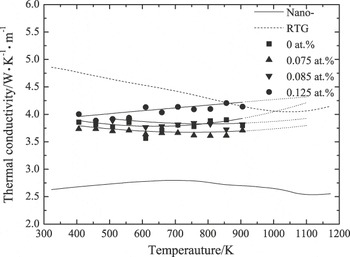
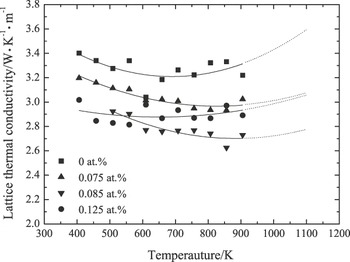
Figure 6 represents the variation of thermal conductivity as a function of temperature. The thermal conductivities of all samples are leveling off in the test range. The values of thermal conductivities are less than that of RTG sample below 850 K, but are significantly greater than that of nanostructured sample over the whole temperature range. The sample with 0.125 at.%Er addition has the highest value almost between 3.8 and 4.2 W·K−1·m−1. It is well known that the total thermal conductivity (κ total) can be expressed as κ total = κ ph + κ e, where the κ ph and κ e are lattice and electronic contribution, respectively. κ e can be calculated by the Wiedemann–Franz law, expressed as κ e = LσT, where L is the Lorenz number and σ is the electrical conductivity.Reference Nong, Liu and Ohtaki9 The temperature dependence of lattice thermal conductivity is plotted in Fig. 7. It is clear from Fig. 7 that the values decrease with the increasing amount of Er addition, in other words, with the increasing carrier concentration. Consequently, the phonons may be more strongly scattered by impurities and carriers. This may be possibly a major cause of the thermal conductivity reduction. Similar effects in doped Si samples were well documented.Reference Slack34, Reference Meddins and Parrott35
Temperature dependence of thermal conductivity for samples with 0, 0.075, 0.085, and 0.125 at.%Er addition (solid squares, solid triangles, inverted triangles, and circles) in comparison to a dc hot-pressed nanostructured p-type Si80Ge20 alloy sample (solid line) and p-type SiGe bulk alloy sample used in RTGs (dashed line) for space flights.
Temperature dependence of lattice thermal conductivity for samples with 0, 0.075, 0.085, and 0.125 at.%Er addition (solid squares, solid triangles, inverted triangles, and circles).
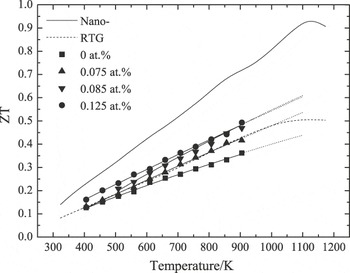
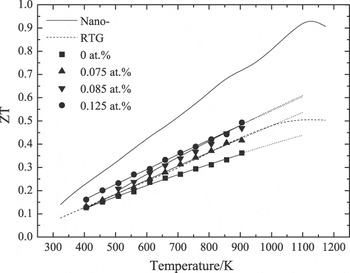
From the values of power factor and thermal conductivity, the ZT is calculated and illustrated in Fig. 8. As previously mentioned, the values of power factor of three samples are lower than those of the nanostructured alloy and RTG sample. It is well known that in SiGe alloys, dopant precipitation occurs below 600 °C (873 K) and hence low-temperature properties depend on the thermal history of the samples.Reference Joshi, Lee and Lan21 More significantly, the thermal conductivities of the Er-added samples are lower than that of the RTG sample (Fig. 6) at all tested temperatures, which brings about the ZTs that are above or equal to that of RTG sample (Fig. 8). However the values of ZT of all samples are below that of nanostructured sample due to the undesirable thermal conductivities (Fig. 6). It is noticeable that the Er-added samples perform better than the pristine sample. The ZT curves of 0.085 at.% and 0.125 at.% are practically on top of each other at elevated temperatures. Therefore, the optimal ratio of Er addition is actually in the range of 0.085–0.125 at.%. The maximum value is almost 0.5 at 900 K in this study.
Temperature dependence of figure of merit for samples with 0, 0.075, 0.085, and 0.125 at.%Er addition (solid squares, solid triangles, inverted triangles, and circles) in comparison to a dc hot-pressed nanostructured p-type Si80Ge20 alloy sample (solid line) and p-type SiGe bulk alloy sample used in RTGs (dashed line) for space flights.
IV. CONCLUSIONS
Effects of minute amount of Er addition on electrical properties of Si80Ge20B0.6 alloys were investigated. The samples with and without Er addition were characterized by the XPS technique. Seebeck coefficient, power factor, and ZT as functions of temperature were also measured and compared with different contents of Er addition. According to this preliminary study, the major conclusions are summarized as follows:
(i) The carrier concentration tends to increase, whereas the mobility goes down with the increasing amount of Er addition.
(ii) The Er4d peak is located at 168.6 eV. Both the binding energies of Er4d5 and Er4d3 of the sample are 0.5 eV larger than those of elemental Er, which may indicate that the elemental Er addition has ionized during the fabricating process. The binding energy of Si2p of the sample with Er addition is 0.3 eV less than that of the pristine sample. The decrease of binding energy of Si2p may be because the Si atoms have acquired electrons from Er atoms. Additional valence electrons contribute to the increase of absolute value of repulsive potential between the valence electrons and the inner electrons.
(iii) The foreign electrons acquired from Er atoms may contribute to the enhancement of Fermi level. For the degenerate semiconductors, there is a slight possibility that the enhancement of Fermi level will be beneficial to increase the amount of holes, as reflected in a corresponding increase in carrier concentration.
(iv) The electrical conductivity is dependent on the carrier concentration. And the value at 0.125 at.%Er reaches a maximum value of over 1000 S·cm−1 at 400 K. It is much higher than those of the nanostructured alloy and the RTG sample.
(v) The increase in carrier concentration with the increasing amount of Er addition in the alloys is reflected in a corresponding decline in Seebeck coefficient. The values of all samples fall in the range of 125–235 μV·K−1and are comparable to those of the nanostructure alloy and the RTG sample.
(vi) In the whole temperature range the power factor tends to increase with increasing content of Er addition. The maximum value reaches about 22.8 μW·K−1·cm−1 at 900 K with 0.125 at.%Er addition and is about 50% improvement over that of the pristine sample in this study.
(vii) The samples with Er addition exhibit better ZTs than that without Er addition. The optimal ratio of Er addition is actually in the range of 0.085–0.125 at.%. The maximum value is almost 0.5 at 900 K in this study.
ACKNOWLEDGMENT
The authors acknowledge the financial support of this work from the Scientific Research Startup Fund Project of Beijing Municipal Bureau of Personnel (Q2009012200801).